
EV/EBITDA Sector-Relative Value on Canadian Stocks: An Honest Assessment
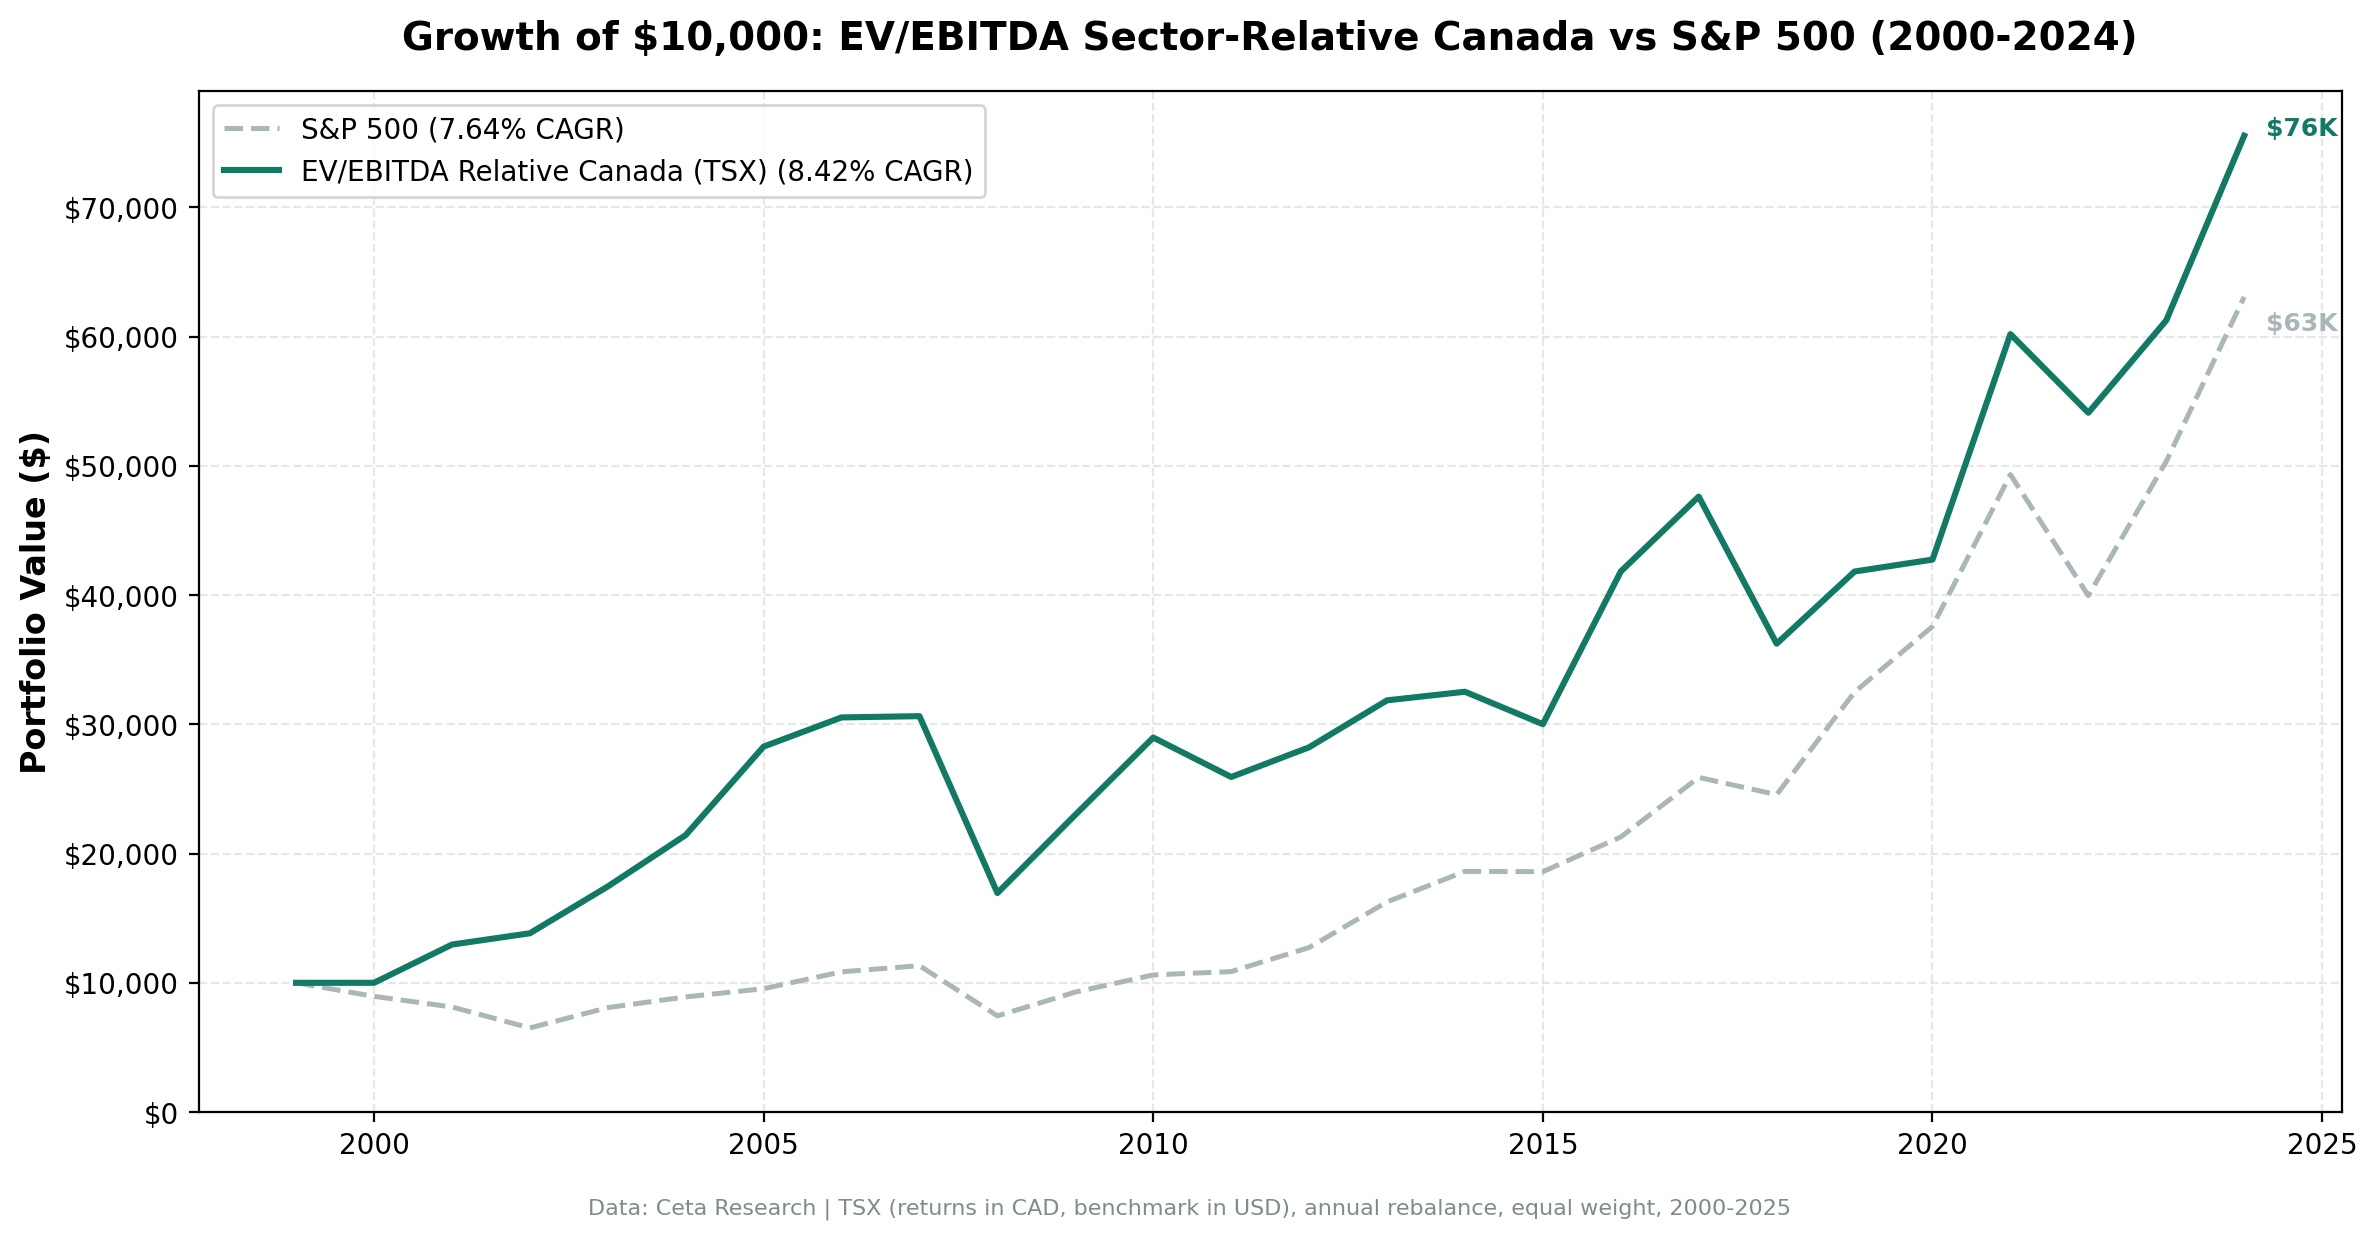
We backtested sector-relative EV/EBITDA on 23 years of Canadian stocks (TSX). 7.16% CAGR vs 4.44% TSX Composite (+2.72% excess), but max drawdown -44.68% and Sharpe 0.233. The signal works when sector discounts have a catalyst. In Canada's resource-heavy TSX, they often don't.

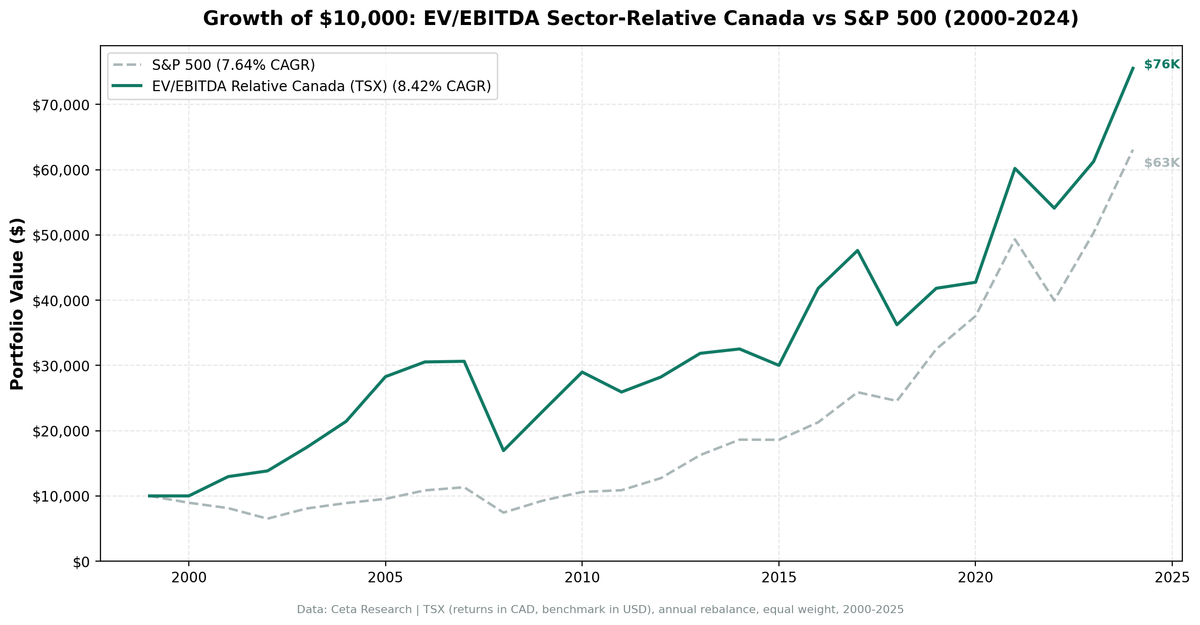
We ran a sector-relative EV/EBITDA screen on 24 years of Canadian stock data from the TSX. The signal: buy when a stock's EV/EBITDA falls below 70% of its sector median, filtered for quality. The result: 7.16% CAGR vs 4.44% for the TSX Composite. On the surface, that's +2.72% excess return. But the max drawdown of -44.68% is severe, the win rate is only 60%, and a Sharpe below 0.25 means the risk-adjusted story is weak. Canada is a useful case study in when sector-relative signals work and when they don't.
Contents
- Method
- The Screen
- Sector-Relative EV/EBITDA Screen for TSX (SQL)
- What We Found
- 23 invested years. 60% win rate. +2.72% annual excess vs TSX. Still a weak risk-adjusted story.
- What happened in the early years
- Year-by-year returns
- 2008: the worst year
- 2012-2015: four years of consistent underperformance
- 2016: +24.9% excess — the commodity rebound
- Why Canada's resource composition is a structural problem
- Backtest Methodology
- Limitations
- Conclusion
Data: FMP financial data warehouse, 2000–2025. Updated March 2026.
Method
| Parameter | Detail |
|---|---|
| Data source | Ceta Research (FMP financial data warehouse) |
| Universe | TSX (Toronto Stock Exchange), MCap > CAD $500M |
| Signal | Stock EV/EBITDA < 70% of sector median (30%+ discount to peers) |
| EV/EBITDA range | 0.5-25x |
| Quality filters | ROE > 8%, D/E < 2.0 |
| Portfolio | Top 30 by deepest discount, equal weight |
| Rebalancing | Annual (January) |
| Cash rule | Hold cash if fewer than 10 stocks qualify |
| Period | 2000-2025 (25 years, 2 cash periods) |
| Benchmark | TSX Composite |
Financial data sourced from key_metrics_ttm for EV/EBITDA and market cap, financial_ratios_ttm for debt metrics, profile for sector classification. 45-day lag on all financial statements to prevent look-ahead bias.
The Screen
Sector-Relative EV/EBITDA Screen for TSX (SQL)
WITH universe AS (
    SELECT k.symbol, p.companyName, p.exchange, p.sector,
           k.evToEBITDATTM AS ev_ebitda, k.returnOnEquityTTM AS roe,
           fr.debtToEquityRatioTTM AS de, k.marketCap
    FROM key_metrics_ttm k
    JOIN financial_ratios_ttm fr ON k.symbol = fr.symbol
    JOIN profile p ON k.symbol = p.symbol
    WHERE k.evToEBITDATTM BETWEEN 0.5 AND 25
      AND k.returnOnEquityTTM > 0.08
      AND (fr.debtToEquityRatioTTM IS NULL OR (fr.debtToEquityRatioTTM >= 0 AND fr.debtToEquityRatioTTM < 2.0))
      AND k.marketCap > 500000000
      AND p.sector IS NOT NULL
      AND p.exchange IN ('TSX')
),
sector_medians AS (
    SELECT exchange, sector,
           PERCENTILE_CONT(0.5) WITHIN GROUP (ORDER BY ev_ebitda) AS median_ev_ebitda,
           COUNT(*) AS n_sector_stocks
    FROM universe GROUP BY exchange, sector HAVING COUNT(*) >= 5
)
SELECT u.symbol, u.companyName, u.exchange, u.sector,
       ROUND(u.ev_ebitda, 2) AS ev_ebitda_ttm,
       ROUND(sm.median_ev_ebitda, 2) AS sector_median_ev_ebitda,
       ROUND(u.ev_ebitda / sm.median_ev_ebitda, 3) AS ev_ratio_to_sector,
       ROUND((1 - u.ev_ebitda / sm.median_ev_ebitda) * 100, 1) AS discount_pct,
       ROUND(u.roe * 100, 1) AS roe_pct,
       ROUND(u.de, 2) AS debt_to_equity,
       ROUND(u.marketCap / 1e9, 2) AS mktcap_b
FROM universe u JOIN sector_medians sm ON u.exchange = sm.exchange AND u.sector = sm.sector
WHERE u.ev_ebitda / sm.median_ev_ebitda < 0.70
ORDER BY u.ev_ebitda / sm.median_ev_ebitda ASC LIMIT 30
Run this screen on Ceta Research
What We Found
23 invested years. 60% win rate. +2.72% annual excess vs TSX. Still a weak risk-adjusted story.
| Metric | EV/EBITDA Sector-Relative (Canada) | TSX Composite |
|---|---|---|
| CAGR | 7.16% | 4.44% |
| Excess return | +2.72% | — |
| Sharpe Ratio | 0.233 | — |
| Max Drawdown | -44.68% | — |
| Down Capture | 96.07% | 100% |
| Win Rate | 60% | — |
| Avg Stocks per Year | 21.5 | — |
| Cash Periods | 2 of 25 | — |
The down-capture of 96.07% means the strategy absorbs essentially all of the TSX Composite's downturns — there's almost no protection in down markets. The max drawdown of -44.68% confirms this. The +2.72% annual excess is real, but it comes with the same downside exposure as the index plus severe drawdowns.
The Sharpe ratio of 0.233 is low. On a risk-adjusted basis, this strategy barely justifies the active approach over just holding the TSX.
What happened in the early years
The strategy's positive CAGR case rests heavily on 2001-2005:
| Year | Strategy | S&P 500 | Excess |
|---|---|---|---|
| 2001 | +29.6% | -9.2% | +38.7% |
| 2002 | +6.8% | -19.9% | +26.7% |
| 2004 | +22.8% | +10.2% | +12.6% |
| 2005 | +31.9% | +7.2% | +24.8% |
| 2016 | +39.4% | +14.4% | +24.9% |
| 2021 | +40.8% | +31.3% | +9.6% |
Those early years reflect a period when Canadian resource stocks were cheap relative to their own sector peers, and then the commodity supercycle of 2003-2007 began closing those discounts. Energy, metals, and materials stocks that were unloved at the end of the dot-com era repriced sharply. The signal happened to be pointing exactly at those names.
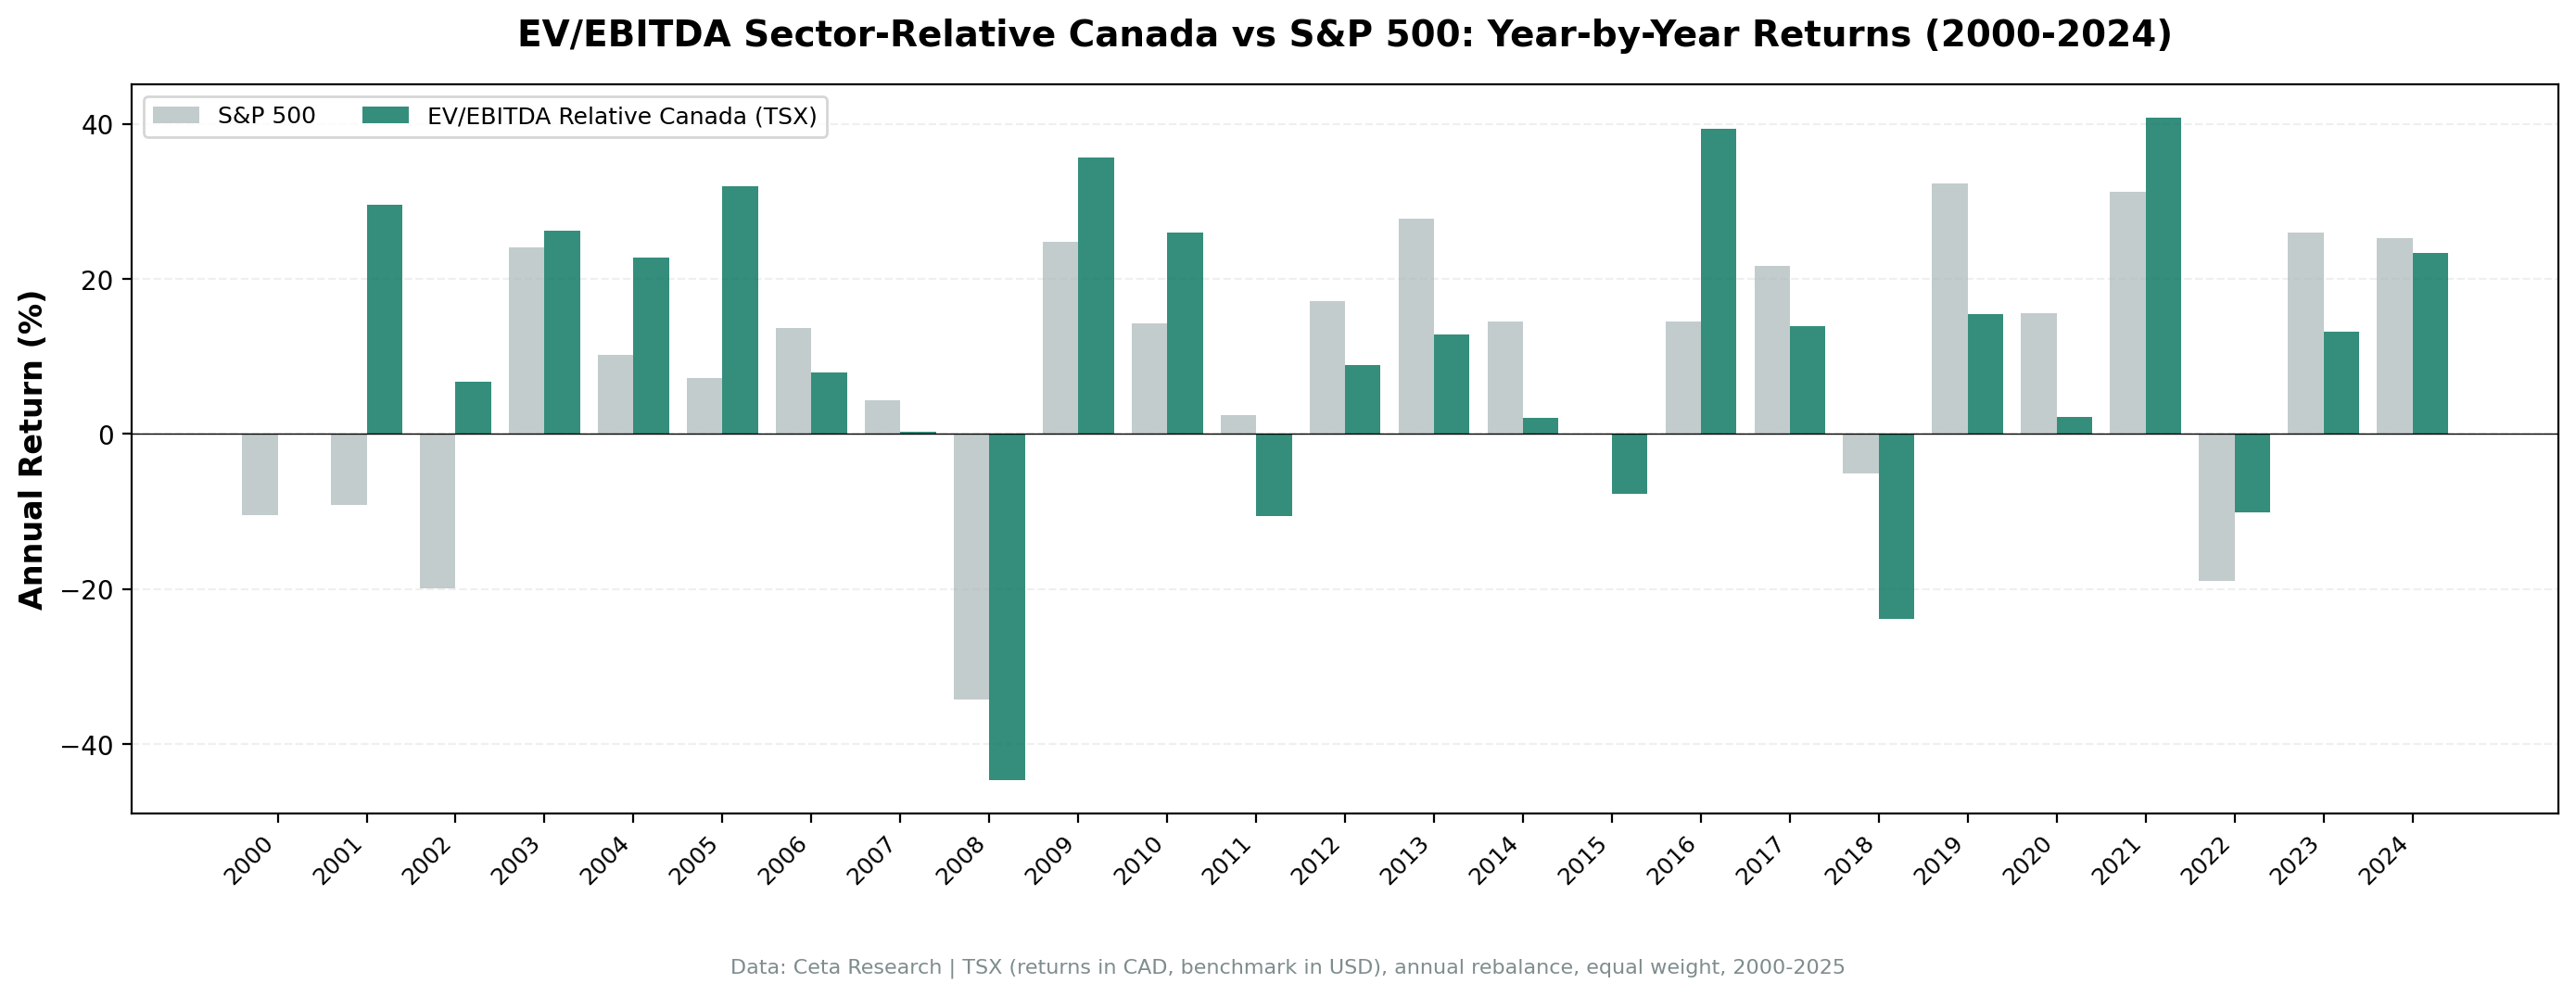
Year-by-year returns
| Year | Strategy | TSX Composite | Excess |
|---|---|---|---|
| 2000 | 0% (cash) | — | - |
| 2001 | +29.6% | -9.2% | +38.7% |
| 2002 | +6.8% | -19.9% | +26.7% |
| 2003 | +26.2% | +24.1% | +2.0% |
| 2004 | +22.8% | +10.2% | +12.6% |
| 2005 | +31.9% | +7.2% | +24.8% |
| 2006 | +8.0% | +13.7% | -5.7% |
| 2007 | +0.3% | +4.4% | -4.1% |
| 2008 | -44.7% | -34.3% | -10.4% |
| 2009 | +35.7% | +24.7% | +11.0% |
| 2010 | +26.0% | +14.3% | +11.7% |
| 2011 | -10.5% | +2.5% | -13.0% |
| 2012 | +8.9% | +17.1% | -8.2% |
| 2013 | +12.9% | +27.8% | -14.9% |
| 2014 | +2.1% | +14.5% | -12.4% |
| 2015 | -7.7% | -0.1% | -7.6% |
| 2016 | +39.4% | +14.4% | +24.9% |
| 2017 | +13.8% | +21.6% | -7.8% |
| 2018 | -23.9% | -5.2% | -18.8% |
| 2019 | +15.4% | +32.3% | -16.9% |
| 2020 | +2.2% | +15.6% | -13.4% |
| 2021 | +40.8% | +31.3% | +9.6% |
| 2022 | -10.1% | -19.0% | +8.9% |
| 2023 | +13.2% | +26.0% | -12.8% |
| 2024 | +23.3% | +25.3% | -2.0% |
2008: the worst year
The -44.7% in 2008 drove the max drawdown beyond SPY's -34.3%. Canadian oil, gas, and mining stocks fell catastrophically as commodity prices collapsed. The EV/EBITDA signal had loaded the portfolio into exactly these sectors because they were trading at discounts to their sector peers. When the global cycle reversed and commodity demand collapsed, those discounts deepened rather than closed.
This is the core problem with sector-relative signals in resource-heavy markets: the signal can't distinguish between a temporary mispricing and a structural repricing of the entire sector.
2012-2015: four years of consistent underperformance
After a decent recovery in 2009-2010, the strategy fell behind SPY in every year from 2012 to 2015. Canadian energy and materials stocks spent these years undergoing a prolonged re-rating as US shale production reshaped global oil markets. The signal kept pointing at resource discounts. Those discounts didn't close on any reasonable timeline.
2016: +24.9% excess — the commodity rebound
Oil prices recovered in 2016. Resource stocks that had been deeply discounted for four years finally repriced. This is the strategy working exactly as intended: the long wait for discount closure. But the patience required (four consecutive underperforming years) is difficult to maintain in practice.
Why Canada's resource composition is a structural problem
The sector-relative signal works when discount stocks are cheap because of temporary sentiment, not because of fundamental sector-level repricing. In Canadian energy and materials, the "discount" often reflects:
- Lower-quality reserves or assets within the same sector
- Sector-wide commodity price cycles that depress all sector multiples simultaneously
- Canadian producers structurally trading at a discount to US peers due to infrastructure and pipeline constraints
The signal sees "cheap vs sector median" and buys. But if the sector median itself is being dragged down by the same forces affecting the discount stocks, mean reversion doesn't occur on any useful timeline.
Backtest Methodology
Full methodology: backtests/METHODOLOGY.md
| Parameter | Choice |
|---|---|
| Universe | TSX, MCap > CAD $500M |
| Signal | EV/EBITDA < 70% of sector median, range 0.5-25x |
| Quality | ROE > 8%, D/E < 2.0 |
| Portfolio | Top 30 by deepest discount, equal weight |
| Rebalancing | Annual (January) |
| Cash rule | Hold cash if < 10 qualify |
| Benchmark | TSX Composite |
| Period | 2000-2025 (25 years) |
| Data | Point-in-time (45-day lag on FY financial statements) |
| Transaction costs | 0.1% one-way (size-tiered by market cap) |
Limitations
MaxDD -44.68%. Severe. Resource sector concentration in down cycles explains most of this. The 2008 crash, where Canadian oil, gas, and mining stocks fell catastrophically, drove the majority of this drawdown.
Win rate 44%. The strategy underperforms SPY in more years than it outperforms. Fewer than half of all years generate positive excess returns.
Sector concentration risk. The TSX is heavily weighted toward energy, financials, and materials. Without a sector cap, the portfolio can cluster in resource stocks. A bad commodity cycle (2012-2015, 2018-2020) creates prolonged stretches of underperformance.
Currency effects. Returns are in CAD. The TSX Composite is also in CAD, so the local comparison is clean. USD-based investors carry CAD/USD exposure, which tracks oil prices and can amplify volatility in commodity-driven years.
The CAGR case is fragile. Remove the 2001-2005 commodity supercycle period and the strategy's edge narrows significantly. The long-run positive result depends heavily on those early years.
Conclusion
Sector-relative EV/EBITDA on Canada's TSX delivers 7.16% CAGR vs 4.44% for the TSX Composite. The honest read: +2.72% annual excess return while carrying -44.68% max drawdown and a Sharpe ratio of 0.233. The win rate of 60% is better than it sounds, but the 96.07% down-capture means you get essentially none of the downside protection that makes this strategy compelling in other markets.
The signal works in Canada when sector discounts have a specific catalyst, like the 2003-2005 commodity supercycle or the 2016 oil rebound. Between those windows, it's a waiting game with no guarantee the discount closes on any useful timeline.
For investors in Canada's resource-heavy market, the question isn't whether value investing works in theory. It's whether "cheap vs sector median" is a reliable signal when the sector itself is cyclically distressed. The data suggests it often isn't.
Data: Ceta Research (FMP financial data warehouse). Returns in CAD (local currency). Benchmark S&P 500 in USD. Past performance does not guarantee future results. See full methodology at github.com/ceta-research/backtests.


