
We Tested the ETF Orphan Thesis on 20 Years of US Data. It Doesn't Work.
We backtested a portfolio of quality stocks held by fewer than 10 ETFs over 20 years. Result: 0.90% CAGR vs 10.61% for SPY. The ETF orphan thesis fails. Quality stocks outside ETFs are underowned for a reason.

Quality stocks ignored by ETFs should be bargains. High ROE, low debt, solid margins, but sitting in fewer than 10 funds. Academic research on neglect premiums predicts these stocks should outperform. Piotroski (2000) showed quality signals work 2x better among less-followed stocks.
Contents
- Method
- What Research Predicted
- Results
- Year-by-Year Returns
- Why It Fails
- When It (Briefly) Works
- How This Compares to Anti-Crowding
- The Screen
- Limitations
- Takeaway
- Part of a Series
- References
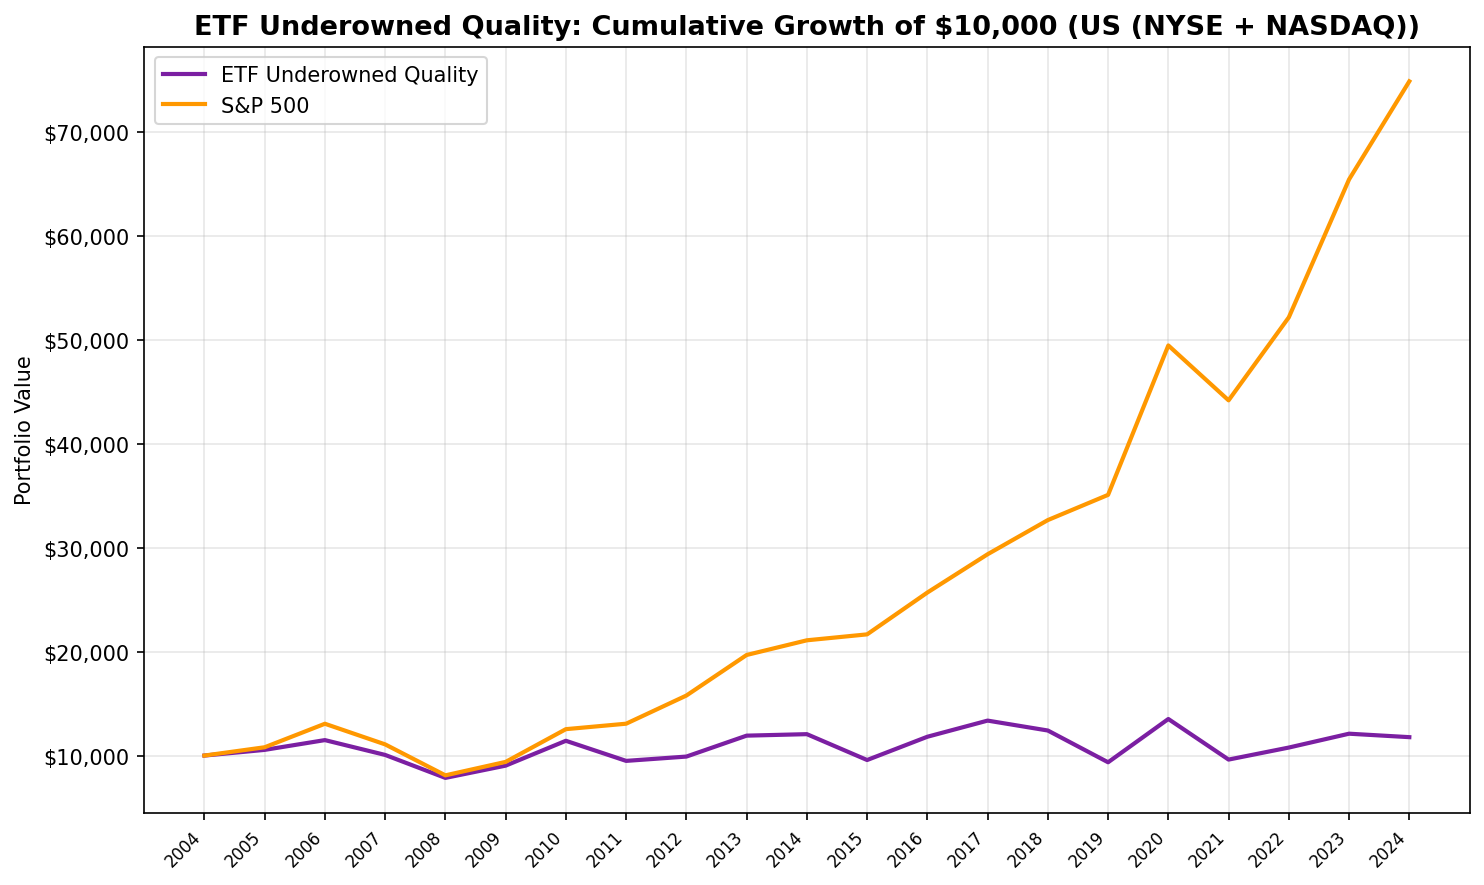
We built a portfolio around this idea. Over 20 years, it returned 0.82% annually. The S&P 500 returned 10.59%. $10,000 became $11,772. The same $10,000 in SPY became $74,880.
The ETF orphan thesis doesn't work. Here's why.
Data: FMP financial data warehouse, 2000–2025. Updated March 2026.
Method
Data source: Ceta Research (FMP financial data warehouse) Universe: NYSE + NASDAQ Period: July 2005 to July 2025 (20 annual periods) Rebalancing: Annual (July, 45-day lag for FY filings), next-day execution Benchmark: SPY (S&P 500 ETF) Transaction costs: Size-tiered (0.1% for >$10B market cap, 0.3% for $2-10B, 0.5% for <$2B, one-way)
Signal: Screen for quality stocks (ROE > 12%, D/E < 1.0, current ratio > 1.5, net margin > 5%, P/E between 0 and 40, market cap > $1B) held by fewer than 10 ETFs. Rank by ROE descending. Top 30, equal weight. Cash if fewer than 10 qualify.
This is a stricter quality screen than our anti-crowding backtest. That test selected the least-crowded among stocks already in 5+ ETFs. This one flips the approach: find the highest-quality stocks that ETFs have mostly skipped.
Data caveat: The etf_holder table contains current ETF holdings only. No historical snapshots exist. Ownership classifications are applied retrospectively, introducing look-ahead bias in the ETF count signal. Quality filters use point-in-time FY data and are free of this bias.
What Research Predicted
Piotroski (2000) found the F-Score long-short spread was 13.4% among small-caps vs 5-6% among large-caps. Quality signals work better where fewer people are watching.
Stambaugh, Yu, and Yuan (2015) showed factor premiums are stronger in harder-to-arbitrage stocks. Fewer arbitrageurs means mispricings persist longer.
Merton (1987) predicted that stocks with limited investor awareness should offer higher expected returns. His incomplete information model says less-known stocks carry a "shadow cost" premium.
The prediction: quality stocks outside the ETF spotlight should deliver better risk-adjusted returns. Fundamental analysis should have the strongest edge where passive flows are absent.
Results
| Metric | Underowned Quality | S&P 500 |
|---|---|---|
| CAGR | 0.82% | 10.59% |
| Total Return | 17.7% | 648.8% |
| Sharpe Ratio | -0.061 | 0.536 |
| Sortino Ratio | -0.09 | 1.069 |
| Max Drawdown | -31.66% | -38.01% |
| Volatility | 19.45% | 16.04% |
| Win Rate vs SPY | 20.0% | -- |
| Beta | 1.021 | 1.00 |
| Alpha | -9.95% | -- |
| Up Capture | 39.9% | 100% |
| Down Capture | 119.9% | 100% |
$10,000 invested in 2005 grew to $11,772 with the underowned quality portfolio. The same $10,000 in SPY grew to $74,880.
The portfolio held an average of 17.9 stocks per year, with an average ETF holder count of 2.4. These are genuinely overlooked names. Most sit in zero or one ETF.
The negative Sharpe ratio tells the story. After accounting for the risk-free rate, this portfolio destroyed value on a risk-adjusted basis. The up capture of 39.9% with a down capture of 119.9% means it captured about a third of the upside and all of the downside.
Year-by-Year Returns
| Year | Underowned Quality | SPY | Excess |
|---|---|---|---|
| 2005 | +5.5% | +8.0% | -2.5% |
| 2006 | +8.9% | +20.9% | -12.0% |
| 2007 | -12.4% | -15.2% | +2.8% |
| 2008 | -22.0% | -26.9% | +4.9% |
| 2009 | +15.0% | +16.0% | -1.0% |
| 2010 | +26.5% | +33.5% | -7.1% |
| 2011 | -16.9% | +4.2% | -21.1% |
| 2012 | +4.4% | +20.7% | -16.4% |
| 2013 | +20.3% | +24.7% | -4.4% |
| 2014 | +1.2% | +7.2% | -6.0% |
| 2015 | -20.6% | +2.7% | -23.4% |
| 2016 | +23.4% | +18.6% | +4.8% |
| 2017 | +13.2% | +14.3% | -1.2% |
| 2018 | -7.1% | +11.2% | -18.3% |
| 2019 | -24.6% | +7.4% | -32.1% |
| 2020 | +44.5% | +41.0% | +3.5% |
| 2021 | -28.9% | -10.7% | -18.2% |
| 2022 | +12.0% | +18.1% | -6.0% |
| 2023 | +12.4% | +25.4% | -13.1% |
| 2024 | -2.8% | +14.4% | -17.2% |
The portfolio won 4 of 20 years. That's the worst hit rate of any quality strategy we've tested. Two of the worst years: 2019 (-24.6% vs +7.4%) and 2015 (-20.6% vs +2.7%), both in calm markets where the portfolio simply fell apart.
Why It Fails
Three mechanisms explain the consistent underperformance.
1. "Underowned" is a signal, and it's bearish. In the US, stocks end up in fewer than 10 ETFs for reasons. Many face pending litigation, governance concerns, declining revenue trends, or sector headwinds that quality screens can't detect. ROE > 12% and D/E < 1.0 filter out obvious junk, but they miss qualitative problems that institutional investors can see. The market isn't wrong about these stocks. The quality screen just can't see what the market sees.
2. The quality bar is high but the candidates are weak. Requiring five simultaneous quality filters (ROE, D/E, current ratio, net margin, P/E) narrows the pool. But combining that with "fewer than 10 ETFs" eliminates most well-run companies that meet those criteria. What's left tends to be companies where the good fundamentals are recent or temporary, or where a structural issue keeps ETF managers away despite the numbers looking clean.
3. No passive flow tailwind. ETF inflows are steady and mechanical. Every stock in the S&P 500 receives a proportional bid from every dollar flowing into SPY, VOO, or IVV. Stocks in fewer than 10 ETFs miss almost all of this. Over 20 years of rising passive allocations, that persistent tailwind compounded into an enormous return advantage for included stocks.
When It (Briefly) Works
The portfolio outperformed during stress. In 2007-2008, it lost less than SPY (-12.4% and -22.0% vs -15.2% and -26.9%). In 2020's recovery, it gained +44.5% vs +41.0%.
This tracks with the neglect thesis. During selloffs, ETF outflows hit included stocks through mechanical selling. Stocks outside ETFs avoid that pressure. But these episodes are short and rare. The 2007-2008 outperformance totaled +7.7% in combined excess returns. The 2010-2021 underperformance more than erased all of it.
The crisis protection exists. It's overwhelmed by the persistent drag in normal markets.
How This Compares to Anti-Crowding
We ran a related test in the ETF Anti-Crowding backtest: select the least-crowded quality stocks among those already held by at least 5 ETFs. That returned 4.56% CAGR.
The underowned quality approach is worse (0.90% vs 4.56%). The difference: anti-crowding selects stocks that are marginally less popular among investable names. Underowned selects stocks that passive money has largely skipped. Moving further away from ETF coverage makes the signal worse, not better.
| Strategy | CAGR | Sharpe | AvgETF |
|---|---|---|---|
| Anti-Crowding (etf-02) | 4.56% | 0.136 | 6.6 |
| Underowned Quality (etf-03) | 0.82% | -0.061 | 2.4 |
| SPY | 10.59% | 0.536 | -- |
The Screen
Current screen for underowned quality stocks:
WITH etf_counts AS (
  SELECT
    eh.asset AS symbol,
    COUNT(DISTINCT eh.symbol) AS etf_count
  FROM etf_holder eh
  JOIN profile p ON eh.asset = p.symbol
  WHERE p.exchange IN ('NYSE', 'NASDAQ')
  GROUP BY eh.asset
)
SELECT
  r.symbol,
  COALESCE(e.etf_count, 0) AS etf_count,
  ROUND(k.returnOnEquityTTM * 100, 1) AS roe_pct,
  ROUND(r.debtToEquityRatioTTM, 2) AS debt_to_equity,
  ROUND(r.currentRatioTTM, 2) AS current_ratio,
  ROUND(r.netProfitMarginTTM * 100, 1) AS net_margin_pct,
  ROUND(r.priceToEarningsRatioTTM, 1) AS pe_ratio,
  ROUND(k.marketCap / 1e9, 1) AS market_cap_bn
FROM financial_ratios_ttm r
JOIN key_metrics_ttm k ON r.symbol = k.symbol
LEFT JOIN etf_counts e ON r.symbol = e.symbol
WHERE COALESCE(e.etf_count, 0) < 10
  AND k.returnOnEquityTTM > 0.12
  AND r.debtToEquityRatioTTM BETWEEN 0 AND 1.0
  AND r.currentRatioTTM > 1.5
  AND r.netProfitMarginTTM > 0.05
  AND r.priceToEarningsRatioTTM > 0
  AND r.priceToEarningsRatioTTM < 40
  AND k.marketCap > 1000000000
ORDER BY k.returnOnEquityTTM DESC
LIMIT 30
Run this screen on Ceta Research
Limitations
Snapshot ETF data. The biggest limitation. ETF holdings are current-day only. Stocks that are under-owned today may have been in more ETFs historically, or vice versa. This look-ahead bias in the ownership signal likely overstates the "true" orphan effect. Since the strategy underperforms, the real version would likely perform even worse.
Annual rebalancing. The portfolio rebalances once per year. A stock's ETF count and quality metrics can shift within a year. Quarterly rebalancing might produce different results, but would also increase transaction costs.
Strict quality filters. Five simultaneous filters (ROE, D/E, current ratio, net margin, P/E) narrow the universe aggressively. Relaxing any single filter would change the candidate pool. The interaction between quality filters and the ETF ownership cutoff is the core dynamic.
SPY benchmark. SPY represents large-cap US stocks. An equal-weight benchmark (RSP) or mid-cap benchmark (MDY) might be more appropriate given the portfolio's composition.
Survivorship. Stocks that delisted during the period are excluded from current ETF holdings data. This creates a bias toward survivors in the ownership classification.
Takeaway
The ETF orphan thesis is intuitive. Quality stocks that passive money ignores should trade at a discount. Academic research supports the neglect premium in theory. Piotroski showed quality signals are 2x more effective among less-followed stocks.
But "less-followed" in academic research means lower analyst coverage and institutional ownership. "Under-owned by ETFs" is a different filter. In the US, it selects stocks that institutional investors have actively decided to avoid. The quality metrics can't see the reasons why.
The practical lesson: ETF ownership is informative. Stocks outside ETFs aren't hidden bargains. They're stocks where the market has information that a five-variable quality screen can't capture. The ETF orphan filter doesn't find neglected quality. It finds quality metrics that haven't yet reflected the underlying problems.
Part of a Series
This is the US edition of our ETF Underowned Quality backtest series. See also: - Germany: The One Market Where Underowned Quality Works - 18 Exchanges Compared: The ETF Orphan Thesis
References
- Piotroski, J. (2000). "Value Investing: The Use of Historical Financial Statement Information to Separate Winners from Losers." Journal of Accounting Research, 38(Supplement), 1-41.
- Stambaugh, R., Yu, J. & Yuan, Y. (2015). "Arbitrage Asymmetry and the Idiosyncratic Volatility Puzzle." Journal of Finance, 70(5), 1903-1948.
- Merton, R. (1987). "A Simple Model of Capital Market Equilibrium with Incomplete Information." Journal of Finance, 42(3), 483-510.
Data: Ceta Research (FMP financial data warehouse), July 2005 to July 2025. ETF holdings are current snapshot data. Full methodology: backtests/METHODOLOGY.md. Code: backtests/etf-underowned. Past performance does not guarantee future results. This is educational content, not investment advice.


