
Underowned Quality Stocks on 18 Exchanges: The ETF Orphan Thesis Fails Globally
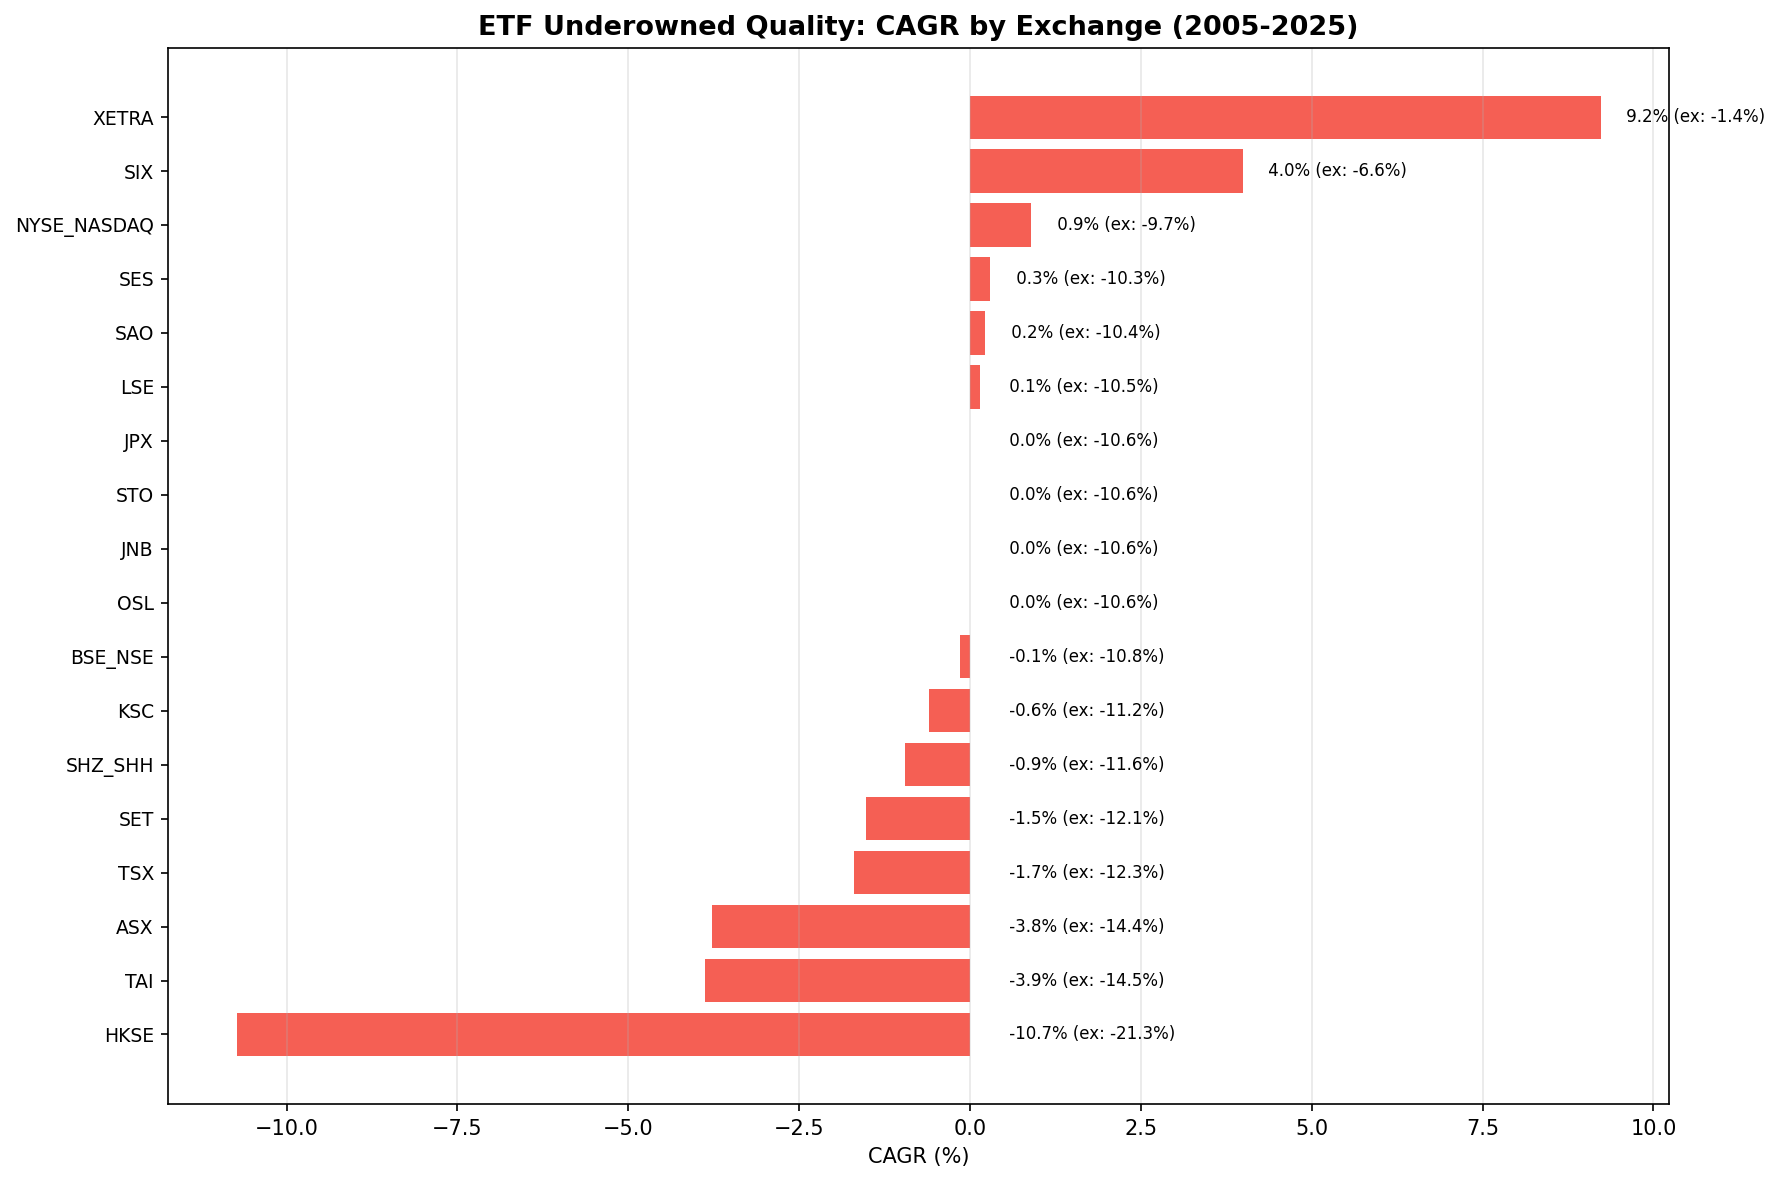
We screened 18 exchanges for quality stocks held by fewer than 10 ETFs. Only Germany produced competitive returns (9.23% CAGR). The US returned 0.90%. Six exchanges had zero qualifying stocks. The orphan thesis is a global negative result.

We screened 18 stock exchanges for quality stocks held by fewer than 10 ETFs. ROE > 12%, D/E < 1.0, current ratio > 1.5, net margin > 5%, P/E between 0 and 40. Ranked by ROE, top 30, equal weight, annual rebalancing.
Contents
- Method
- The Full Results
- Exchanges With Clean Data (16+ invested periods)
- Exchanges With Partial Data (11-15 invested periods)
- Excluded (Data Quality Issues)
- Excluded (100% or Near-100% Cash)
- What Separates Germany From Everyone Else
- The "Strict Filter" Problem
- Risk Characteristics
- Comparison With Anti-Crowding (etf-02)
- The Screen
- Excluded Exchanges
- Part of a Series
- Takeaway
- References
Only 1 of 18 exchanges produced competitive returns. Germany returned 7.42% CAGR with a 0.383 Sharpe ratio and lower drawdown than the DAX itself. The US returned 0.82%. The UK returned -0.39%. India returned -3.15%. Four exchanges spent 100% of the period in cash because no stocks qualified.
The underowned quality thesis is a negative result, and an informative one.
Data: FMP financial data warehouse, 2000–2025. Updated April 2026.
Method
Data source: Ceta Research (FMP financial data warehouse) Period: July 2005 to July 2025 (20 annual periods) Rebalancing: Annual (July, 45-day lag for FY filings), next-day execution Benchmark: Local currency index (DAX for Germany, FTSE for UK, Sensex for India, etc.). SPY used for cross-market comparison in the table below. Transaction costs: Size-tiered (0.1-0.5% one-way based on market cap)
Signal: Quality stocks (ROE > 12%, D/E < 1.0, current ratio > 1.5, net margin > 5%, P/E 0-40) held by fewer than 10 ETFs. Rank by ROE descending. Top 30, equal weight. Cash if fewer than 10 qualify.
Market cap thresholds: Exchange-specific in local currency. US: $1B, India: Rs 20B (~$240M), Germany: EUR 500M (~$545M). Full mapping in cli_utils.py.
Data caveat: ETF holdings are a current snapshot. Ownership classifications are static across all periods (look-ahead bias in ETF signal). Quality filters use point-in-time FY data.
The Full Results
The table below uses SPY as the cross-market benchmark to enable direct comparison. Local benchmark results appear in the notes column where they differ significantly.
Exchanges With Clean Data (16+ invested periods)
| Exchange | CAGR | Excess vs SPY | Sharpe | MaxDD | AvgStk | AvgETF | Local Benchmark Note |
|---|---|---|---|---|---|---|---|
| Germany (XETRA) | 7.42% | -3.17% | 0.383 | -28.1% | 18.2 | 0.5 | -1.11% vs DAX; Sharpe beats DAX (0.383 vs 0.331) |
| Switzerland (SIX) | 2.00% | -8.59% | 0.062 | -57.1% | 5.0 | 0.7 | -1.28% vs SMI |
| US (NYSE+NASDAQ) | 0.82% | -9.77% | -0.061 | -31.7% | 17.9 | 2.4 | SPY is local benchmark |
| UK (LSE) | -0.39% | -10.98% | -0.167 | -62.9% | 9.1 | 1.5 | -3.06% vs FTSE 100 |
| Thailand (SET) | -0.80% | -11.39% | -0.209 | -52.7% | 15.8 | 2.8 | -3.39% vs SET Index |
| India (NSE) | -3.15% | -13.74% | -0.559 | -56.1% | 15.4 | 2.7 | -16.12% vs Sensex (Sensex returned 12.97%) |
| Canada (TSX) | -5.00% | -15.59% | -0.478 | -72.5% | 9.7 | 1.6 | -10.10% vs TSX Composite |
Exchanges With Partial Data (11-15 invested periods)
| Exchange | CAGR | Excess vs SPY | Sharpe | MaxDD | AvgStk | Cash% |
|---|---|---|---|---|---|---|
| Brazil (SAO) | 1.35% | -9.24% | -0.674 | -44.4% | 6.1 | 50% |
| Taiwan (TAI) | -3.31% | -13.90% | -0.530 | -53.7% | 9.5 | 45% |
| Singapore (SES) | 0.37% | -10.22% | -0.414 | -14.5% | 3.7 | 85% |
Excluded (Data Quality Issues)
| Exchange | Issue |
|---|---|
| Hong Kong (HKSE) | -91.4% max drawdown (data artifact) |
| China (SHZ+SHH) | -84.4% max drawdown (extreme, unreliable) |
| Australia (ASX) | -67.4% max drawdown (known price split adjustment issues) |
Excluded (100% or Near-100% Cash)
| Exchange | Cash Periods | Reason |
|---|---|---|
| Japan (JPX) | 20/20 | Quality + ETF filter too strict for Japanese market |
| Sweden (STO) | 20/20 | No qualifying stocks in any period |
| South Africa (JNB) | 20/20 | No qualifying stocks in any period |
| Norway (OSL) | 20/20 | No qualifying stocks in any period |
| Korea (KSC) | 19/20 | Only 1 invested period |
What Separates Germany From Everyone Else
The answer isn't complicated. Germany has a structural feature that no other major market shares: a large pool of profitable mid-cap industrials with genuinely zero ETF coverage.
Average ETF count in portfolio:
| Exchange | AvgETF | Interpretation |
|---|---|---|
| Germany | 0.5 | Genuinely undiscovered by passive money |
| Switzerland | 0.7 | Similar dynamic, smaller pool |
| UK | 1.5 | Under-owned but not invisible |
| Canada | 1.6 | Under-owned but not invisible |
| US | 2.4 | Under-owned, likely avoided for reasons |
| Thailand | 2.8 | Thin ETF market, filter isn't selective |
| India | 2.7 | Thin ETF market, filter isn't selective |
Germany's portfolio stocks average 0.5 ETFs. These are companies that passive money literally hasn't found. In the US, the average of 2.4 means the stocks have some visibility but are being actively excluded from most products. There's a meaningful difference between "invisible" and "avoided."
The Mittelstand dynamic: German mid-cap industrials dominate niche global markets (precision engineering, specialty chemicals, industrial automation) but are too small for DAX-tracking ETFs and too specific for thematic products. They have strong quality metrics because they're well-run export businesses, not because they're temporarily screening well before a decline.
In the US and UK, companies with fewer than 10 ETFs and strong quality metrics tend to be stocks where the fundamentals look good on paper but institutional investors have identified qualitative risks (governance, litigation, sector decline) that the screen can't capture.
The "Strict Filter" Problem
Five quality filters plus an ETF ownership ceiling is aggressive. On five exchanges (Japan, Sweden, South Africa, Norway, Korea), the combination found zero qualifying stocks in most or all periods.
This tells us something important. The intersection of "high quality" and "low ETF ownership" is small or empty on most exchanges. Quality stocks tend to be in ETFs. Stocks outside ETFs tend to lack quality. The Venn diagram overlap is thin.
Germany is the exception because its mid-cap industrial ecosystem produces companies with strong fundamentals (high ROE, low debt, solid margins) that happen to fall below ETF inclusion thresholds. That's a structural gap in passive coverage, not a market inefficiency.
Risk Characteristics
The underowned quality portfolio doesn't compensate for lower returns with lower risk. Across the seven exchanges with full data:
| Metric | Avg (ex-Germany) | Germany | SPY |
|---|---|---|---|
| Max Drawdown | -55.8% | -28.1% | -38.0% |
| Sharpe Ratio | -0.29 | 0.383 | 0.536 |
| Volatility | ~18% | 14.2% | 16.0% |
Excluding Germany, the average max drawdown (-55.8%) is far worse than SPY's -38.0%. The average Sharpe is deeply negative. Under-owned quality stocks are riskier and lower-returning in most markets.
Germany stands apart: lower max drawdown than SPY (-28.1% vs -38.0%), lower volatility (14.2% vs 16.0%), and a Sharpe ratio (0.383) that actually beats the local DAX (0.331). The risk profile there is genuinely attractive.
Comparison With Anti-Crowding (etf-02)
We tested a related strategy in ETF Anti-Crowding: select the least-crowded quality stocks among those already held by 5+ ETFs. Different signal, different results.
| Strategy | US CAGR | Germany CAGR | Best Market |
|---|---|---|---|
| Anti-Crowding (etf-02) | 4.56% | 7.12% | Brazil (+1.02% excess) |
| Underowned Quality (etf-03) | 0.82% | 7.42% | Germany (-1.11% vs DAX) |
| SPY | 10.59% | 10.59% | -- |
Anti-crowding produces better US results (4.56% vs 0.82%) because it selects from an investable universe of stocks already in ETFs. Underowned quality produces better German results (7.42% vs 7.12%) because the strict quality screen combined with genuine zero-ETF coverage captures the Mittelstand opportunity.
The pattern is consistent: moving further away from ETF coverage hurts returns in most markets. Germany is the exception where the structural gap creates real opportunity.
The Screen
Adapt for any exchange by changing the exchange filter:
WITH etf_counts AS (
  SELECT
    eh.asset AS symbol,
    COUNT(DISTINCT eh.symbol) AS etf_count
  FROM etf_holder eh
  JOIN profile p ON eh.asset = p.symbol
  WHERE p.exchange IN ('NYSE', 'NASDAQ')  -- Change this
  GROUP BY eh.asset
)
SELECT
  r.symbol,
  COALESCE(e.etf_count, 0) AS etf_count,
  ROUND(k.returnOnEquityTTM * 100, 1) AS roe_pct,
  ROUND(r.debtToEquityRatioTTM, 2) AS debt_to_equity,
  ROUND(r.currentRatioTTM, 2) AS current_ratio,
  ROUND(r.netProfitMarginTTM * 100, 1) AS net_margin_pct,
  ROUND(r.priceToEarningsRatioTTM, 1) AS pe_ratio,
  ROUND(k.marketCap / 1e9, 1) AS market_cap_bn
FROM financial_ratios_ttm r
JOIN key_metrics_ttm k ON r.symbol = k.symbol
LEFT JOIN etf_counts e ON r.symbol = e.symbol
WHERE COALESCE(e.etf_count, 0) < 10
  AND k.returnOnEquityTTM > 0.12
  AND r.debtToEquityRatioTTM BETWEEN 0 AND 1.0
  AND r.currentRatioTTM > 1.5
  AND r.netProfitMarginTTM > 0.05
  AND r.priceToEarningsRatioTTM > 0
  AND r.priceToEarningsRatioTTM < 40
  AND k.marketCap > 1000000000  -- Adjust per exchange
ORDER BY k.returnOnEquityTTM DESC
LIMIT 30
Run this screen on Ceta Research
Excluded Exchanges
| Exchange | Reason |
|---|---|
| HKSE | -91.4% max drawdown (data artifact) |
| China (SHZ+SHH) | -84.4% max drawdown (unreliable) |
| ASX | -67.4% max drawdown (known price split issues) |
| JPX, STO, JNB, OSL | 100% cash (quality + ETF filter eliminates entire exchange) |
| KSC | 95% cash (1 invested period in 20 years) |
All other exchanges with clean data are included regardless of performance. Underperformance isn't a reason to exclude. Only data quality issues or insufficient invested periods warrant exclusion.
Part of a Series
This is the global comparison post for the ETF Underowned Quality strategy: - US: The ETF Orphan Thesis Doesn't Work (flagship analysis) - Germany: Better Risk Than the DAX
Takeaway
The ETF orphan thesis fails globally. Across 18 exchanges and 20 years, buying quality stocks with fewer than 10 ETFs underperforms in every market except Germany. Five exchanges had zero qualifying stocks. Three had data quality issues severe enough to exclude. Among the ten with clean results, nine produced negative excess returns.
Germany works because of a structural feature unique to its market: a deep pool of profitable mid-cap industrials that genuinely fall below the ETF radar. The portfolio trails the DAX by 1.11% annually but beats the DAX on Sharpe ratio and max drawdown. This isn't a market inefficiency. It's a gap in passive coverage that reflects how index construction rules interact with Germany's corporate landscape.
The lesson from this global test: "underowned" and "undervalued" are different things. In most markets, quality stocks outside ETFs are outside ETFs for reasons. The quality screen can't see the reasons, but the market can. Germany is the rare case where the gap reflects genuine under-coverage rather than informed avoidance.
Data: Ceta Research (FMP financial data warehouse), July 2005 to July 2025. 18 exchanges tested. ETF holdings are current snapshot data (look-ahead bias in ownership signal, point-in-time quality filters). Full methodology: backtests/METHODOLOGY.md. Code: backtests/etf-underowned.
References
- Piotroski, J. (2000). "Value Investing: The Use of Historical Financial Statement Information to Separate Winners from Losers." Journal of Accounting Research, 38(Supplement).
- Stambaugh, R., Yu, J. & Yuan, Y. (2015). "Arbitrage Asymmetry and the Idiosyncratic Volatility Puzzle." Journal of Finance, 70(5).
- Merton, R. (1987). "A Simple Model of Capital Market Equilibrium with Incomplete Information." Journal of Finance, 42(3).
Past performance does not guarantee future results. This is educational content, not investment advice.


