
Underowned Quality Stocks in Germany: Better Risk Than the DAX Itself
Germany is the one market where quality stocks ignored by ETFs actually work. 9.23% CAGR, 0.460 Sharpe, -29.26% max drawdown over 20 years. The Mittelstand's structural ETF blind spot creates a genuine opportunity.

Underowned Quality Stocks in Germany: 7.42% CAGR, Better Risk Than the DAX
Germany is the one market where buying quality stocks that ETFs ignore produces competitive risk-adjusted returns.
Contents
- Method
- Why Germany Is Different
- Results
- Year-by-Year Returns
- When It Works
- When It Fails
- The Screen
- Limitations
- Takeaway
- Part of a Series
- References
Over 20 years on XETRA, a portfolio of quality stocks held by fewer than 10 ETFs returned 7.42% CAGR with a 0.383 Sharpe ratio. That trails the DAX's 8.54% CAGR by 1.11% annually. But the risk-adjusted story is different: the portfolio's Sharpe ratio (0.383) beats the DAX's (0.331), its max drawdown (-28.1%) is far better than the DAX's (-40.7%), and it posts a 2.39% alpha. Win rate vs DAX: 60%.
Across the 18 exchanges we tested, Germany is the only market where the underowned quality thesis produces competitive returns. Every other exchange underperformed badly.
Data: FMP financial data warehouse, 2000–2025. Updated April 2026.
Method
Data source: Ceta Research (FMP financial data warehouse) Universe: XETRA (Deutsche Boerse) Period: July 2005 to July 2025 (20 annual periods) Rebalancing: Annual (July, 45-day lag for FY filings), next-day execution Benchmark: DAX (^GDAXI, local currency) Transaction costs: Size-tiered (0.1% for >$10B market cap, 0.3% for $2-10B, 0.5% for <$2B, one-way)
Signal: Screen for quality stocks (ROE > 12%, D/E < 1.0, current ratio > 1.5, net margin > 5%, P/E between 0 and 40, market cap > EUR 500M) held by fewer than 10 ETFs. Rank by ROE descending. Top 30, equal weight. Cash if fewer than 10 qualify.
Data caveat: The etf_holder table contains current ETF holdings only. No historical snapshots exist. Ownership classifications are applied retrospectively. Quality filters use point-in-time FY data (no look-ahead bias). The ETF count signal has look-ahead bias.
Why Germany Is Different
Germany's stock market has a structural feature that other major markets lack: a deep bench of mid-cap industrials and specialty manufacturers that sit below the ETF radar.
The DAX 40 gets most of the passive attention. Below it, MDAX and SDAX companies are profitable, export-driven, often family-controlled businesses. They dominate niche global markets (industrial automation, specialty chemicals, precision engineering) but are too small for DAX-tracking ETFs and too niche for most thematic products.
The average ETF holder count in our German portfolio was 0.5. Most qualifying stocks sat in zero ETFs. In the US, the same screen produced an average of 2.4. The difference: German quality mid-caps genuinely have no passive coverage. US under-owned stocks have some coverage but are being actively avoided.
Results
| Metric | Underowned Quality | DAX |
|---|---|---|
| CAGR | 7.42% | 8.54% |
| Total Return | 318.9% | 414.6% |
| Sharpe Ratio | 0.383 | 0.331 |
| Sortino Ratio | 0.744 | -- |
| Max Drawdown | -28.06% | -40.71% |
| Volatility | 14.16% | -- |
| Win Rate vs DAX | 60.0% | -- |
| Beta | 0.464 | 1.00 |
| Alpha | +2.39% | -- |
| Up Capture | 66.2% | 100% |
| Down Capture | 33.3% | 100% |
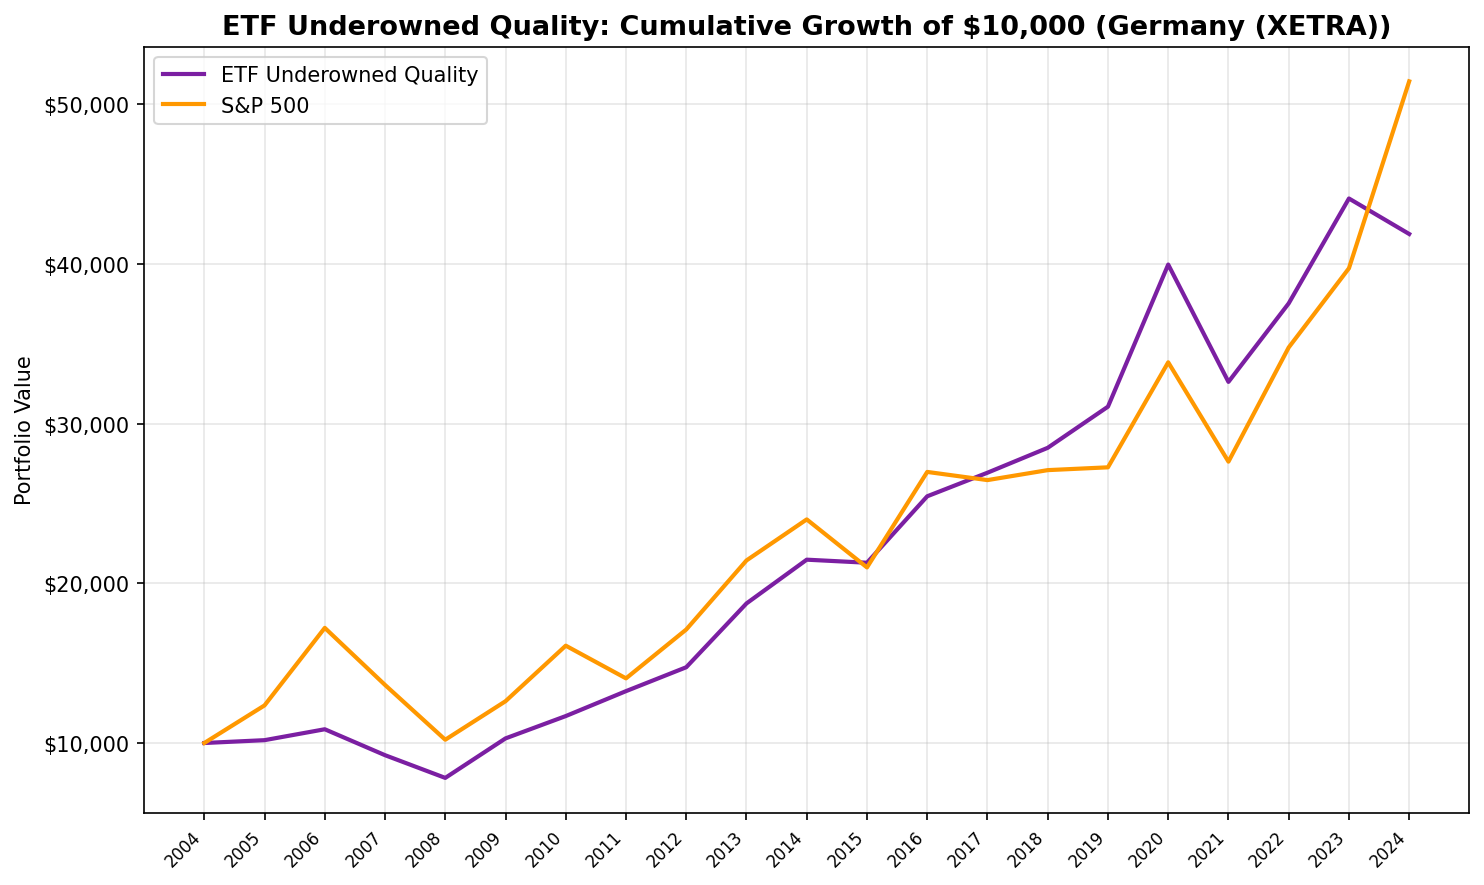
$10,000 invested in 2005 grew to $41,888 with the underowned quality portfolio. The same $10,000 in the DAX grew to $51,456.
The portfolio's Sharpe ratio (0.383) exceeds the DAX's (0.331). Its max drawdown of -28.06% compares to the DAX's -40.71%. Down capture of just 33.3% means when the DAX fell, the portfolio captured only a third of those losses. This is a genuine lower-risk profile, not just lower returns.
The portfolio held an average of 18.2 stocks per year with zero cash periods. Germany consistently produces enough qualifying stocks to build a full portfolio.
Year-by-Year Returns
| Year | Underowned Quality | DAX | Excess |
|---|---|---|---|
| 2005 | +1.8% | +23.6% | -21.8% |
| 2006 | +6.7% | +39.3% | -32.6% |
| 2007 | -15.0% | -20.8% | +5.8% |
| 2008 | -15.4% | -25.2% | +9.8% |
| 2009 | +31.7% | +23.6% | +8.0% |
| 2010 | +13.6% | +27.6% | -14.0% |
| 2011 | +13.4% | -12.7% | +26.1% |
| 2012 | +11.3% | +21.8% | -10.5% |
| 2013 | +27.1% | +25.3% | +1.8% |
| 2014 | +14.6% | +12.0% | +2.6% |
| 2015 | -0.9% | -12.5% | +11.6% |
| 2016 | +19.6% | +28.5% | -8.9% |
| 2017 | +5.8% | -1.9% | +7.7% |
| 2018 | +5.8% | +2.4% | +3.4% |
| 2019 | +9.1% | +0.7% | +8.4% |
| 2020 | +28.6% | +24.1% | +4.5% |
| 2021 | -18.4% | -18.4% | -0.0% |
| 2022 | +15.1% | +25.9% | -10.8% |
| 2023 | +17.5% | +14.3% | +3.2% |
| 2024 | -5.0% | +29.5% | -34.5% |
The portfolio won 12 of 20 years vs DAX. Its best years: 2011 (+26.1% excess), 2006-and-early-post-crisis period, and recent years from 2017-2020. The single worst year was 2024 (-34.5% excess), driven by the DAX's strong performance as European valuations re-rated.
When It Works
Stress periods. The portfolio's down capture of 33.3% means it avoids most DAX drawdowns. In 2008 (+9.8%), 2011 (+26.1%), and 2015 (+11.6%), German quality mid-caps held up while the DAX fell. These companies carry low debt and high margins, so they're less vulnerable to credit tightening or margin compression during downturns.
Post-crisis recoveries. In 2009 (+8.0% excess) and 2020 (+4.5%), the portfolio captured the upside of Germany's export cycle recovery while the Mittelstand quality screen had already filtered out the weaker names.
Idiosyncratic outperformance years. 2017 (+7.7%), 2018 (+3.4%), 2019 (+8.4%) each saw the portfolio benefit from company-specific catalysts. With low ETF ownership, these stocks move on fundamentals (earnings beats, contract wins) rather than sector flows.
When It Fails
DAX bull runs. 2005 (-21.8%), 2006 (-32.6%), and 2024 (-34.5%) all saw the DAX surge sharply. The portfolio's beta of 0.464 limits both upside and downside. In strong bull markets, lower beta means lower returns even if the portfolio performs reasonably in absolute terms.
High-valuation environments. 2016 (-8.9%) and 2022 (-10.8%) saw the DAX outperform on sentiment or post-selloff bounces that didn't favor the underowned quality mix.
ETF expansion. As European ETF adoption grows, more German mid-caps get included in passive products. The pool of "genuinely under-owned" shrinks over time. The 2022-2024 period may reflect this narrowing.
The Screen
Current screen for underowned quality stocks on XETRA:
WITH etf_counts AS (
  SELECT
    eh.asset AS symbol,
    COUNT(DISTINCT eh.symbol) AS etf_count
  FROM etf_holder eh
  JOIN profile p ON eh.asset = p.symbol
  WHERE p.exchange = 'XETRA'
  GROUP BY eh.asset
)
SELECT
  r.symbol,
  COALESCE(e.etf_count, 0) AS etf_count,
  ROUND(k.returnOnEquityTTM * 100, 1) AS roe_pct,
  ROUND(r.debtToEquityRatioTTM, 2) AS debt_to_equity,
  ROUND(r.currentRatioTTM, 2) AS current_ratio,
  ROUND(r.netProfitMarginTTM * 100, 1) AS net_margin_pct,
  ROUND(r.priceToEarningsRatioTTM, 1) AS pe_ratio,
  ROUND(k.marketCap / 1e9, 1) AS market_cap_bn_eur
FROM financial_ratios_ttm r
JOIN key_metrics_ttm k ON r.symbol = k.symbol
LEFT JOIN etf_counts e ON r.symbol = e.symbol
WHERE COALESCE(e.etf_count, 0) < 10
  AND k.returnOnEquityTTM > 0.12
  AND r.debtToEquityRatioTTM BETWEEN 0 AND 1.0
  AND r.currentRatioTTM > 1.5
  AND r.netProfitMarginTTM > 0.05
  AND r.priceToEarningsRatioTTM > 0
  AND r.priceToEarningsRatioTTM < 40
  AND k.marketCap > 500000000
ORDER BY k.returnOnEquityTTM DESC
LIMIT 30
Run this screen on Ceta Research
Limitations
Snapshot ETF data. Current holdings applied retrospectively. European ETF adoption was minimal before 2008. The early-period results (2005-2010) partly benefit from applying today's classifications to a period when ETF ownership was negligible across the board.
DAX benchmark. Using the DAX (price return, EUR) as benchmark properly accounts for the local currency context. However, the DAX 40 is concentrated in large-caps while the portfolio holds mid-caps. A MDAX benchmark might better isolate the underowned quality signal from the size effect.
Market cap threshold. EUR 500M (~$545M USD) captures the upper end of Germany's Mittelstand. Many genuinely under-owned quality companies fall below this threshold. A lower cutoff might capture more of the orphan universe but would increase liquidity risk.
UCITS blind spot. UCITS ETFs domiciled in Ireland or Luxembourg may hold German stocks but not appear in exchange-specific ETF data. The true ETF ownership for German stocks could be higher than what the etf_holder table captures.
Takeaway
Germany is the exception, not the rule. The underowned quality thesis works here because of a structural feature: a deep pool of profitable mid-cap industrials that ETFs genuinely haven't reached.
The portfolio trails the DAX by 1.11% annually in CAGR terms. But on risk-adjusted metrics, it wins: higher Sharpe (0.383 vs 0.331), dramatically lower max drawdown (-28% vs -41%), 2.39% alpha, and 60% win rate vs the benchmark. The down capture of 33.3% means it's almost three times more protective than the DAX in down years.
For investors who want German equity exposure with lower volatility and better downside protection than the DAX, the Mittelstand orphan space is worth examining. The underowned filter works here because it captures a real structural gap in ETF coverage. As European ETF adoption grows, this gap will narrow. The window may not stay open.
Part of a Series
This is the Germany edition of our ETF Underowned Quality backtest series. See also: - US: The ETF Orphan Thesis Doesn't Work - 18 Exchanges Compared: The ETF Orphan Thesis
References
- Piotroski, J. (2000). "Value Investing: The Use of Historical Financial Statement Information to Separate Winners from Losers." Journal of Accounting Research, 38(Supplement), 1-41.
- Stambaugh, R., Yu, J. & Yuan, Y. (2015). "Arbitrage Asymmetry and the Idiosyncratic Volatility Puzzle." Journal of Finance, 70(5), 1903-1948.
- Merton, R. (1987). "A Simple Model of Capital Market Equilibrium with Incomplete Information." Journal of Finance, 42(3), 483-510.
Data: Ceta Research (FMP financial data warehouse), July 2005 to July 2025. ETF holdings are current snapshot data. Benchmark: DAX (^GDAXI). Full methodology: backtests/METHODOLOGY.md. Code: backtests/etf-underowned. Past performance does not guarantee future results. This is educational content, not investment advice.


