
ETF Rebalancing Drag: Does Avoiding Passive-Owned Stocks Improve Returns?
We backtested a portfolio of the 30 least ETF-owned quality stocks on US markets over 20 years. Result: 6.56% CAGR vs 10.61% for SPY. Avoiding passive-owned stocks doesn't help. Here's why.

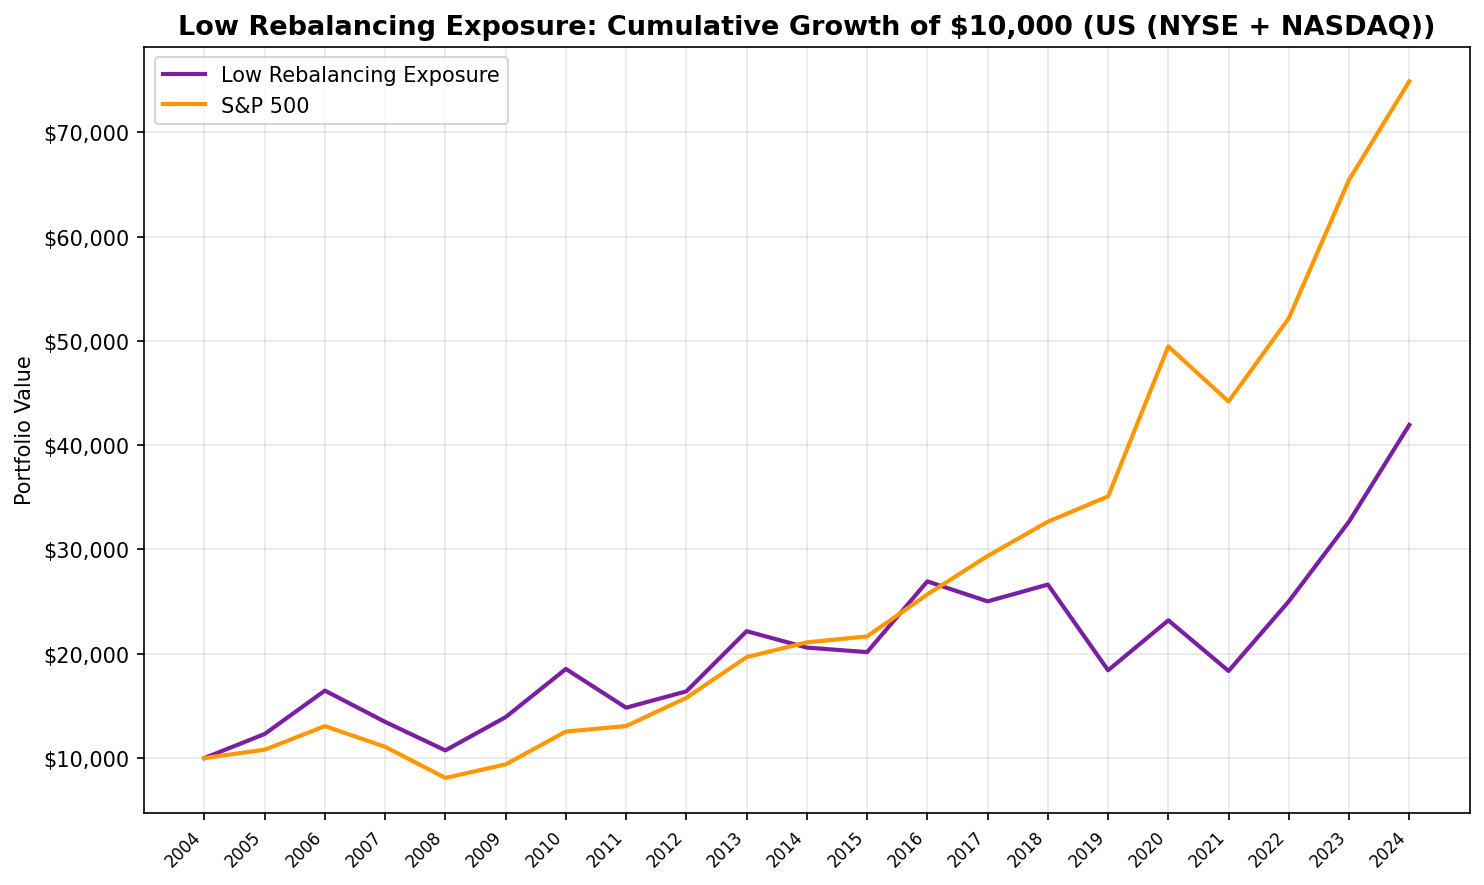
Passive investing has a hidden cost. When index funds rebalance, they buy and sell billions of dollars worth of stock on predictable dates, moving prices against themselves. Petajisto (2011) estimated this reconstitution drag at 20-28 basis points per year for S&P 500 index funds. Chen et al. (2004) found even larger effects: stocks added to the S&P 500 jumped +3.5% around announcement, while deletions fell -8.8%. The hypothesis is straightforward. If heavy ETF ownership creates drag through forced trading, stocks with the lowest ETF ownership should avoid that drag entirely. We tested it over 20 years on US equities. The result: 7.43% CAGR vs 10.59% for SPY. Avoiding passive-owned stocks didn't help. It hurt.
Contents
- The Strategy
- Method
- Results
- Year-by-Year Returns
- When It Works and When It Struggles
- Why Low ETF Ownership Doesn't Help
- Run This Screen Yourself
- Limitations
- Takeaway
Data: FMP financial data warehouse, 2000–2025. Updated April 2026.
The Strategy
The signal is the ETF ownership ratio: total ETF market value held in a stock divided by that stock's market cap. A stock with $50M in ETF holdings and a $5B market cap has a 1% ETF ownership ratio. A stock with $2B in ETF holdings and a $10B market cap has a 20% ratio.
We buy the 30 stocks with the lowest ETF ownership ratio each year. The logic: these companies sit outside the passive money flow. They won't get sold when an index fund rebalances. They won't get bought just because they crossed a market cap threshold. Their price movements should reflect fundamentals, not mechanical fund flows.
To avoid picking up garbage, we apply quality filters: ROE above 10%, P/E between 0 and 40, market cap over $1B, and the stock must be held by at least one ETF (so we can actually compute a ratio). This gives us profitable, reasonably valued, liquid companies that happen to have minimal passive ownership.
Rebalancing is annual in July, equal weight across all positions.
Method
| Parameter | Value |
|---|---|
| Universe | NYSE, NASDAQ |
| Signal | ETF ownership ratio (lowest 30) |
| Quality filters | ROE > 10%, P/E 0-40, market cap > $1B |
| Minimum ETF coverage | Held by at least 1 ETF |
| Rebalancing | Annual (July), equal weight |
| Max positions | 30 stocks |
| Transaction costs | Size-tiered: 0.1-0.5% one-way |
| Benchmark | S&P 500 (SPY) |
| Period | 2005-2025 (20 years) |
| Data source | FMP via Ceta Research warehouse |
Important caveat on the signal: ETF ownership ratios use a current snapshot. We don't have historical ETF holdings data going back to 2005. This means the backtest selects stocks based on today's ETF ownership levels, not what they were at the time of each rebalance. This is look-ahead bias on the signal itself. The quality filters (ROE, P/E, market cap) use point-in-time fiscal year data with appropriate filing lags. We'll address this limitation more directly below, but it matters for interpreting every result in this post.
Results

20-year summary (2005-2025):
| Metric | Low ETF Ownership | S&P 500 (SPY) |
|---|---|---|
| CAGR | 7.43% | 10.59% |
| Total Return | 319% | 649% |
| Sharpe Ratio | 0.230 | 0.536 |
| Sortino Ratio | 0.431 | 1.069 |
| Max Drawdown | -34.83% | -38.01% |
| Beta | 1.104 | 1.00 |
| Alpha (annualized) | -4.05% | — |
| Up Capture | 90% | 100% |
| Down Capture | 113% | 100% |
| Win Rate | 45% (9/20 years) | — |
| Avg Stocks Held | 23.8 | — |
| Cash Periods | 0 of 20 | — |
This is a clear underperformance across every risk-adjusted metric. The CAGR gap is -3.16% annually. Over 20 years that compounds to a massive difference: $1 grows to $4.19 in the strategy vs $7.49 in SPY.
The Sharpe ratio tells you the return per unit of risk is roughly half of SPY's. The Sortino ratio shows the downside volatility is disproportionately high relative to return. The beta of 1.104 says you're taking slightly more market risk than SPY, but the alpha is negative at -4.05%. You're paying for extra risk and getting less return.
The capture ratios crystallize the problem. Up capture of 90% means you only participate in 90 cents of every dollar the market gains. Down capture of 113% means you eat 13% more than the market's losses. That's an unfavorable combination: you lag in rallies and lead in sell-offs.
Year-by-Year Returns
| Year | Portfolio | SPY | Excess |
|---|---|---|---|
| 2005 | +23.1% | +8.0% | +15.1% |
| 2006 | +33.8% | +20.9% | +12.8% |
| 2007 | -18.2% | -15.2% | -3.0% |
| 2008 | -20.3% | -26.9% | +6.6% |
| 2009 | +29.7% | +16.0% | +13.8% |
| 2010 | +33.2% | +33.5% | -0.4% |
| 2011 | -20.0% | +4.2% | -24.2% |
| 2012 | +10.6% | +20.7% | -10.2% |
| 2013 | +35.2% | +24.7% | +10.4% |
| 2014 | -7.1% | +7.2% | -14.3% |
| 2015 | -2.1% | +2.7% | -4.8% |
| 2016 | +33.6% | +18.6% | +15.1% |
| 2017 | -7.1% | +14.3% | -21.5% |
| 2018 | +6.4% | +11.2% | -4.8% |
| 2019 | -30.9% | +7.4% | -38.3% |
| 2020 | +26.0% | +41.0% | -15.0% |
| 2021 | -20.9% | -10.7% | -10.2% |
| 2022 | +36.4% | +18.1% | +18.3% |
| 2023 | +30.6% | +25.4% | +5.1% |
| 2024 | +28.4% | +14.4% | +14.0% |
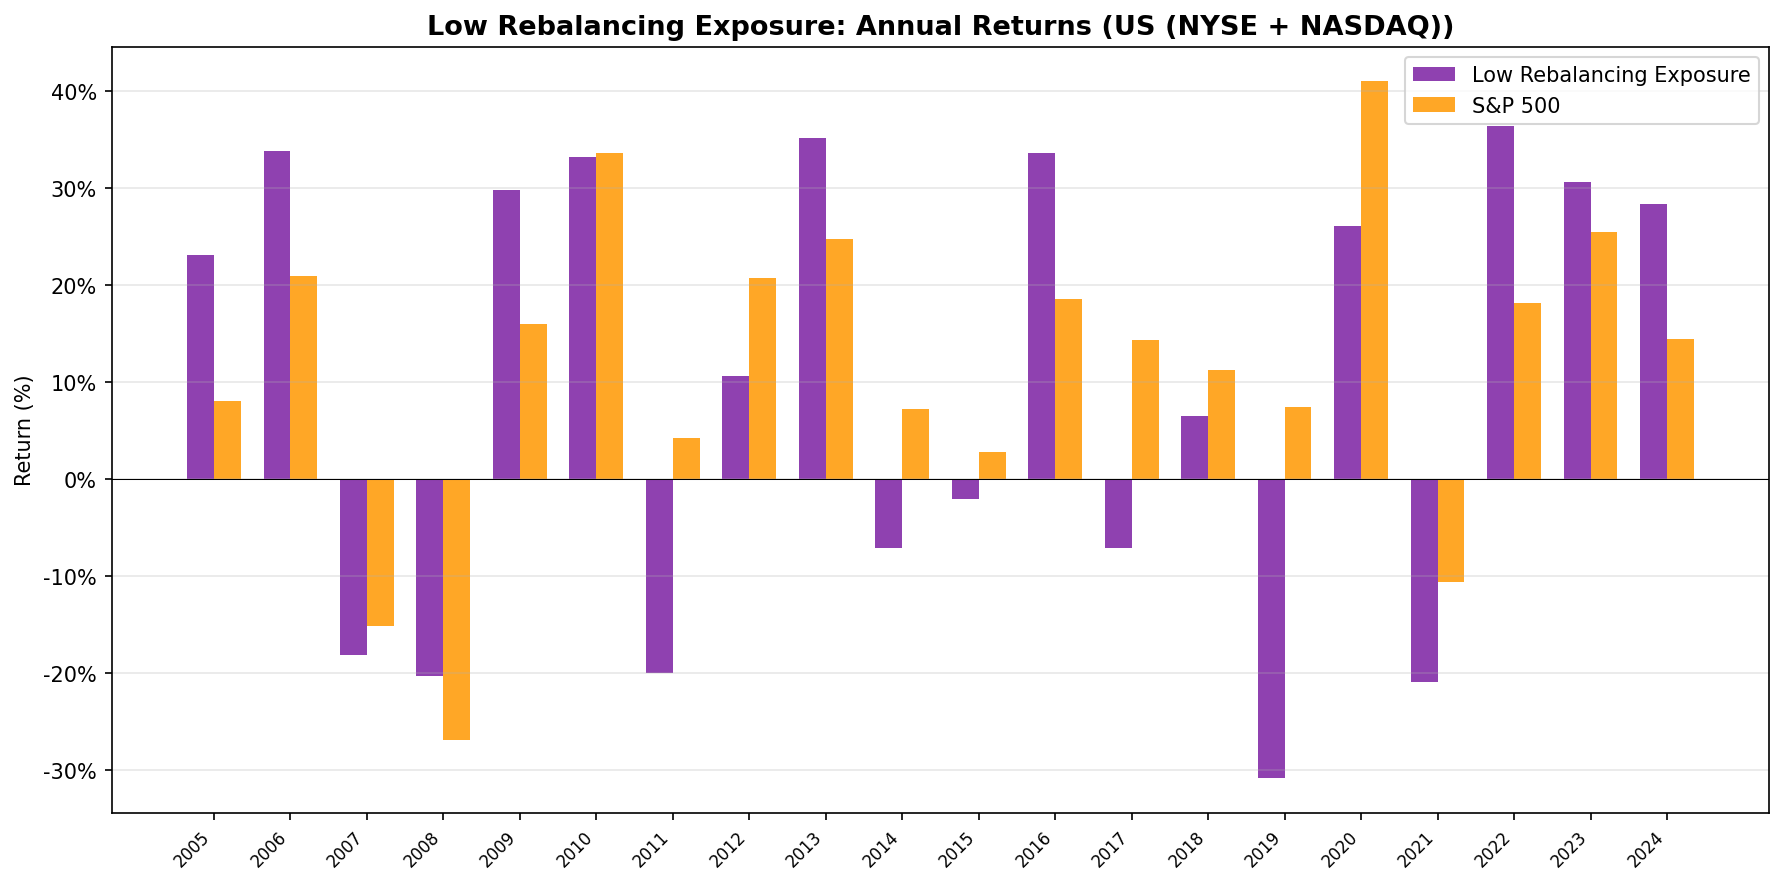
The annual returns split into two distinct regimes.
When It Works and When It Struggles
2005-2010: The good years. The strategy beat SPY in 4 of 6 years. Cumulative excess return over this stretch was roughly +43 percentage points. This was the era before passive investing dominated US markets. ETF AUM was a fraction of what it is today. Low ETF ownership didn't carry the same negative signal it carries now, because most stocks had low ETF ownership. The quality filters were doing the heavy lifting, and the small-cap tilt from low passive ownership gave a natural size premium during a period when small caps outperformed.
2011 onward: The collapse. The strategy underperformed in 7 of the next 10 years. 2011 was the first major blow (-20.0% vs +4.2%), and 2019 was catastrophic (-30.9% vs +7.4%). The cumulative damage from 2011 to 2021 erased all the earlier outperformance and then some.
What changed? Passive investing went mainstream. ETF assets under management in the US went from about $1 trillion in 2010 to over $7 trillion by 2023. As more money flowed into index funds and ETFs, stocks with high passive ownership received a steady bid. Stocks with low passive ownership missed out on those flows entirely. The strategy was selecting for stocks that the largest pool of new capital in financial history was systematically ignoring.
2019 stands out. The portfolio lost -30.9% while SPY gained +7.4%. That's a 38.3 percentage point gap in a single year. When we look at what the strategy was likely holding (low ETF ownership, quality-filtered), these are companies that institutions and passive funds had largely passed over. In 2019, the market was driven by mega-cap tech names that dominate every major index. If you weren't holding those names, you weren't participating.
2022-2024: A late revival. The strategy outperformed in three consecutive years, with particularly strong excess returns in 2022 (+18.3%) and 2024 (+14.0%). The 2022 outperformance is interesting. That was a year where passive-heavy names (tech, growth) got crushed by rising rates. Stocks with low ETF ownership were less exposed to the crowded trade unwind. This hints at a potential hedging use case. But three good years don't erase a decade of underperformance.
Why Low ETF Ownership Doesn't Help
The academic hypothesis was sound: passive fund rebalancing creates mechanical price distortion, and stocks outside that machinery should benefit from cleaner price discovery. But the hypothesis missed a larger structural force.
The passive premium is real. When trillions of dollars flow into index funds annually, the stocks inside those indices receive persistent buying pressure. This isn't a temporary mispricing. It's a structural bid that doesn't go away. Stocks with high ETF ownership don't just benefit from the initial inclusion. They benefit from ongoing inflows every paycheck cycle, every 401(k) contribution, every target-date fund rebalance.
Stocks with low ETF ownership get none of this. They need to attract active buyers on their own merits, and there are fewer active buyers every year as passive market share grows.
Selection bias in the signal. Why does a profitable, reasonably valued, billion-dollar company have low ETF ownership? Often because something is wrong that the filters don't catch. The company might be in a declining industry. It might have governance issues that keep it out of ESG-screened indices. It might have low trading volume that disqualifies it from index inclusion. Low ETF ownership isn't random. It's a signal that the indexing industry, collectively, has decided this stock doesn't belong in its products.
The "anti-momentum" problem. High ETF ownership tends to correlate with recent strong performance, because stocks get added to indices after they grow. Low ETF ownership correlates with stocks that haven't grown enough to matter for indices. By selecting for low ETF ownership, you're inadvertently selecting against price momentum. Every factor study since Jegadeesh and Titman (1993) says that's a losing bet over intermediate horizons.
Run This Screen Yourself
The current low ETF ownership screen can be replicated with this query on the Ceta Research data explorer.
-- Low ETF Ownership Screen (US)
-- Run at: cetaresearch.com/data-explorer

WITH etf_ownership AS (
  SELECT
    h.asset AS symbol,
    SUM(h.marketValue) AS total_etf_value
  FROM etf_holder h
  GROUP BY h.asset
),
candidates AS (
  SELECT
    p.symbol,
    p.companyName,
    p.sector,
    p.marketCap,
    COALESCE(e.total_etf_value, 0) AS etf_value,
    COALESCE(e.total_etf_value, 0) / p.marketCap AS etf_ownership_ratio,
    fr.returnOnEquityTTM AS roe,
    fr.priceToEarningsRatioTTM AS pe
  FROM profile p
  LEFT JOIN etf_ownership e ON p.symbol = e.symbol
  JOIN financial_ratios_ttm fr ON p.symbol = fr.symbol
  WHERE p.exchange IN ('NYSE', 'NASDAQ')
    AND p.marketCap > 1000000000
    AND p.isActivelyTrading = true
    AND fr.returnOnEquityTTM > 0.10
    AND fr.priceToEarningsRatioTTM > 0
    AND fr.priceToEarningsRatioTTM < 40
    AND COALESCE(e.total_etf_value, 0) > 0
)
SELECT
  symbol,
  companyName,
  sector,
  ROUND(marketCap / 1e9, 2) AS mktcap_B,
  ROUND(etf_ownership_ratio * 100, 2) AS etf_own_pct,
  ROUND(roe * 100, 1) AS roe_pct,
  ROUND(pe, 1) AS pe_ratio
FROM candidates
ORDER BY etf_ownership_ratio ASC
LIMIT 30;
Full backtest code: github.com/ceta-research/backtests
Limitations
Look-ahead bias on the signal. This is the most important limitation. ETF ownership ratios come from a current snapshot. We don't have historical ETF holdings going back to 2005. The backtest assumes today's low-ETF-ownership stocks were also low-ETF-ownership stocks in the past. That's a strong assumption and likely wrong for many names. A stock that's in few ETFs today might have been in many ETFs a decade ago, or vice versa. The quality filters use point-in-time data, but the core signal does not. This means the backtest results are more of a structural analysis ("what happens when you hold stocks passive money ignores?") than a tradeable strategy test.
Snapshot vs. time-series. Related to the above: ETF holdings change quarterly. Even if we had historical data, we'd need quarterly snapshots aligned to each rebalance date. A single point-in-time number smooths over what is actually a dynamic relationship.
Survivorship and coverage. FMP's ETF holdings data may not cover all ETFs equally. Smaller, niche ETFs might be underrepresented, which would systematically understate the ETF ownership ratio for stocks held primarily in those vehicles.
Average holdings below target. The strategy averaged 23.8 stocks instead of the target 30. In some years, the quality filters combined with the ETF coverage requirement reduced the eligible universe below 30. Fewer positions means higher concentration risk and more volatile outcomes.
Not investment advice. This is a quantitative research exercise, not a recommendation. Past performance from a backtest with known data issues doesn't predict future returns. The look-ahead bias alone makes this untradeable as presented.
Takeaway
The ETF rebalancing drag hypothesis has academic support. Petajisto and Chen et al. documented real costs from index reconstitution. But avoiding those costs by holding stocks with low ETF ownership introduces a much larger problem: you're excluding yourself from the structural bid that passive money provides. Over 20 years, that cost 3.16% annually in foregone returns.
The strategy worked in the early years (2005-2010) when passive investing was still a minor force. As ETFs became the dominant vehicle for equity allocation, low ETF ownership became a negative signal. The 2022-2024 revival suggests the strategy might have hedging value in years when passive-heavy names sell off. But as a standalone approach, the data is clear: you can't beat the market by avoiding the stocks the market is buying.
Data: Ceta Research (FMP financial data warehouse), 2005-2025.


