
ETF Rebalancing Drag in India: Low Passive Ownership Doesn't Help
We tested whether Indian stocks with low ETF ownership outperform over 20 years. Result: 5.73% CAGR vs SPY's 10.61%. The passive premium crosses borders.


We tested the same "Low Rebalancing Exposure" strategy on Indian stocks that we ran on the US market. The thesis: stocks with minimal ETF ownership should be insulated from the mechanical buying and selling that passive funds impose during rebalancing. If the rebalancing drag theory holds, these stocks should outperform.
Contents
- Method
- The Thesis
- Results
- Annual Returns
- What the Annual Data Reveals
- Why Low Ownership Fails in India
- The Context: Why Sensex vs. SPY Matters
- Conclusion
They don't. Over 20 years on NSE, the strategy returned 6.51% CAGR against the Sensex's 12.97%. That's -6.46% annual excess. A Sharpe ratio of 0.000 confirms this: the portfolio earned the risk-free rate and nothing more. You took on equity-level risk and got fixed-deposit returns.
Data: FMP financial data warehouse, 2000–2025. Updated April 2026.
Method
| Parameter | Value |
|---|---|
| Universe | NSE (National Stock Exchange) |
| Rebalancing | Annual (July) |
| Holding period | 12 months |
| Max positions | 30 stocks, equal weight |
| Quality filter | ROE > 10%, P/E between 0 and 40 |
| Selection | Bottom 30 by ETF ownership ratio |
| Market cap threshold | INR 20B (~$240M USD) |
| Transaction costs | Size-tiered (0.1-0.5% one-way) |
| Cash rule | Fewer than 10 qualifying stocks = 100% cash |
| Data source | FMP via Ceta Research warehouse |
| Benchmark | Sensex (^BSESN) |
| Period | 2005-2025 |
Important caveat: ETF ownership data (etf_holder) is a current snapshot, not historical. Ownership ratios are applied retrospectively across all backtest periods. The quality filters (ROE, P/E, market cap) use point-in-time FY data with a 45-day lag to avoid look-ahead bias. The ETF ownership signal has look-ahead bias. Results should be read as "how would currently low-ETF-ownership quality stocks have performed?" rather than a fully point-in-time strategy.
The Thesis
When index funds rebalance, they create predictable demand shocks. Stocks entering the Nifty 50, MSCI India, or FTSE India see buying pressure as billions of passive dollars follow the index. Stocks leaving see forced selling. The hypothesis is that companies with low ETF ownership ratios avoid this artificial price distortion and should produce cleaner returns driven by fundamentals alone.
We tested this by selecting NSE-listed stocks that pass basic quality screens (profitable, reasonably valued) and then picking the 30 with the lowest ETF ownership ratios. If passive rebalancing drags on returns for heavily-owned stocks, the least-owned should benefit.
Results
| Metric | Portfolio | Sensex | Difference |
|---|---|---|---|
| CAGR | 6.51% | 12.97% | -6.46% |
| Sharpe Ratio | 0.000 | 0.388 | -0.388 |
| Max Drawdown | -51.91% | — | — |
| Total Return | 253% | — | — |
| Win Rate | 40% | — | — |
| Beta | 1.197 | 1.0 | — |
| Alpha | -7.73% | — | — |
| Avg Stocks Held | 23.1 | — | — |
| Cash Periods | 0 of 20 | — | — |
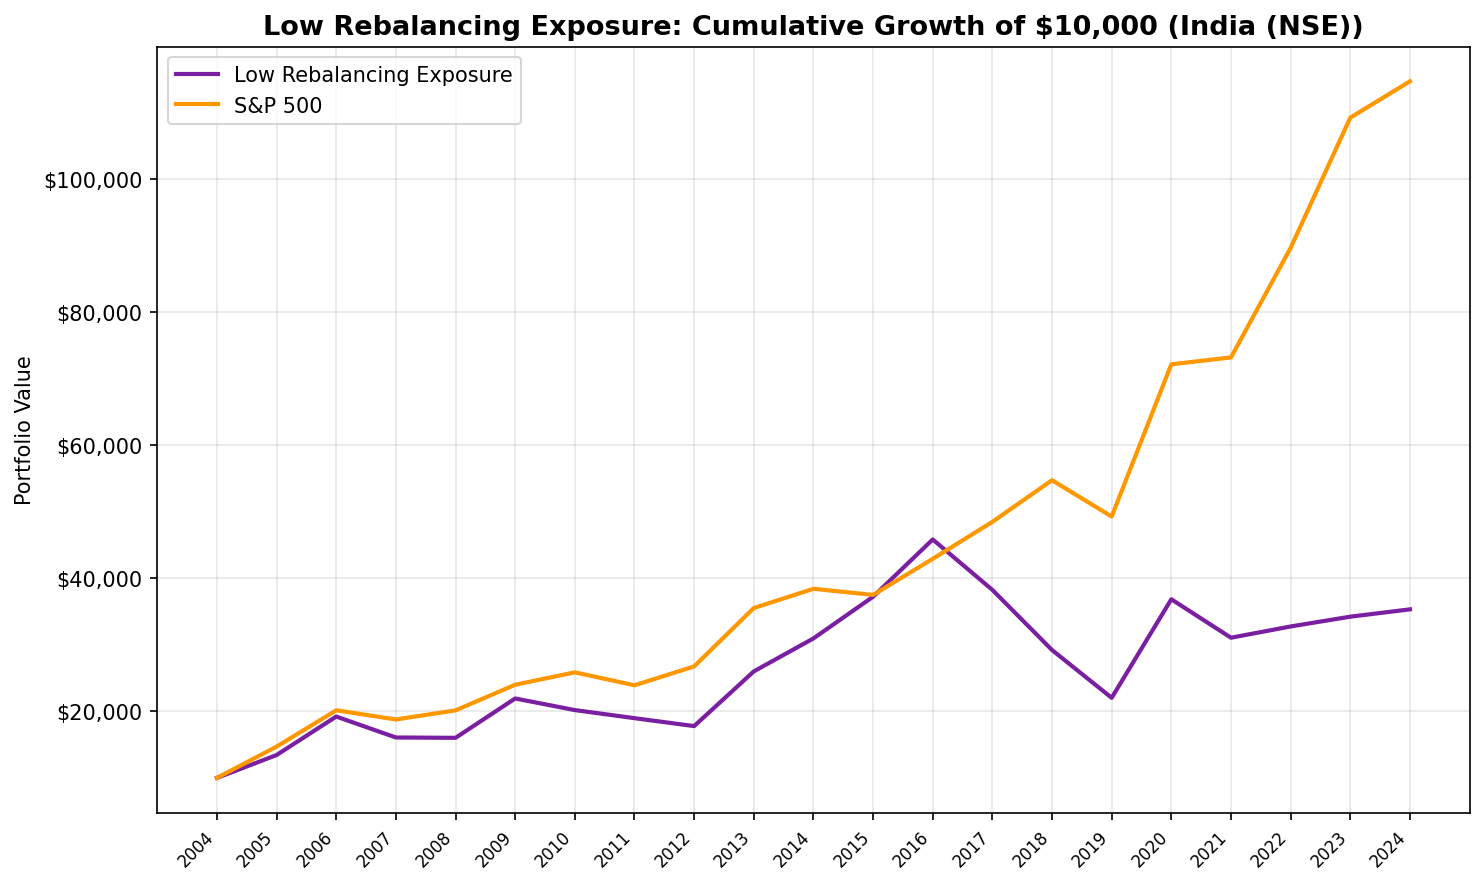
The Sharpe ratio of exactly 0.000 is the most damning number. At India's 6.5% risk-free rate, this portfolio returned the same as a bank deposit over 20 years, while taking on -51.91% maximum drawdown. The Sensex compounded at nearly double the rate (12.97%), and the divergence accelerates from 2017 onward.
Annual Returns
| Year | Portfolio | Sensex | Excess |
|---|---|---|---|
| 2005 | +34.4% | +47.0% | -12.6% |
| 2006 | +43.0% | +37.1% | +5.9% |
| 2007 | -16.4% | -6.8% | -9.5% |
| 2008 | -0.3% | +7.3% | -7.6% |
| 2009 | +36.9% | +19.1% | +17.8% |
| 2010 | -7.9% | +7.8% | -15.7% |
| 2011 | -6.0% | -7.5% | +1.5% |
| 2012 | -6.3% | +11.9% | -18.1% |
| 2013 | +46.2% | +32.8% | +13.4% |
| 2014 | +19.1% | +8.1% | +10.9% |
| 2015 | +20.2% | -2.4% | +22.6% |
| 2016 | +23.1% | +14.5% | +8.7% |
| 2017 | -16.5% | +13.0% | -29.5% |
| 2018 | -23.6% | +12.9% | -36.5% |
| 2019 | -24.6% | -10.0% | -14.6% |
| 2020 | +67.2% | +46.4% | +20.7% |
| 2021 | -15.7% | +1.4% | -17.1% |
| 2022 | +5.4% | +22.5% | -17.1% |
| 2023 | +4.5% | +21.8% | -17.3% |
| 2024 | +3.2% | +5.0% | -1.8% |
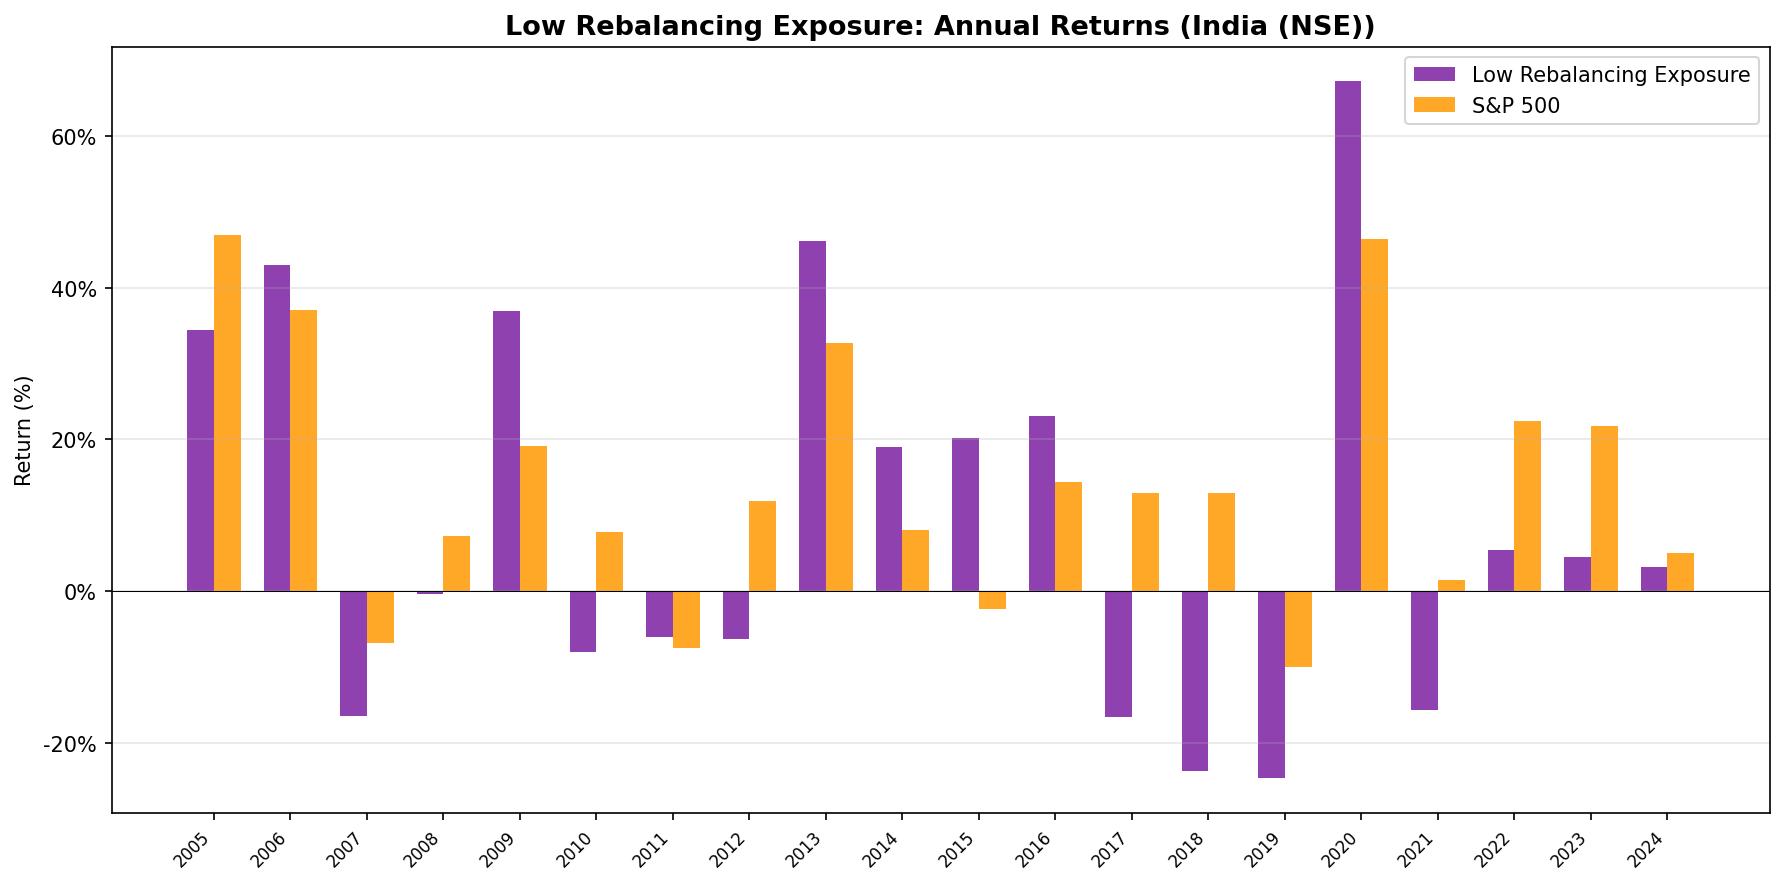
What the Annual Data Reveals
The year-by-year pattern shows two distinct eras.
2005 to 2016: Mixed results. The strategy won in 2006, 2009, 2013-2016, but lost badly in 2005, 2007-2008, 2010, 2012. Even in this earlier period, the Sensex was a demanding benchmark that India's low-ETF stocks couldn't consistently beat.
2017 to 2024: Consistent destruction. The reversal from 2017 onward is severe. The portfolio dropped -16.5% in 2017 while the Sensex gained +13.0%, a 29.5-percentage-point gap. 2018 and 2019 continued the carnage (-36.5% and -14.6% excess respectively). Even the 2020 bounce (+67.2%) came at the cost of a -51.91% max drawdown. 2022 and 2023 were the worst yet: the strategy returned +5.4% and +4.5% while the Sensex gained +22.5% and +21.8%.
The 40% win rate (8 of 20 years) understates the problem. The wins tend to cluster in years of broad market chaos (2009, 2020). The losses dominate the quieter bull market years where index constituents compound steadily.
Why Low Ownership Fails in India
Three structural factors explain the result.
The Sensex and Nifty are demanding benchmarks. India's large-cap indices have compounded at 12-13% annually over 20 years, driven by a handful of high-quality businesses: HDFC, Reliance, TCS, Infosys, Bajaj Finance. These companies attract heavy passive allocation. Low-ownership NSE stocks, by definition, are the businesses institutional capital has chosen not to own heavily. Over 20 years, that selection has been consistently correct.
The quality filter selects the wrong companies. ROE > 10% and P/E 0-40 are loose screens. In NSE's universe, these criteria pass hundreds of companies, and the bottom 30 by ETF ownership tend to be smaller, less liquid, and in sectors that institutional investors avoid for good reason. Many are family-controlled businesses with limited float, or companies in sectors (textiles, chemicals, small-cap financials) where governance concerns keep institutions away. Low ownership isn't random. It's informative.
Annual rebalancing compounds the damage. With only one rebalance per year in July, the portfolio locks into positions for 12 months. In a market that moves as fast as India's, a bad selection persists for a full year before correction. The 2018 and 2019 results show what happens when the annual pick goes wrong for two consecutive years.
The Context: Why Sensex vs. SPY Matters
When measured against SPY (a common cross-market comparison), the excess was -4.88%. Against the Sensex (the appropriate local benchmark for Indian investors), it's -6.46%. The difference reflects the Sensex's strength: it compounded at 12.97% annually, outperforming SPY by roughly 2-3% over this period.
For Indian investors, the Sensex comparison is what matters. It shows what a straightforward passive allocation in India would have returned. The strategy's Sharpe of 0.000 vs the Sensex's 0.388 tells the story: you took equity risk and earned the risk-free rate while the index compounded at nearly 13% annually.
Conclusion
The Low Rebalancing Exposure strategy fails on NSE. 6.51% CAGR over 20 years, a Sharpe of zero, and -7.73% annual alpha make the case clear. Avoiding ETF-owned stocks doesn't insulate a portfolio from rebalancing drag. It removes the portfolio from the flow of capital that drives modern market returns.
The result is more severe than the US result because the Indian benchmark is stronger. The Sensex has been one of the best-performing large-cap indices in the world over this period. A strategy that systematically excludes the companies that dominate that index pays a high price.
Data: Ceta Research (FMP financial data warehouse), 2005-2025.
Part of a Series: See our US backtest for full methodology.
Past performance does not guarantee future results. This is educational content, not investment advice.


