
ETF Anti-Crowding: Does Buying Under-Owned Stocks Beat the Market?
We backtested a portfolio of the 30 least ETF-owned quality stocks on US markets over 20 years. Result: 4.56% CAGR vs 10.61% for SPY. Under-owned stocks don't outperform. Here's why.

Nvidia sits in over 3,500 ETFs. Apple and Microsoft are close behind. Academic research shows this level of ETF ownership amplifies volatility by 16% per standard deviation and reduces price informativeness. The logical next question: do stocks that passive money hasn't found outperform?
Contents
- Method
- What Research Predicted
- Results
- Year-by-Year Returns
- Why Under-Owned Stocks Underperform
- When It (Briefly) Works
- When It Fails
- Global Results
- The Screen
- Limitations
- Takeaway
- References
We tested it. Across 20 years of US data, a portfolio of the 30 least ETF-owned quality stocks returned 5.48% annually. The S&P 500 returned 10.59%. Under-owned stocks don't just underperform. They underperform badly.
Data: FMP financial data warehouse, 2000–2025. Updated March 2026.
Method
Data source: Ceta Research (FMP financial data warehouse) Universe: NYSE + NASDAQ (AMEX excluded, only 2.8% of ETF-held stocks have FY financials) Period: July 2005 to July 2025 (20 annual periods) Rebalancing: Annual (July, 45-day lag for FY filings) Benchmark: SPY (S&P 500 ETF) Execution: Next-day close (market-on-close) Transaction costs: Size-tiered (0.1% for >$10B market cap, 0.3% for $2-10B, 0.5% for <$2B, one-way)
Signal: Among stocks held by at least 5 ETFs, apply quality filters (ROE > 10%, P/E between 0 and 40, market cap > $1B), then select the 30 with the lowest ETF holder count. Equal weight. Hold cash if fewer than 10 qualify.
Data caveat: The etf_holder table contains current ETF holdings only. No historical snapshots exist. Crowding classifications are applied retrospectively across all periods, introducing look-ahead bias in the crowding signal. Quality filters use point-in-time FY data and are free of this bias. Results answer: "How would a portfolio of currently under-owned quality stocks have performed?"
What Research Predicted
Ben-David, Franzoni, and Moussawi (2018) found that high ETF ownership amplifies stock volatility. Israeli, Lee, and Sridharan (2017) showed it reduces price informativeness. Da and Shive (2018) documented that ETF ownership increases pairwise return correlations.
The implication: less-crowded stocks should have cleaner price signals, less flow-driven noise, and potentially better risk-adjusted returns. Fundamental analysis should work better when prices aren't dominated by ETF mechanics.
That's the theory. The data disagrees.
Results
| Metric | Anti-Crowding | S&P 500 |
|---|---|---|
| CAGR | 5.48% | 10.59% |
| Total Return | 190.9% | 648.8% |
| Sharpe Ratio | 0.181 | 0.536 |
| Sortino Ratio | 0.343 | 1.069 |
| Max Drawdown | -35.52% | -38.01% |
| Volatility | 19.29% | 16.04% |
| Win Rate vs SPY | 35.0% | -- |
| Beta | 1.036 | 1.00 |
| Jensen's Alpha | -5.42% | -- |
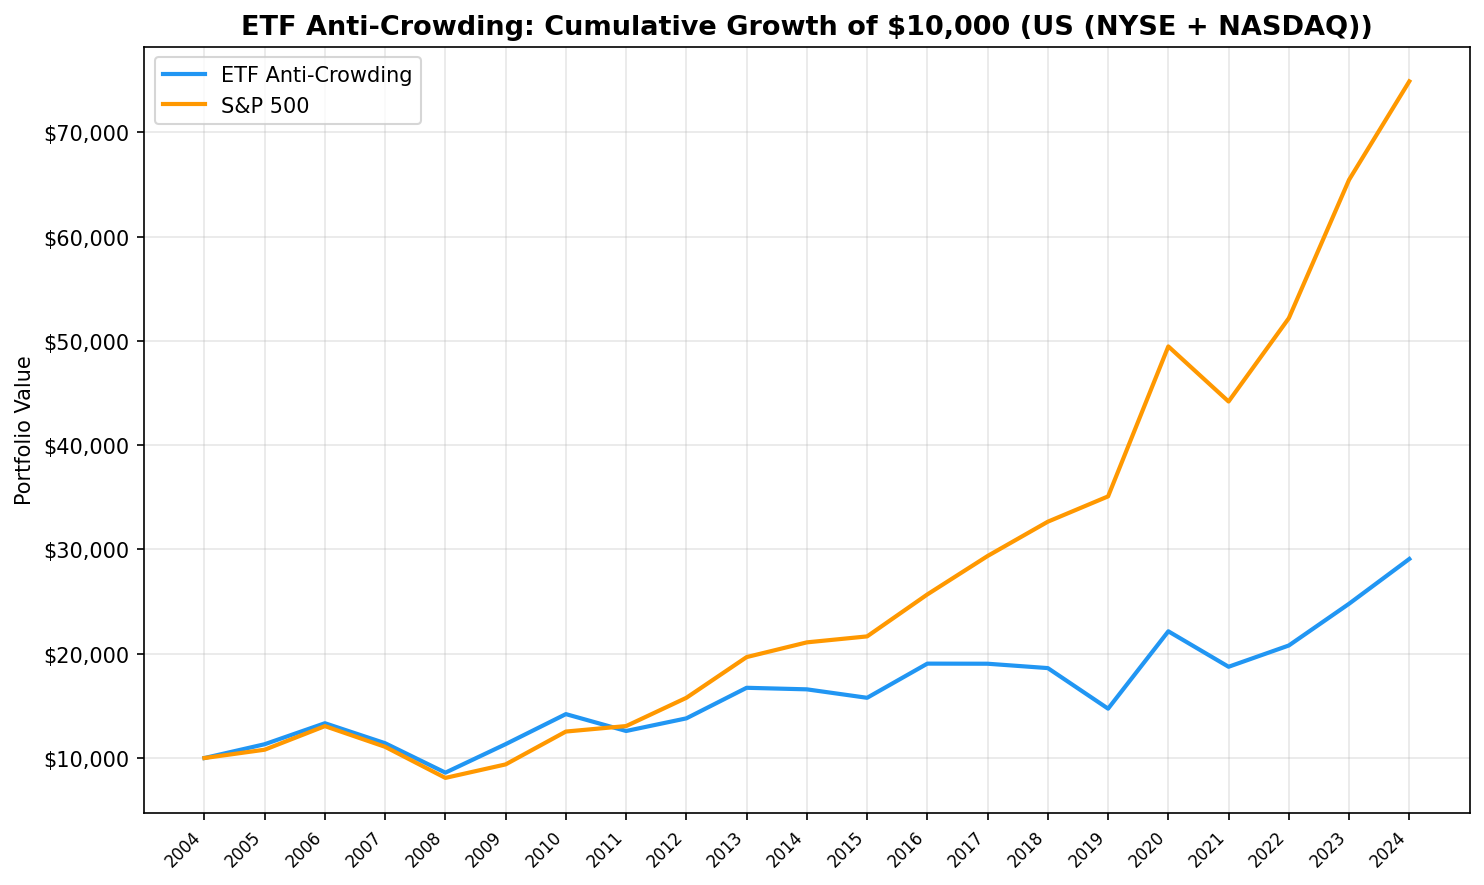
$10,000 invested in 2005 grew to $29,090 with the anti-crowding strategy. The same $10,000 in SPY grew to $74,880.
The portfolio held an average of 20.4 stocks per year, with an average ETF holder count of 6.8. These are genuinely under-owned names, not just marginally less popular mega-caps.
Year-by-Year Returns
| Year | Anti-Crowding | SPY | Excess |
|---|---|---|---|
| 2005 | +13.3% | +8.0% | +5.3% |
| 2006 | +17.8% | +20.9% | -3.2% |
| 2007 | -14.4% | -15.2% | +0.8% |
| 2008 | -24.7% | -26.9% | +2.2% |
| 2009 | +31.8% | +16.0% | +15.8% |
| 2010 | +25.4% | +33.5% | -8.1% |
| 2011 | -11.4% | +4.2% | -15.6% |
| 2012 | +9.6% | +20.7% | -11.1% |
| 2013 | +21.2% | +24.7% | -3.5% |
| 2014 | -0.9% | +7.2% | -8.1% |
| 2015 | -4.9% | +2.7% | -7.6% |
| 2016 | +20.8% | +18.6% | +2.2% |
| 2017 | -0.0% | +14.3% | -14.4% |
| 2018 | -2.2% | +11.2% | -13.4% |
| 2019 | -20.9% | +7.4% | -28.3% |
| 2020 | +50.3% | +41.0% | +9.3% |
| 2021 | -15.3% | -10.7% | -4.7% |
| 2022 | +10.9% | +18.1% | -7.2% |
| 2023 | +19.2% | +25.4% | -6.2% |
| 2024 | +17.3% | +14.4% | +2.9% |
The strategy won 7 of 20 years. Its best years were crisis-adjacent: 2005, 2007-2009, 2020. Its worst was 2019 (-20.9% vs +7.4%), a -28 percentage point gap.
Why Under-Owned Stocks Underperform
Three mechanisms explain the consistent underperformance.
1. Passive flows create a persistent bid. ETF inflows are steady and mechanical. Stocks held by thousands of ETFs receive continuous buying pressure, independent of fundamentals. Under-owned stocks miss this tailwind entirely. Over 20 years, that persistent bid compounds into a meaningful return advantage for crowded names.
2. Under-ownership is a signal, not just noise. Stocks end up in few ETFs for reasons. Many are smaller, in niche industries, or have characteristics that exclude them from popular index methodologies. The quality filters catch some of this, but they can't fully offset the selection effect. Low ETF ownership partly reflects lower institutional interest, which correlates with weaker price discovery and less analyst coverage.
3. The volatility story is real but doesn't help returns. The academic findings about crowding-driven volatility are correct. Crowded stocks are noisier. But that noise is symmetric. The extra volatility doesn't create a return drag for crowded stocks or a return boost for uncrowded stocks. It just means the prices of heavily ETF-owned stocks bounce around more. For a buy-and-hold investor, that noise washes out.
When It (Briefly) Works
The anti-crowding portfolio outperformed during market stress. In 2007-2008, when ETF outflows hit crowded names hard, the portfolio lost less (-14.4% and -24.7%) than SPY (-15.2% and -26.9%). In 2020's recovery, the portfolio gained +50.3% vs +41.0%.
This makes sense with the crowding thesis. During selloffs, crowded stocks face correlated selling from hundreds of ETFs simultaneously. Under-owned stocks avoid this mechanical selling pressure. But these episodes are too brief and infrequent to offset the persistent underperformance during normal markets.
When It Fails
The strategy fails during steady bull markets, which is most of the time. From 2010 to 2019, the portfolio underperformed in 8 of 10 years. The worst stretch was 2017-2019: three consecutive years of double-digit negative excess returns. 2019 alone saw the portfolio drop -20.9% while SPY gained +7.4%.
The pattern: when markets reward large, liquid, well-known companies (which ETFs overweight by design), the anti-crowding portfolio is systematically on the wrong side.
Global Results
We ran the same strategy across 18 exchanges, benchmarking each against its local index (Sensex for India, DAX for Germany, Nikkei for Japan, etc.) rather than SPY. This corrects the currency mismatch that inflated excess returns in the old comparison. Against local benchmarks, 8 of 18 exchanges showed positive excess CAGR.
| Exchange | CAGR | Excess vs Local | Sharpe | Benchmark | AvgETF |
|---|---|---|---|---|---|
| Norway | 14.94% | +3.74% | 0.989 | Oslo All Share | 426.1 |
| China | 8.83% | +2.68% | 0.163 | SSE Composite | 9.2 |
| Thailand | 5.08% | +2.49% | 0.148 | SET Index | 17.4 |
| Switzerland | 4.75% | +1.47% | 0.223 | SMI | 85.6 |
| Brazil | 10.46% | +1.43% | -0.002 | Bovespa | 70.1 |
| Sweden | 6.91% | +1.21% | 0.231 | OMX Stockholm 30 | 139.6 |
| Singapore | 4.10% | +1.10% | 0.079 | STI | 172.3 |
| Australia | 4.58% | +1.03% | 0.072 | ASX 200 | 115.5 |
| Canada | 4.35% | -0.75% | 0.094 | TSX Composite | 32.9 |
| UK | 1.90% | -0.77% | -0.082 | FTSE 100 | 8.7 |
| S. Africa | 9.50% | -1.10% | 0.026 | SPY* | 245.0 |
| Germany | 7.10% | -1.43% | 0.281 | DAX | 24.0 |
| Hong Kong | 0.65% | -2.07% | -0.111 | Hang Seng | 19.7 |
| Korea | 1.57% | -4.09% | -0.072 | KOSPI | 113.9 |
| US | 5.48% | -5.11% | 0.181 | SPY | 6.8 |
| India | 6.39% | -6.58% | -0.004 | Sensex | 38.8 |
| Taiwan | -0.63% | -7.25% | -0.115 | TAIEX | 69.7 |
| Japan | -1.35% | -7.68% | -0.073 | Nikkei 225 | 163.6 |
*S. Africa uses SPY (no local index data available in FMP).
Switching to local benchmarks changes the picture. Several exchanges that looked terrible vs SPY (like Thailand and Switzerland) actually beat their home index. But the US, where the ETF ecosystem is deepest, still underperforms by -5.11%. The strategy works better in markets where passive ownership is less concentrated, but in the most developed passive markets, under-owned stocks still trail.
The Screen
Current screen for least-crowded quality stocks:
WITH crowding AS (
  SELECT
    eh.asset AS symbol,
    COUNT(DISTINCT eh.symbol) AS etf_count
  FROM etf_holder eh
  JOIN profile p ON eh.asset = p.symbol
  WHERE p.exchange IN ('NYSE', 'NASDAQ')
  GROUP BY eh.asset
  HAVING COUNT(DISTINCT eh.symbol) >= 5
)
SELECT
  c.symbol,
  c.etf_count,
  ROUND(k.returnOnEquityTTM * 100, 1) AS roe_pct,
  ROUND(r.priceToEarningsRatioTTM, 1) AS pe_ratio,
  ROUND(k.marketCap / 1e9, 1) AS market_cap_bn
FROM crowding c
JOIN key_metrics_ttm k ON c.symbol = k.symbol
JOIN financial_ratios_ttm r ON c.symbol = r.symbol
WHERE k.returnOnEquityTTM > 0.10
  AND r.priceToEarningsRatioTTM > 0
  AND r.priceToEarningsRatioTTM < 40
  AND k.marketCap > 1000000000
ORDER BY c.etf_count ASC
LIMIT 30
Run this screen on Ceta Research
Limitations
Snapshot crowding data. The biggest limitation. We use current ETF holdings to classify stocks across all 20 years. Stocks that are under-owned today may not have been under-owned in 2005. This look-ahead bias likely overstates the "true" anti-crowding effect, making the underperformance finding more robust (if anything, the real strategy would perform worse).
Annual rebalancing. The portfolio rebalances once per year. Crowding levels can shift within a year as ETFs are created, liquidated, or rebalanced. An intra-year shift in ETF ownership isn't captured until the next July.
Equal weighting. All 30 positions get equal weight regardless of market cap or conviction. A market-cap-weighted or score-weighted approach might produce different results.
SPY benchmark. SPY represents large-cap US stocks. An equal-weight benchmark (RSP) or small-cap benchmark (IWM) might be more appropriate given the portfolio's composition.
Quality filters narrow the field. Requiring ROE > 10% and P/E 0-40 means the portfolio excludes many truly under-owned stocks (unprofitable, high-growth, or deep-value companies). A broader definition of "under-owned" could produce different results.
Takeaway
The anti-crowding hypothesis sounds compelling. Stocks ignored by passive money should have cleaner price signals and less flow-driven noise. Academic research confirms that ETF ownership creates real distortions: more volatility, more co-movement, less informativeness.
But distortion doesn't mean overvaluation. The data shows that ETF flows create a persistent tailwind for crowded stocks, not a headwind. Under-owned quality stocks miss this tailwind and underperform consistently. The strategy won only 35% of years against SPY and produced a Sharpe ratio of 0.181 vs 0.536.
The practical lesson: ETF crowding is a real structural feature of markets. Understand it, measure it. But "buy what passive money ignores" isn't a viable return strategy. The stocks that ETFs crowd into are, on average, better investments than the ones they don't.
Data: Ceta Research (FMP financial data warehouse), July 2005 to July 2025. ETF holdings are current snapshot data. Full methodology: backtests/METHODOLOGY.md. Code: backtests/etf-crowding. Past performance does not guarantee future results. This is educational content, not investment advice.
References
- Ben-David, I., Franzoni, F. & Moussawi, R. (2018). "Do ETFs Increase Volatility?" Journal of Finance, 73(6), 2471-2535.
- Israeli, D., Lee, C. & Sridharan, S. (2017). "Is There a Dark Side to Exchange Traded Funds?" Review of Accounting Studies, 22(3), 1048-1083.
- Da, Z. & Shive, S. (2018). "Exchange Traded Funds and Asset Return Correlations." European Financial Review, 22(6), 2400-2428.
- Cooper, M., Gulen, H. & Schill, M. (2008). "Asset Growth and the Cross-Section of Stock Returns." Journal of Finance, 63(4), 1609-1651.


