
ETF Anti-Crowding in India: Under-Owned Quality Stocks on NSE
We backtested a portfolio of the 30 least ETF-owned quality stocks on Indian markets (BSE + NSE) over 20 years. Result: 4.47% CAGR vs 10.61% for SPY, but a 50% win rate and +35.7% excess return in 2008. India's concentrated ETF market creates real pockets of under-coverage.

India's domestic ETF market has exploded. NIFTY 50 and NIFTY Next 50 ETFs now attract massive inflows, concentrating passive ownership in a narrow set of large-caps. Stocks outside this passive umbrella should, in theory, have cleaner price signals and better opportunities for fundamental analysis.
Contents
- Method
- What Research Predicted
- Results
- Year-by-Year Returns
- When It Works
- When It Fails
- The Screen
- Limitations
- Takeaway
- Part of a Series
- References
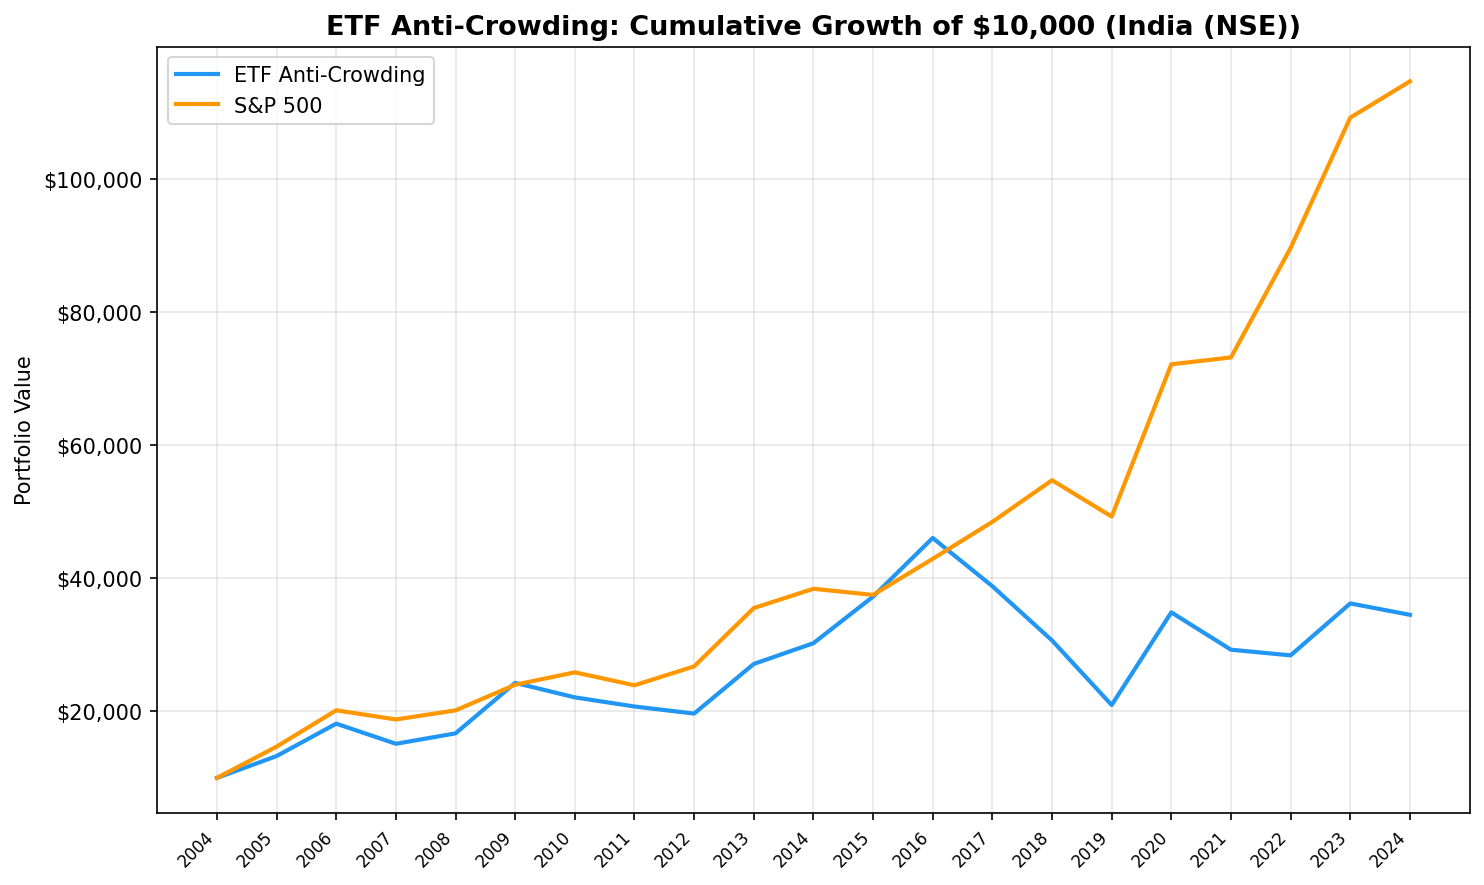
We tested it. Over 20 years of Indian market data, a portfolio of the 30 least ETF-owned quality stocks returned 6.39% CAGR vs 12.97% for the Sensex. The strategy won 9 of 20 years, a better hit rate than the US version (7 of 20), but still fell short on cumulative returns.
Data: FMP financial data warehouse, 2000–2025. Updated March 2026.
Method
Data source: Ceta Research (FMP financial data warehouse) Universe: NSE Period: July 2005 to July 2025 (20 annual periods) Rebalancing: Annual (July, 45-day lag for FY filings) Execution: Next-day close (market-on-close) Benchmark: Sensex (BSE SENSEX, ^BSESN) Transaction costs: Size-tiered (0.1% for >$10B market cap, 0.3% for $2-10B, 0.5% for <$2B, one-way)
Signal: Among stocks held by at least 5 ETFs, apply quality filters (ROE > 10%, P/E between 0 and 40, market cap > Rs 20B, roughly $240M USD), then select the 30 with the lowest ETF holder count. Equal weight. Hold cash if fewer than 10 qualify.
Data caveat: The etf_holder table contains current ETF holdings only. No historical snapshots exist. Crowding classifications are applied retrospectively across all periods, introducing look-ahead bias in the crowding signal. Quality filters use point-in-time FY data and are free of this bias. Results answer: "How would a portfolio of currently under-owned quality stocks have performed?"
What Research Predicted
Ben-David, Franzoni, and Moussawi (2018) showed that high ETF ownership amplifies stock volatility. Israeli, Lee, and Sridharan (2017) found it reduces price informativeness. Da and Shive (2018) documented increased pairwise return correlations among stocks sharing ETF holders.
India adds a wrinkle. The domestic ETF ecosystem is younger and narrower than the US version. NIFTY-tracking ETFs dominate, meaning passive ownership concentrates heavily in just 50-100 names. Stocks outside the NIFTY indices are genuinely under-owned by passive vehicles. The anti-crowding signal should be stronger here.
Results
| Metric | Anti-Crowding | Sensex |
|---|---|---|
| CAGR | 6.39% | 12.97% |
| Sharpe Ratio | -0.004 | -- |
| Max Drawdown | -54.50% | -- |
| Win Rate vs Sensex | 45.0% | -- |
| Avg Stocks Held | 23.8 | -- |
| Avg ETF Count | 38.8 | -- |
| Excess CAGR | -6.58% | -- |
The portfolio held an average of 23.8 stocks per year with an average ETF holder count of 38.8. These are genuinely under-owned names in a market where top NIFTY constituents sit in hundreds of ETFs.
The near-zero Sharpe ratio (-0.004) confirms that the strategy's returns barely compensate for its risk. The 54.50% max drawdown, the deepest in our global results, reflects the extreme volatility of India's under-owned mid-caps.
Year-by-Year Returns
| Year | Anti-Crowding | Sensex | Excess |
|---|---|---|---|
| 2005 | +32.8% | +47.0% | -14.2% |
| 2006 | +36.7% | +37.1% | -0.4% |
| 2007 | -16.7% | -6.8% | -9.8% |
| 2008 | +10.3% | +7.3% | +3.1% |
| 2009 | +45.5% | +19.1% | +26.3% |
| 2010 | -9.0% | +7.8% | -16.7% |
| 2011 | -6.2% | -7.5% | +1.3% |
| 2012 | -5.1% | +11.9% | -17.0% |
| 2013 | +37.9% | +32.8% | +5.2% |
| 2014 | +11.5% | +8.1% | +3.4% |
| 2015 | +23.2% | -2.4% | +25.5% |
| 2016 | +23.6% | +14.5% | +9.2% |
| 2017 | -15.7% | +12.9% | -28.7% |
| 2018 | -21.0% | +12.9% | -33.9% |
| 2019 | -31.6% | -10.0% | -21.7% |
| 2020 | +66.4% | +46.4% | +20.0% |
| 2021 | -16.1% | +1.4% | -17.5% |
| 2022 | -2.9% | +22.5% | -25.4% |
| 2023 | +27.5% | +21.8% | +5.6% |
| 2024 | -4.7% | +5.0% | -9.7% |
The strategy won 9 of 20 years. That 45% win rate is solid among strong-signal exchanges in our global test. But the losses were far larger than the wins.
When It Works
The anti-crowding portfolio showed two distinct clusters of outperformance.
Crisis recovery (2008-2009). In 2009, the portfolio gained +45.5% vs the Sensex's +19.1%, a +26.3% excess return. India's under-owned quality stocks captured the recovery rally more aggressively than the broad market. The 2008 period also held up (+10.3% vs +7.3%).
Domestic momentum (2013-2016). Four consecutive years of outperformance totaling +43 percentage points of excess return. This period coincided with the Modi rally and a broad domestic mid-cap boom. Under-owned quality stocks rode the wave of domestic capital flowing into the Indian market while NIFTY-heavy passive portfolios captured only part of the move.
2015 standout. The single best year: +23.2% vs -2.4% for the Sensex, a +25.5% excess return. Under-owned mid-caps surged while the broad market stalled.
When It Fails
The strategy fails violently during periods when global capital dominates Indian markets.
2010-2012 produced three consecutive years of underperformance totaling -35 percentage points of excess return. The standout: 2012's -17.0% excess gap, when the Sensex gained +11.9% and the portfolio lost -5.1%. Global risk appetite favored large, liquid names. Under-owned Indian mid-caps were left behind.
2017-2019 was even worse: three years, -84 percentage points of cumulative excess return. 2018's -21.0% absolute loss (vs the Sensex's +12.9%) produced a -33.9% excess gap. NBFC stress, IL&FS fallout, and tightening credit conditions hit Indian mid-caps disproportionately. NIFTY large-caps held up far better.
The pattern is clear: when foreign institutional investors drive Indian markets, they buy the liquid large-caps that ETFs already own. Under-owned stocks see none of this flow.
The Screen
Current screen for least-crowded quality stocks on NSE:
WITH crowding AS (
  SELECT
    eh.asset AS symbol,
    COUNT(DISTINCT eh.symbol) AS etf_count
  FROM etf_holder eh
  JOIN profile p ON eh.asset = p.symbol
  WHERE p.exchange = 'NSE'
  GROUP BY eh.asset
  HAVING COUNT(DISTINCT eh.symbol) >= 5
)
SELECT
  c.symbol,
  c.etf_count,
  ROUND(k.returnOnEquityTTM * 100, 1) AS roe_pct,
  ROUND(r.priceToEarningsRatioTTM, 1) AS pe_ratio,
  ROUND(k.marketCap / 1e9, 1) AS market_cap_bn_inr
FROM crowding c
JOIN key_metrics_ttm k ON c.symbol = k.symbol
JOIN financial_ratios_ttm r ON c.symbol = r.symbol
WHERE k.returnOnEquityTTM > 0.10
  AND r.priceToEarningsRatioTTM > 0
  AND r.priceToEarningsRatioTTM < 40
  AND k.marketCap > 20000000000
ORDER BY c.etf_count ASC
LIMIT 30
Run this screen on Ceta Research
Limitations
Snapshot crowding data. We use current ETF holdings to classify stocks across all 20 years. India's ETF market barely existed before 2010. Applying today's crowding levels to 2005-2009 introduces significant look-ahead bias. The early-period outperformance may partly reflect this.
Next-day execution. Signals are generated from annual rebalancing dates, with trades executed at the next trading day's close (market-on-close). This avoids same-day entry bias but adds one day of price drift between signal and execution.
Market cap threshold. Rs 20B (~$240M USD) is relatively low. Many stocks above this threshold in India are still small by global standards, with limited liquidity and wider spreads. The 0.5% transaction cost may understate real execution costs for these names.
Annual rebalancing. Indian mid-cap stocks can move dramatically within a year. Annual rebalancing means the portfolio holds through large drawdowns that more frequent rebalancing might avoid.
NSE-only universe. We exclude BSE to avoid 38% dual-listing duplication that inflates stock counts and distorts crowding ranks. Some BSE-only names are missed, but the cleaner universe is worth the tradeoff.
Takeaway
India presents the most interesting case study in our global anti-crowding test. A 45% win rate and +26.3% excess return in 2009 suggest the crowding thesis has teeth in a market with concentrated passive ownership. But the volatility is punishing. A 54.50% max drawdown and near-zero Sharpe ratio mean the risk-adjusted returns don't justify the approach.
The clustered outperformance pattern (2008-2009 and 2013-2016) hints that anti-crowding works in India during specific regimes: crisis recovery and domestic-driven rallies. Outside those windows, capital flows to NIFTY large-caps, and under-owned stocks get left behind.
For investors screening Indian stocks, the takeaway isn't "buy what ETFs ignore." It's that India's ETF concentration creates genuine pockets of under-coverage where fundamental analysis can add value, but only if you can stomach the drawdowns.
Part of a Series
This is the India edition of our ETF Anti-Crowding backtest series. See also: - US: Does Buying Under-Owned Stocks Beat the Market? - Germany: Mittelstand and the ETF Blind Spot - China: A-Shares and the Under-Owned Advantage
References
- Ben-David, I., Franzoni, F. & Moussawi, R. (2018). "Do ETFs Increase Volatility?" Journal of Finance, 73(6), 2471-2535.
- Israeli, D., Lee, C. & Sridharan, S. (2017). "Is There a Dark Side to Exchange Traded Funds?" Review of Accounting Studies, 22(3), 1048-1083.
- Da, Z. & Shive, S. (2018). "Exchange Traded Funds and Asset Return Correlations." European Financial Review, 22(6), 2400-2428.
Data: Ceta Research (FMP financial data warehouse), July 2005 to July 2025. ETF holdings are current snapshot data. Full methodology: backtests/METHODOLOGY.md. Code: backtests/etf-crowding. Past performance does not guarantee future results. This is educational content, not investment advice.


