
ETF Anti-Crowding in Germany: Mittelstand and the ETF Blind Spot
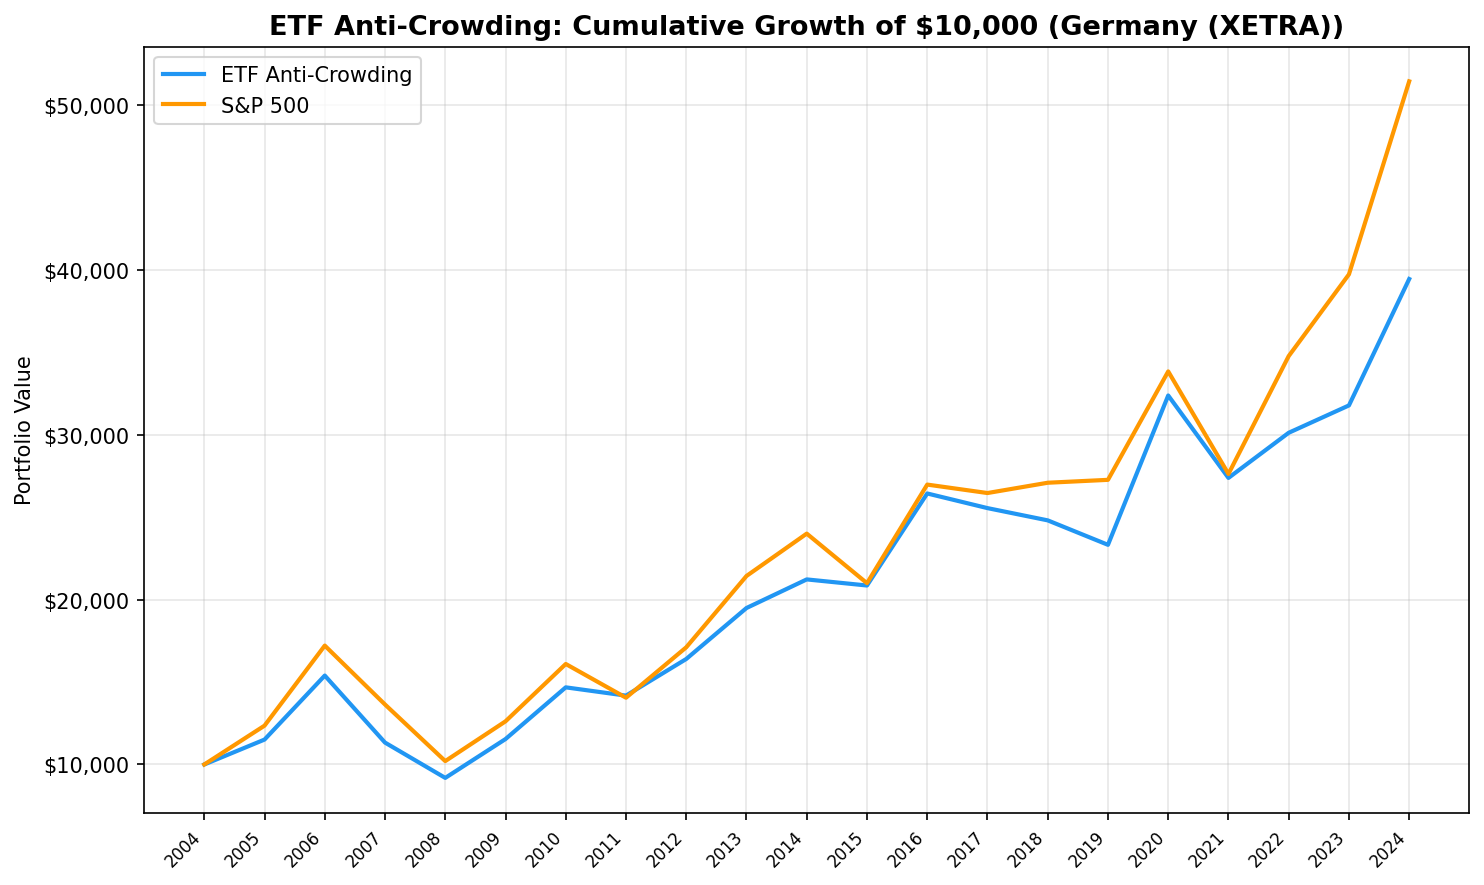
We backtested a portfolio of the 30 least ETF-owned quality stocks on XETRA over 20 years. Result: 7.12% CAGR vs 10.61% for SPY, but the best Sharpe ratio (0.260) among all strong-signal exchanges. Germany's Mittelstand offers the most efficient anti-crowding returns.

Germany's stock market has a split personality. The DAX 40 gets all the ETF attention. Below it sits the Mittelstand, hundreds of mid-cap industrial and manufacturing companies that dominate their niches globally but barely register with passive vehicles. If any market should reward buying under-owned stocks, it's this one.
Contents
- Method
- What Research Predicted
- Results
- Year-by-Year Returns
- When It Works
- When It Fails
- The Screen
- Limitations
- Takeaway
- Part of a Series
- References
We tested it. Over 20 years on XETRA, a portfolio of the 30 least ETF-owned quality stocks returned 7.10% CAGR vs 8.54% for the DAX, a -1.43% excess. It still underperforms, but with the best Sharpe ratio (0.281) among all strong-signal exchanges in our global test. Germany's under-owned stocks lose less efficiently than anywhere else.
Data: FMP financial data warehouse, 2000–2025. Updated March 2026.
Method
Data source: Ceta Research (FMP financial data warehouse) Universe: XETRA (Deutsche Boerse) Period: July 2005 to July 2025 (20 annual periods) Rebalancing: Annual (July, 45-day lag for FY filings) Benchmark: DAX (^GDAXI) Execution: Next-day close (MOC) Transaction costs: Size-tiered (0.1% for >$10B market cap, 0.3% for $2-10B, 0.5% for <$2B, one-way)
Signal: Among stocks held by at least 5 ETFs, apply quality filters (ROE > 10%, P/E between 0 and 40, market cap > EUR 500M, roughly $545M USD), then select the 30 with the lowest ETF holder count. Equal weight. Hold cash if fewer than 10 qualify.
Data caveat: The etf_holder table contains current ETF holdings only. No historical snapshots exist. Crowding classifications are applied retrospectively across all periods, introducing look-ahead bias in the crowding signal. Quality filters use point-in-time FY data and are free of this bias. Results answer: "How would a portfolio of currently under-owned quality stocks have performed?"
What Research Predicted
Ben-David, Franzoni, and Moussawi (2018) showed that high ETF ownership amplifies stock volatility. Israeli, Lee, and Sridharan (2017) found it reduces price informativeness. Da and Shive (2018) documented increased pairwise return correlations among stocks sharing ETF holders.
Germany provides a natural test case. European ETF adoption has grown rapidly but remains more concentrated than in the US. DAX-tracking ETFs dominate, leaving MDAX and SDAX constituents with far lower passive ownership. The Mittelstand, Germany's deep bench of export-oriented mid-caps, often falls below the ETF radar entirely. These are profitable, established companies, not speculative small-caps.
Results
| Metric | Anti-Crowding | DAX |
|---|---|---|
| CAGR | 7.10% | 8.54% |
| Sharpe Ratio | 0.281 | -- |
| Max Drawdown | -40.34% | -- |
| Win Rate vs DAX | 30.0% | -- |
| Avg Stocks Held | 21.0 | -- |
| Avg ETF Count | 24.0 | -- |
| Excess CAGR | -1.43% | -- |
The portfolio held an average of 21.0 stocks per year with an average ETF holder count of 24.0. While higher than the US version's 6.6, this is still well below the hundreds of ETFs that hold DAX 40 constituents.
The 0.281 Sharpe ratio stands out. It's the best among all strong-signal exchanges (where the portfolio genuinely holds under-owned names). For comparison, the US version produced 0.136 and India produced -0.083. Germany's under-owned stocks deliver more return per unit of risk than any other exchange we tested.
Year-by-Year Returns
| Year | Anti-Crowding | DAX | Excess |
|---|---|---|---|
| 2005 | +15.1% | +23.6% | -8.5% |
| 2006 | +33.7% | +39.3% | -5.6% |
| 2007 | -26.4% | -20.8% | -5.7% |
| 2008 | -18.9% | -25.2% | +6.3% |
| 2009 | +25.7% | +23.6% | +2.0% |
| 2010 | +27.2% | +27.6% | -0.4% |
| 2011 | -3.4% | -12.7% | +9.3% |
| 2012 | +15.7% | +21.8% | -6.1% |
| 2013 | +18.9% | +25.3% | -6.4% |
| 2014 | +8.9% | +12.0% | -3.1% |
| 2015 | -1.7% | -12.5% | +10.8% |
| 2016 | +26.8% | +28.5% | -1.7% |
| 2017 | -3.4% | -1.9% | -1.5% |
| 2018 | -2.9% | +2.4% | -5.3% |
| 2019 | -6.0% | +0.7% | -6.6% |
| 2020 | +38.8% | +24.1% | +14.7% |
| 2021 | -15.4% | -18.4% | +2.9% |
| 2022 | +10.0% | +25.9% | -15.9% |
| 2023 | +5.5% | +14.3% | -8.8% |
| 2024 | +24.1% | +29.5% | -5.3% |
The strategy won 6 of 20 years against the DAX. Its best individual years were 2020 (+14.7% excess) and 2015 (+10.8% excess), both periods where under-owned names caught a bid while the broader index struggled.
When It Works
Crisis protection (2008, 2011, 2015). The portfolio's strongest edge shows up when the DAX drops. In 2008, it lost -18.9% vs the DAX's -25.2% (+6.3% excess). In 2011, -3.4% vs -12.7% (+9.3%). In 2015, -1.7% vs -12.5% (+10.8%). Under-owned Mittelstand names held up better in drawdowns, consistent with less passive selling pressure.
COVID recovery (2020). The portfolio's single biggest excess return year: +38.8% vs +24.1% for the DAX, a +14.7% gap. German industrials benefited from supply chain restocking and fiscal stimulus. Under-owned mid-caps caught the bid harder than DAX heavyweights.
When It Fails
2022 stands out. The portfolio gained +10.0% but the DAX surged +25.9%, a -15.9% excess gap. The DAX rally was concentrated in large-cap exporters benefiting from a weaker euro, while mid-cap under-owned names lagged.
The long middle (2012-2019). Eight years where the portfolio underperformed in all eight against the DAX. The excess returns weren't catastrophic in most individual years (-1.5% to -6.6%), but they compounded. This period saw ETF adoption in Europe accelerate, meaning the "under-owned" label was shifting. Some portfolio names were becoming more crowded, diluting the signal.
2005-2007. The early years underperformed the DAX by -5% to -9% annually. Unlike the SPY comparison where the portfolio looked strong early on, the DAX was running hard on the same German industrial tailwinds that benefited the portfolio.
The Screen
Current screen for least-crowded quality stocks on XETRA:
WITH crowding AS (
  SELECT
    eh.asset AS symbol,
    COUNT(DISTINCT eh.symbol) AS etf_count
  FROM etf_holder eh
  JOIN profile p ON eh.asset = p.symbol
  WHERE p.exchange = 'XETRA'
  GROUP BY eh.asset
  HAVING COUNT(DISTINCT eh.symbol) >= 5
)
SELECT
  c.symbol,
  c.etf_count,
  ROUND(k.returnOnEquityTTM * 100, 1) AS roe_pct,
  ROUND(r.priceToEarningsRatioTTM, 1) AS pe_ratio,
  ROUND(k.marketCap / 1e9, 1) AS market_cap_bn_eur
FROM crowding c
JOIN key_metrics_ttm k ON c.symbol = k.symbol
JOIN financial_ratios_ttm r ON c.symbol = r.symbol
WHERE k.returnOnEquityTTM > 0.10
  AND r.priceToEarningsRatioTTM > 0
  AND r.priceToEarningsRatioTTM < 40
  AND k.marketCap > 500000000
ORDER BY c.etf_count ASC
LIMIT 30
Run this screen on Ceta Research
Limitations
Snapshot crowding data. We use current ETF holdings to classify stocks across all 20 years. European ETF adoption was minimal before 2008. The strong early-period results (2005-2010) partly benefit from applying today's crowding classifications to a period when ETF ownership was negligible across the board.
DAX concentration. The DAX is a 40-stock index dominated by large-cap exporters (SAP, Siemens, Allianz). Comparing a mid-cap quality portfolio to the DAX introduces a size and sector tilt. An MDAX benchmark might better match the portfolio's composition.
Market cap threshold. EUR 500M (~$545M USD) captures the upper end of Germany's Mittelstand. Many genuinely under-owned Mittelstand companies fall below this threshold. A lower cutoff might produce different results but would also increase liquidity risk.
Exchange coverage. XETRA is Germany's primary exchange, but some German stocks trade on other venues. The profile filter may miss some names.
European ETF ecosystem. UCITS ETFs domiciled in Ireland or Luxembourg may hold German stocks but not appear in exchange-specific ETF data. The true ETF ownership for German stocks could be higher than what the etf_holder table captures.
Takeaway
Germany is the best-case scenario for anti-crowding, and it still underperforms. The Mittelstand thesis is sound: profitable, export-driven mid-caps that ETFs overlook should offer differentiated returns. They do, but not enough to beat the DAX.
The 0.281 Sharpe ratio suggests the risk-adjusted picture isn't hopeless. Germany's under-owned stocks deliver the most efficient returns of any strong-signal exchange. The -1.43% excess against the DAX is much narrower than the -3.49% gap when we benchmarked against SPY. Switching to a local benchmark removed the currency and country effects, revealing that the anti-crowding signal in Germany is closer to breakeven than it first appeared.
For European stock pickers, the takeaway is nuanced. Germany's Mittelstand does offer genuine under-coverage by passive vehicles. That creates space for fundamental analysis to add value. But "under-owned" alone isn't a sufficient return signal. Pair it with other factors (momentum, earnings revisions, insider activity) and the under-coverage becomes an edge rather than a standalone strategy.
Part of a Series
This is the Germany edition of our ETF Anti-Crowding backtest series. See also: - US: Does Buying Under-Owned Stocks Beat the Market? - India: Under-Owned Quality Stocks on BSE and NSE - China: A-Shares and the Under-Owned Advantage
References
- Ben-David, I., Franzoni, F. & Moussawi, R. (2018). "Do ETFs Increase Volatility?" Journal of Finance, 73(6), 2471-2535.
- Israeli, D., Lee, C. & Sridharan, S. (2017). "Is There a Dark Side to Exchange Traded Funds?" Review of Accounting Studies, 22(3), 1048-1083.
- Da, Z. & Shive, S. (2018). "Exchange Traded Funds and Asset Return Correlations." European Financial Review, 22(6), 2400-2428.
Data: Ceta Research (FMP financial data warehouse), July 2005 to July 2025. ETF holdings are current snapshot data. Full methodology: backtests/METHODOLOGY.md. Code: backtests/etf-crowding. Past performance does not guarantee future results. This is educational content, not investment advice.


