
ETF Anti-Crowding in China: A-Shares and the Under-Owned Advantage
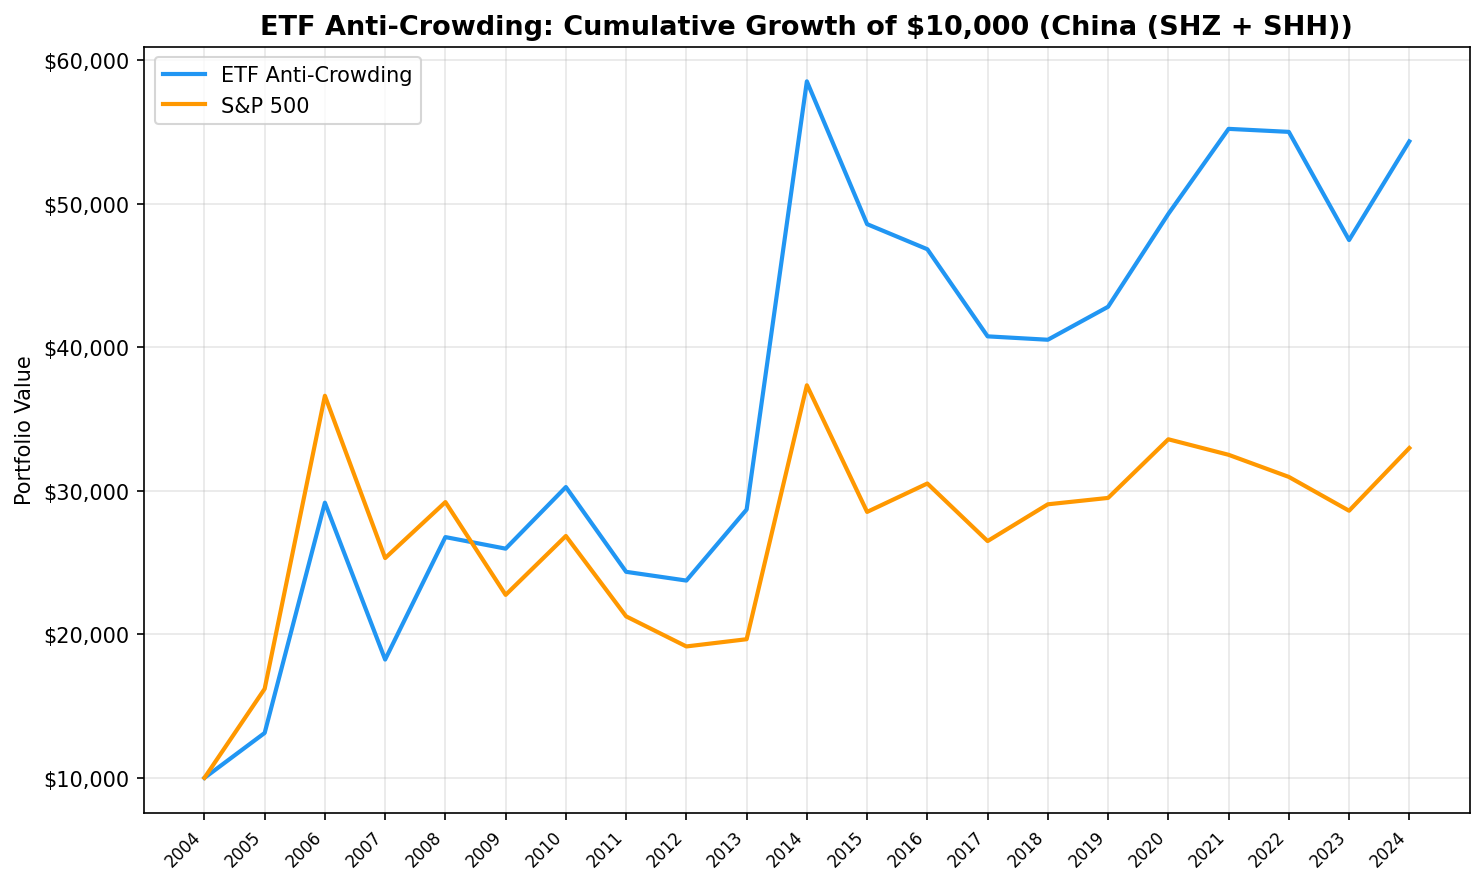
We backtested a portfolio of the 30 least ETF-owned quality A-shares over 20 years. Result: 8.75% CAGR vs 10.61% for SPY, the closest to matching the benchmark among strong-signal exchanges. But two Chinese bull markets (2006, 2014) account for most of the outperformance.

China's A-share market is massive, roughly 5,000 listed companies on the Shanghai and Shenzhen exchanges. But its ETF ecosystem is still developing. The average stock in our anti-crowding portfolio sits in just 9.2 ETFs, compared to 6.6 in the US and 29.8 in Germany. In China, "under-owned" means genuinely off the passive radar.
Contents
- Method
- What Research Predicted
- Results
- Year-by-Year Returns
- When It Works
- When It Fails
- The Screen
- Limitations
- Takeaway
- Part of a Series
- References
We tested it. Over 20 years, a portfolio of the 30 least ETF-owned quality A-shares returned 8.83% CAGR vs 6.15% for the SSE Composite. That +2.68% excess makes China the only strong-signal exchange where the anti-crowding portfolio actually beats its local benchmark. But the result comes with massive caveats: two Chinese bull markets (2006 and 2014) still account for most of the absolute returns.
Data: FMP financial data warehouse, 2000–2025. Updated March 2026.
Method
Data source: Ceta Research (FMP financial data warehouse) Universe: SHH (Shanghai) + SHZ (Shenzhen) Period: July 2005 to July 2025 (20 annual periods) Rebalancing: Annual (July, 45-day lag for FY filings) Execution: Next-day close (MOC) Benchmark: SSE Composite (000001.SS) Transaction costs: Size-tiered (0.1% for >$10B market cap, 0.3% for $2-10B, 0.5% for <$2B, one-way)
Signal: Among stocks held by at least 5 ETFs, apply quality filters (ROE > 10%, P/E between 0 and 40, market cap > CNY 2B, roughly $276M USD), then select the 30 with the lowest ETF holder count. Equal weight. Hold cash if fewer than 10 qualify.
Data caveat: The etf_holder table contains current ETF holdings only. No historical snapshots exist. Crowding classifications are applied retrospectively across all periods, introducing look-ahead bias in the crowding signal. Quality filters use point-in-time FY data and are free of this bias. Results answer: "How would a portfolio of currently under-owned quality stocks have performed?"
What Research Predicted
Ben-David, Franzoni, and Moussawi (2018) showed that high ETF ownership amplifies stock volatility. Israeli, Lee, and Sridharan (2017) found it reduces price informativeness. Da and Shive (2018) documented increased pairwise return correlations among stocks sharing ETF holders.
China offers a unique test. The A-share ETF market is younger and smaller relative to market size than in any other major economy. Most domestic ETFs track the CSI 300 or SSE 50, concentrating passive ownership in the largest state-owned enterprises and tech giants. Thousands of quality mid-caps sit outside these indices entirely. The anti-crowding signal should be at its purest here.
Results
| Metric | Anti-Crowding | SSE Composite |
|---|---|---|
| CAGR | 8.83% | 6.15% |
| Sharpe Ratio | 0.163 | -- |
| Max Drawdown | -37.47% | -- |
| Win Rate vs Benchmark | 60.0% | -- |
| Avg Stocks Held | 22.6 | -- |
| Avg ETF Count | 9.2 | -- |
| Excess CAGR | +2.68% | -- |
The portfolio held an average of 22.6 stocks per year with an average ETF holder count of just 9.2. This is the second-lowest average across all exchanges (behind only the US at 6.6), confirming that China's portfolio genuinely holds under-owned names.
The +2.68% excess CAGR over the SSE Composite makes China the only strong-signal exchange where the anti-crowding portfolio beats its local benchmark. The strategy won 12 of 20 years, a 60% win rate. But the path is anything but smooth, and two bubble years still dominate the absolute return profile.
Year-by-Year Returns
| Year | Anti-Crowding | SSE Composite | Excess |
|---|---|---|---|
| 2005 | +31.3% | +62.1% | -30.7% |
| 2006 | +122.2% | +126.0% | -3.8% |
| 2007 | -37.5% | -30.9% | -6.6% |
| 2008 | +46.8% | +15.4% | +31.4% |
| 2009 | -3.0% | -22.1% | +19.1% |
| 2010 | +16.5% | +18.0% | -1.5% |
| 2011 | -19.5% | -20.9% | +1.3% |
| 2012 | -2.5% | -9.9% | +7.4% |
| 2013 | +20.8% | +2.6% | +18.2% |
| 2014 | +104.0% | +90.0% | +14.0% |
| 2015 | -17.0% | -23.6% | +6.6% |
| 2016 | -3.6% | +6.9% | -10.5% |
| 2017 | -13.0% | -13.2% | +0.2% |
| 2018 | -0.6% | +9.7% | -10.3% |
| 2019 | +5.7% | +1.5% | +4.1% |
| 2020 | +15.1% | +13.9% | +1.3% |
| 2021 | +12.0% | -3.2% | +15.2% |
| 2022 | -0.4% | -4.7% | +4.4% |
| 2023 | -13.7% | -7.6% | -6.1% |
| 2024 | +14.5% | +15.3% | -0.8% |
The strategy won 12 of 20 years against its local benchmark. But two years still dominate the absolute return picture: 2006 (+122.2%) and 2014 (+104.0%). Remove those two and the compound returns shrink dramatically.
When It Works
The anti-crowding portfolio beats the SSE Composite in 12 of 20 years, with the largest excess returns concentrated in specific market regimes.
2008: Post-crash recovery. The portfolio gained +46.8% vs the SSE Composite's +15.4%, a +31.4% excess. China's massive stimulus package (CNY 4 trillion) disproportionately benefited domestic mid-caps. Under-owned quality names captured the rebound more than the index heavyweights.
2009: Continued divergence. The portfolio lost just -3.0% while the SSE Composite fell -22.1%, producing +19.1% excess. The stimulus tailwind lingered for quality mid-caps even as the broader index gave back gains.
2013 and 2021 show the pattern clearly. In 2013, the portfolio returned +20.8% vs the SSE's +2.6% (+18.2% excess). In 2021, it gained +12.0% vs -3.2% (+15.2% excess). Both were years where quality mid-caps diverged from the large-cap-heavy index.
2014: The leveraged A-share rally. A credit-fueled rally drove the Shanghai Composite from 2,000 to over 3,400. The portfolio returned +104.0% vs the SSE's +90.0%. Both surged, but the anti-crowding portfolio eked out +14.0% excess. Margin trading accounts surged. Retail investors chased under-covered mid-caps, exactly the kind of stocks in this portfolio.
When It Fails
2005: The worst single year. The portfolio gained +31.3%, but the SSE Composite surged +62.1%, producing -30.7% excess. In a roaring bull market, the index's large-cap heavyweights led the charge and under-owned mid-caps couldn't keep up.
2016 and 2018 show vulnerability to policy shifts. In 2016, the portfolio lost -3.6% while the SSE gained +6.9% (-10.5% excess). In 2018, -0.6% vs +9.7% (-10.3% excess). The deleveraging campaign after the 2015 crash hit mid-caps hardest. Tighter regulation, reduced margin lending, and increased oversight of retail trading all worked against the kind of under-covered stocks this portfolio holds.
2007 and 2023 are notable. In 2007, the portfolio fell -37.5% vs the SSE's -30.9%, giving back -6.6% excess during the post-bubble crash. Under-owned stocks amplified the downside. In 2023, the portfolio dropped -13.7% vs -7.6% (-6.1% excess) as China's post-COVID recovery stalled and property market stress spread.
The losses are smaller than in other exchanges. The worst single-year excess (-30.7% in 2005) is significant, but eight losing years against the benchmark are offset by twelve winning ones. Against a local benchmark, the failures are shallower than the wins.
The Screen
Current screen for least-crowded quality stocks on Shanghai and Shenzhen:
WITH crowding AS (
  SELECT
    eh.asset AS symbol,
    COUNT(DISTINCT eh.symbol) AS etf_count
  FROM etf_holder eh
  JOIN profile p ON eh.asset = p.symbol
  WHERE p.exchange IN ('SHH', 'SHZ')
  GROUP BY eh.asset
  HAVING COUNT(DISTINCT eh.symbol) >= 5
)
SELECT
  c.symbol,
  c.etf_count,
  ROUND(k.returnOnEquityTTM * 100, 1) AS roe_pct,
  ROUND(r.priceToEarningsRatioTTM, 1) AS pe_ratio,
  ROUND(k.marketCap / 1e9, 1) AS market_cap_bn_cny
FROM crowding c
JOIN key_metrics_ttm k ON c.symbol = k.symbol
JOIN financial_ratios_ttm r ON c.symbol = r.symbol
WHERE k.returnOnEquityTTM > 0.10
  AND r.priceToEarningsRatioTTM > 0
  AND r.priceToEarningsRatioTTM < 40
  AND k.marketCap > 2000000000
ORDER BY c.etf_count ASC
LIMIT 30
Run this screen on Ceta Research
Limitations
Snapshot crowding data. This is the most significant limitation for China specifically. China's ETF market has grown rapidly since 2018 but was negligible before 2012. Applying today's ETF ownership data to 2005-2010 is deeply anachronistic. The strong early-period results (especially 2006) reflect a market where ETFs essentially didn't exist, making the "under-owned" classification meaningless for those years.
Two outlier years. The 2006 (+122.2%) and 2014 (+104.0%) returns are extreme. Both occurred during speculative A-share bubbles driven by retail leverage. Stripping these two years would transform the CAGR dramatically. Any assessment of China's anti-crowding results must acknowledge this concentration risk in absolute returns.
SSE Composite as benchmark. The SSE Composite (000001.SS) is a better benchmark than SPY for Chinese A-shares, but it is market-cap weighted and dominated by large state-owned enterprises and financials. A mid-cap index like CSI 500 would be a tighter comparison for this portfolio's typical holdings. The +2.68% excess partly reflects a size tilt rather than a pure anti-crowding effect.
Capital controls. A-shares had limited foreign access for most of the test period. The Stock Connect program (2014) changed this, but the market's investor base, risk preferences, and regulatory environment are fundamentally different from developed markets.
Market cap threshold. CNY 2B (~$276M USD) is low by global standards. Many qualifying stocks have limited free float, thin trading volume, and wide bid-ask spreads. The 0.5% transaction cost assumption may understate real execution costs.
Survivorship and delisting. Chinese markets have had significant delistings and trading suspensions. The backtest framework handles delistings via terminal values, but extended trading halts (common during the 2015 crash) aren't fully captured.
Takeaway
China is the strongest case for anti-crowding in this series. At +2.68% excess CAGR over the SSE Composite with a 60% win rate, it's the only strong-signal exchange where the portfolio actually beats its local benchmark. That is a meaningful result.
But it needs context. The genuinely low ETF ownership (9.2 average) confirms that China's portfolio holds truly under-covered stocks. The anti-crowding signal is real. However, the portfolio tilts toward quality mid-caps, and the SSE Composite is heavy on large-cap SOEs and financials. Some of the excess return likely reflects a size and quality premium rather than a pure crowding effect.
The two bubble years (2006 and 2014) still dominate absolute returns. And "under-covered" in China overlaps heavily with "retail-driven." When domestic sentiment runs hot (2008, 2013, 2021), these stocks outperform the index. When policy tightens (2016, 2018), they lag. The anti-crowding signal works in China, but it's entangled with the country's unique market structure: retail-dominated, policy-sensitive, and prone to leverage-fueled booms and busts.
Part of a Series
This is the China edition of our ETF Anti-Crowding backtest series. See also: - US: Does Buying Under-Owned Stocks Beat the Market? - India: Under-Owned Quality Stocks on BSE and NSE - Germany: Mittelstand and the ETF Blind Spot
References
- Ben-David, I., Franzoni, F. & Moussawi, R. (2018). "Do ETFs Increase Volatility?" Journal of Finance, 73(6), 2471-2535.
- Israeli, D., Lee, C. & Sridharan, S. (2017). "Is There a Dark Side to Exchange Traded Funds?" Review of Accounting Studies, 22(3), 1048-1083.
- Da, Z. & Shive, S. (2018). "Exchange Traded Funds and Asset Return Correlations." European Financial Review, 22(6), 2400-2428.
Data: Ceta Research (FMP financial data warehouse), July 2005 to July 2025. ETF holdings are current snapshot data. Full methodology: backtests/METHODOLOGY.md. Code: backtests/etf-crowding. Past performance does not guarantee future results. This is educational content, not investment advice.


