
Earnings Yield Across 13 Global Exchanges: Where High E/P Screening Works
Same earnings yield screen, 13 exchanges. Among foreign markets only India (+6.40% vs SPY) and South Africa (+1.06%) beat the S&P 500 CAGR. vs local benchmarks, all 13 show positive excess. Context matters: the strategy beats local markets but the US market itself was exceptional.

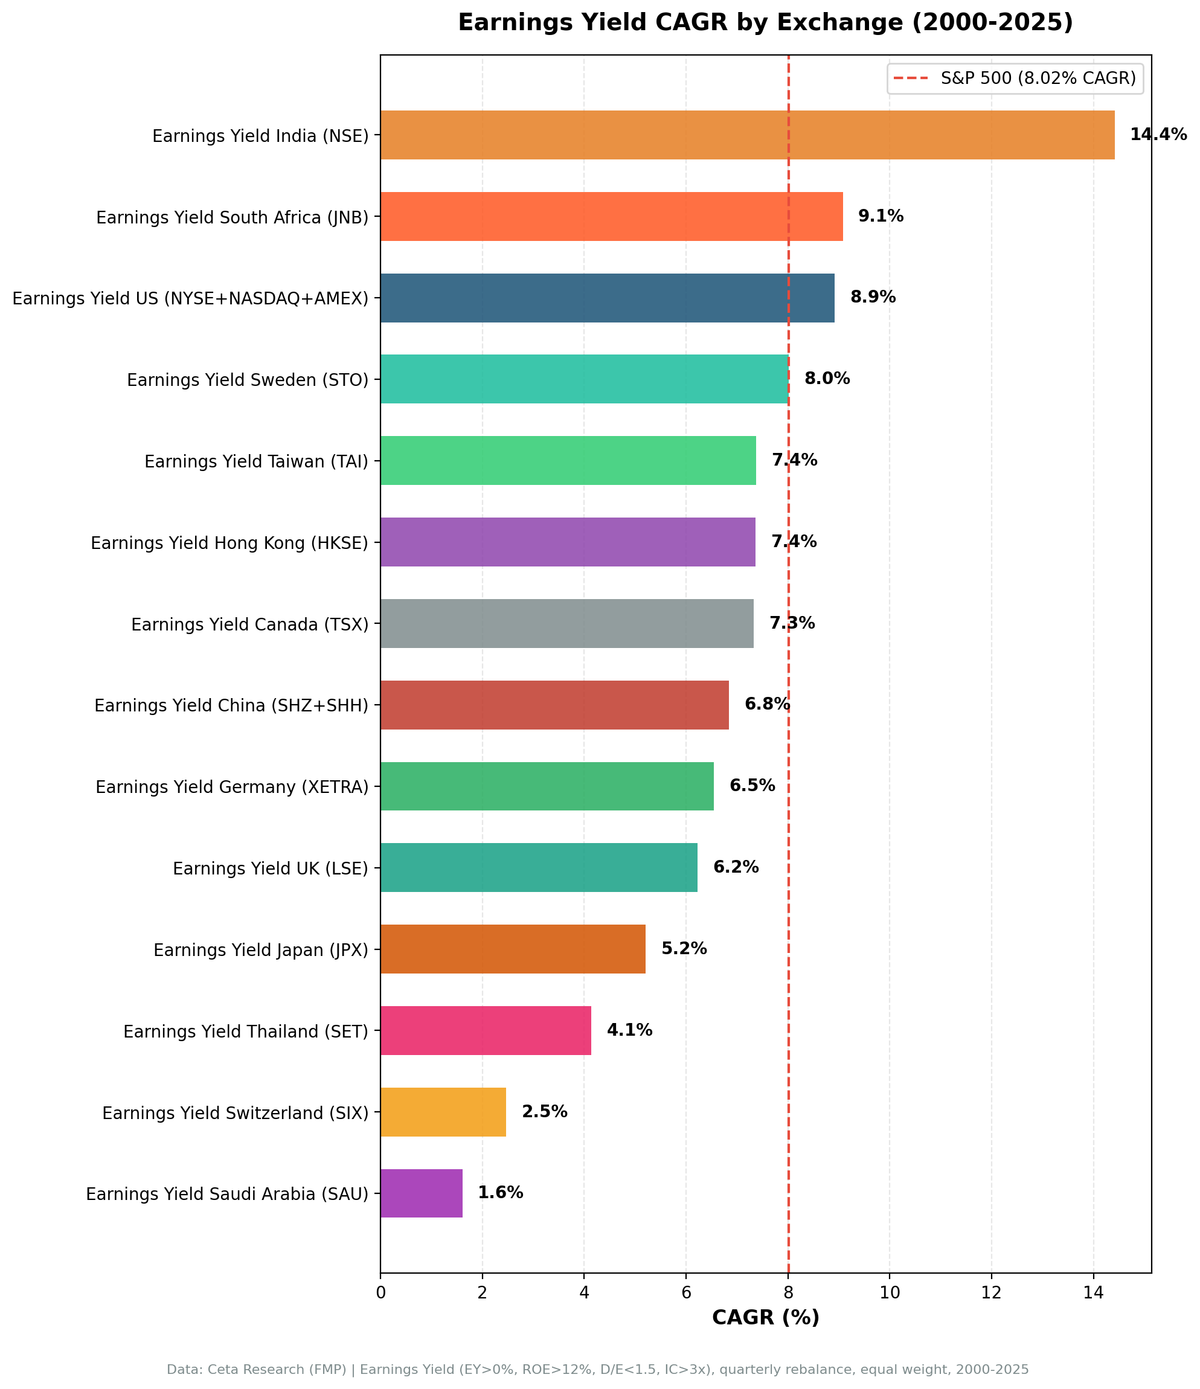
We ran an earnings yield screen across 13 global exchanges to see where buying cheap, quality companies generates alpha. Two foreign markets beat the S&P 500 CAGR outright: India (NSE) delivered +6.40% excess vs SPY, South Africa +1.06%. The US strategy edged its own benchmark by +0.90%. Every other exchange landed below SPY, though Sweden came within a whisker (-0.01%).
Contents
- Method
- Results: The Full Picture
- India: Beats a Strong Local Market
- South Africa: Thin Universe, Real Alpha
- Taiwan: Best Sharpe, Beats TAIEX
- US: Barely Beats Benchmark
- China: Bubble Years Are Real
- Sweden, Canada, Hong Kong: Local Alpha, SPY Lag
- Thailand and Japan: Deep Universe, Weak Local Markets
- Developed Markets: Beat Local Indices, Lag SPY
- The Regime Story: 2000-2010 vs 2013-2021
- Why India Beat Both SPY and Sensex
- The US Market Effect
- The Interest Coverage Filter
- What This Means
- How to Use This Data
- Methodology Transparency
- Run the Screen
- Limitations
vs local benchmarks, the story shifts. Hong Kong beat Hang Seng by +5.59%, UK beat FTSE 100 by +4.86%, Sweden beat OMX Stockholm by +4.84%. Every market shows positive local excess. But those local indices were themselves weaker than SPY over this period.
Method
Filter criteria (applied uniformly across all exchanges): - Earnings yield > 0% (profitable only) - ROE > 12% - Debt/Equity < 1.5 - Interest coverage > 3x - Market cap > exchange-specific threshold
Portfolio construction: Top 50 by highest earnings yield, equal weight, quarterly rebalance Transaction costs: Size-tiered model Period: 2000-2025 (103 quarters) Benchmark: S&P 500 (SPY, USD) for all exchanges
Market cap thresholds are in local currency: $1B for US, ₹20B for India (~$240M), HK$2B for Hong Kong, etc. This ensures comparable universes adjusted for local market structure.
Excluded exchanges: - ASX (Australia): adjClose split artifacts - SAO (Brazil): same data quality issue - KSC (Korea): 17 qualifying stocks (interest coverage filter too strict) - SES (Singapore): 27 qualifying stocks, below threshold - SAU (Saudi Arabia): 40% cash periods, negative Sharpe (-0.114)
Results: The Full Picture
Cross-Market Comparison (vs SPY for consistency):
| Exchange | CAGR | vs SPY | Sharpe | Max DD | Win% vs Local | Avg Stocks | Cash % |
|---|---|---|---|---|---|---|---|
| India (NSE) | 14.42% | +6.40% | 0.295 | -61.40% | 57.28% | 43.2 | 17% |
| South Africa (JNB) | 9.08% | +1.06% | 0.005 | -32.76% | 49.51% | 16.2 | 17% |
| US (NYSE+NASDAQ+AMEX) | 8.92% | +0.90% | 0.327 | -51.05% | 50.49% | 40.7 | 0% |
| Sweden (STO) | 8.01% | -0.01% | 0.317 | -49.85% | 65.05% | 37.5 | 20% |
| Taiwan (TAI) | 7.37% | -0.65% | 0.348 | -51.38% | 54.37% | 44.7 | 20% |
| Hong Kong (HKSE) | 7.36% | -0.66% | 0.160 | -59.55% | 61.17% | 34.0 | 1% |
| Canada (TSX) | 7.33% | -0.69% | 0.287 | -44.10% | 50.49% | 35.1 | 4% |
| China (SHZ+SHH) | 6.84% | -1.18% | 0.129 | -66.64% | 46.60% | 41.0 | 0% |
| Germany (XETRA) | 6.54% | -1.48% | 0.261 | -50.38% | 51.46% | 29.3 | 0% |
| UK (LSE) | 6.22% | -1.80% | 0.143 | -43.36% | 60.19% | 26.9 | 0% |
| Japan (JPX) | 5.21% | -2.81% | 0.267 | -67.02% | 58.25% | 44.4 | 17% |
| Thailand (SET) | 4.14% | -3.88% | 0.084 | -50.15% | 54.37% | 38.6 | 17% |
| Switzerland (SIX) | 2.47% | -5.55% | 0.102 | -67.71% | 59.22% | 23.1 | 1% |
SPY benchmark: 8.02% CAGR, Sharpe 0.361, MaxDD -43.86%
CAGR, vs SPY, Sharpe, and Max DD are cross-market (SPY benchmark). The win-rate column is measured against each exchange's local benchmark (SPY for the US and South Africa, which have no separate local index here).
vs Local Benchmarks (the alternative view):
| Exchange | Strategy CAGR | Local Index | Index CAGR | Local Excess |
|---|---|---|---|---|
| Hong Kong (HKSE) | 7.36% | Hang Seng | 1.77% | +5.59% |
| UK (LSE) | 6.22% | FTSE 100 | 1.36% | +4.86% |
| Sweden (STO) | 8.01% | OMX Stockholm 30 | 3.17% | +4.84% |
| India (NSE) | 14.42% | Sensex | 11.12% | +3.30% |
| Taiwan (TAI) | 7.37% | TAIEX | 4.38% | +3.00% |
| China (SHZ+SHH) | 6.84% | SSE Composite | 4.19% | +2.65% |
| Canada (TSX) | 7.33% | TSX Composite | 5.08% | +2.25% |
| Japan (JPX) | 5.21% | Nikkei 225 | 3.40% | +1.81% |
| Germany (XETRA) | 6.54% | DAX | 5.12% | +1.42% |
| South Africa (JNB) | 9.08% | SPY | 8.02% | +1.06% |
| US | 8.92% | SPY | 8.02% | +0.90% |
| Thailand (SET) | 4.14% | SET Index | 3.76% | +0.38% |
| Switzerland (SIX) | 2.47% | SMI | 2.10% | +0.36% |
This is the key finding: every exchange in the comparison shows positive excess vs its local benchmark. But among foreign markets, only India and South Africa beat SPY itself (the US strategy edged its own benchmark by +0.90%).
India: Beats a Strong Local Market
India's 14.42% CAGR produced +3.30% annual excess over the Sensex. For cross-market comparison, that's +6.40% vs SPY. Three structural advantages:
Win rate vs local benchmark. 57.28% of quarters beat the Sensex. The strategy won more than 5 of every 9 quarters. Compare that to the US at 50.49% vs SPY.
Deep universe. Average 43.2 qualifying stocks meant the top-50 selection was truly filtering, not scraping the bottom.
Beats a strong market. The Sensex itself returned 11.12% CAGR over this period, well above SPY's 8.02%. India's edge is beating an already-strong local market, not riding currency appreciation.
The cost: max drawdown of -61.40%. In 2008 the portfolio dropped -61.4%, in 2011 another -30.6%. Returns are in Indian Rupees. This is high return, high pain.
South Africa: Thin Universe, Real Alpha
South Africa returned 9.08% CAGR with only -32.76% max drawdown. That's the lowest drawdown in the dataset, shallower than SPY's -43.86%.
The Calmar ratio is the best globally. Win rate of 49.51% vs SPY is near parity, though the Sharpe ratio sits near zero (0.005) because the ride was choppy.
The catch: average 16.2 stocks per quarter. This is thinner than we'd prefer, and thinner than it looked in earlier runs once bad price data was filtered out. 17% cash periods meant the strategy wasn't always fully invested. The results are real but based on a smaller sample. The thin universe means this won't scale to large AUM. For portfolios under $10M it's viable. Beyond that you'll move the market.
Taiwan: Best Sharpe, Beats TAIEX
Taiwan produced a Sharpe ratio of 0.348, the highest in the dataset. The strategy returned 7.37% CAGR, beating the TAIEX by +3.00% but lagging SPY by -0.65%.
Low volatility explains the Sharpe. The strategy returned less than SPY but moved less. For risk-adjusted return, Taiwan is the standout.
Win rate vs the local TAIEX was 54.37%, beating the index in more than half of quarters. But the strategy lagged SPY because it didn't participate fully in the US market's bull moves. The defensive profile worked locally, not globally.
US: Barely Beats Benchmark
The US returned 8.92% CAGR, +0.90% over SPY. Over 25 years, earnings yield screening with quality filters added a bit under a percent per year.
Win rate of 50.49% is essentially a coin flip. Sharpe of 0.327 trails SPY's 0.361. The value premium exists but it's small. Transaction costs and rebalancing drag eat into the edge.
This is consistent with the broader literature. The value factor has compressed over time as more capital hunts for cheap stocks. Without a return-on-capital component (as in Greenblatt's full Magic Formula), earnings yield alone captures the cheap end without selecting for capital allocation quality.
The US had similar risk characteristics to SPY but slightly worse risk-adjusted returns. If you ran this in a tax-deferred account with zero transaction costs, the +0.90% edge is real. In a taxable account with bid-ask spreads and market impact, it shrinks.
China: Bubble Years Are Real
China returned 6.84% CAGR, below SPY (-1.18% excess). But vs the SSE Composite, the strategy beat by +2.65% annually. The annual returns tell the story: In 2007 the portfolio gained +218.7%. In 2009, +131.2%.
These aren't data artifacts. The SSE Composite gained +99.6% in 2007 during China's A-share bubble. A concentrated portfolio of cheap, quality stocks outperformed even that. Our filter caps individual stock returns at 200% per quarter, so no single position drove the result.
The flip side: -63.5% in 2008, max drawdown of -66.64%. Chinese A-shares are volatile. The signal works in boom cycles and gets crushed in busts.
Win rate vs the SSE Composite: 46.60% (below 50%). The strategy lagged the US market and edged below the local Chinese index on a quarterly hit-rate basis, but its CAGR still beat the SSE by +2.65%. This is a volatile emerging market where earnings yield screening adds value vs local alternatives.
Sweden, Canada, Hong Kong: Local Alpha, SPY Lag
Three exchanges land just below SPY: Sweden (-0.01%), Hong Kong (-0.66%), and Canada (-0.69%). But vs local benchmarks, all three show strong positive excess.
Sweden: 8.01% CAGR vs OMX Stockholm 30's 3.17% CAGR. That's +4.84% local excess, the third-highest in the dataset. Sharpe 0.317. A 65.05% win rate vs the OMX is the highest in the dataset. The 20% cash periods reduced drag when the universe was thin. Sweden beats its local market convincingly but the OMX Stockholm itself lagged SPY.
Canada: 7.33% CAGR vs TSX Composite 5.08%. That's +2.25% local excess. Sharpe 0.287. Win rate vs the TSX was 50.49%. Only 4% cash periods, 35.1 average stocks. The universe was deep enough and the signal generated consistent alpha vs the local market.
Hong Kong: 7.36% CAGR vs Hang Seng 1.77%. That's +5.59% local excess, the highest in the dataset. Max drawdown of -59.55%. A 61.17% win rate vs the Hang Seng. The Hang Seng itself was one of the weakest major indices over this period.
If you're a local investor in Sweden, Canada, or Hong Kong, earnings yield screening beats the home market. If you're benchmarking to US returns, it lags.
Thailand and Japan: Deep Universe, Weak Local Markets
Thailand and Japan both had deep universes (38.6 and 44.4 average stocks) but returned 4.14% and 5.21% CAGR vs SPY. Both underperformed SPY by about 3% per year. But vs local benchmarks, both show positive excess.
Thailand: 4.14% CAGR vs SET Index 3.76% (+0.38% local excess). Sharpe ratio of 0.084 is among the lowest in the dataset. Max drawdown -50.15%. vs SPY the story is terrible. vs the SET Index, marginal positive alpha.
Japan: 5.21% CAGR vs Nikkei 225 3.40% (+1.81% local excess). Sharpe 0.267. Max drawdown -67.02%. A 58.25% win rate vs the Nikkei. 17% cash periods. The strategy beat the local market but the Nikkei itself was a weak performer.
This is a critical finding. Universe depth alone doesn't produce alpha vs SPY. Japan had a similar number of qualifying stocks to India (44.4 vs 43.2). India returned 14.42% CAGR, Japan returned 5.21%. The difference: India's Sensex returned 11.12%, Japan's Nikkei returned 3.40%. The local market strength dominates the strategy's contribution.
Developed Markets: Beat Local Indices, Lag SPY
| Exchange | CAGR | vs SPY | vs Local | Local Index CAGR |
|---|---|---|---|---|
| UK (LSE) | 6.22% | -1.80% | +4.86% | FTSE 100: 1.36% |
| Germany (XETRA) | 6.54% | -1.48% | +1.42% | DAX: 5.12% |
| Japan (JPX) | 5.21% | -2.81% | +1.81% | Nikkei 225: 3.40% |
| Switzerland (SIX) | 2.47% | -5.55% | +0.36% | SMI: 2.10% |
All four major developed markets underperformed SPY. But all four beat their local indices.
UK: 6.22% CAGR vs FTSE 100's 1.36% is +4.86% local excess, second only to Hong Kong. Sharpe 0.143. Max drawdown -43.36%, roughly matching SPY. For a UK investor, this strategy beat the home market convincingly. For a USD-based investor benchmarking to SPY, it lagged.
Germany: 6.54% CAGR, +1.42% vs the DAX. The DAX returned 5.12% CAGR, the strongest of the four local indices here, so the local excess is smaller even though the strategy's absolute return is the best of the group.
Switzerland: the weakest result in the dataset. 2.47% CAGR is just +0.36% over the SMI's 2.10%, and the -67.71% max drawdown is the deepest of any exchange. A handful of Swiss large-caps carry the index; the broad earnings yield basket gave back most of its edge in the 2008 and 2020 drawdowns.
Japan: 5.21% CAGR, +1.81% vs Nikkei. The Nikkei returned just 3.40% CAGR. The strategy added value locally but Japan's equity market itself was weak.
The pattern: earnings yield screening generates modest local alpha in developed markets, but those markets themselves underperformed the US market over this period. Whether the strategy "works" depends on your reference point.
The Regime Story: 2000-2010 vs 2013-2021
Value worked globally from 2000 to 2010. Then it stopped.
Look at the annual return patterns. The US earnings yield portfolio returned +29.2% in 2003 and +48.2% in 2009, with Germany up +38.2% in 2009. These were value-driven rallies. Cheap stocks outperformed after the dot-com crash and after the financial crisis.
From 2013 to 2021, the pattern flipped. The US portfolio returned +21.0% in 2013 but just +2.0% in 2019 and -12.9% in 2020, while the S&P 500 surged in both years. The winners in the 2010s were large-cap growth, not value.
Passive indexing and mega-cap concentration changed factor dynamics. The S&P 500 became dominated by large-cap growth (Apple, Microsoft, Amazon, Google). Capital flowed into index funds. Small-cap value stocks got less attention, but that didn't translate into mispricing gains.
The academic value premium compressed. Studies from the 1980s and 1990s showed consistent value outperformance. By the 2010s, the premium had shrunk or disappeared in many markets. This backtest confirms that pattern.
India and South Africa retained value premiums because their markets are less indexed, less institutionalized. The US and Europe arbitraged the signal away.
Why India Beat Both SPY and Sensex
India is the only market that beats SPY on CAGR AND beats a strong local index. The Sensex returned 11.12% CAGR over this period. The earnings yield screen beat it by +3.30% annually.
Two structural advantages:
Retail dominance. Indian markets have higher retail participation than developed markets. Retail investors trade on sentiment, news, momentum. They don't systematically screen for earnings yield. Cheap, quality companies get ignored longer. This creates opportunities for disciplined value screens.
Lower indexation. NSE has passive index products but penetration is lower than US/Europe. Less passive capital means less efficient pricing. Active managers can still generate alpha by running basic value screens.
Compare to developed markets: Hong Kong beat Hang Seng by +5.59%, but Hang Seng itself returned just 1.77% CAGR. UK beat FTSE 100 by +4.86%, but FTSE returned 1.36%. These are impressive local alphas over weak markets. India's advantage is beating a strong market (Sensex 11.12%) by a real margin (+3.30%).
The US Market Effect
Developed markets didn't fail at value investing. They failed to beat the US market.
Hong Kong: +5.59% vs Hang Seng. UK: +4.86% vs FTSE 100. Sweden: +4.84% vs OMX Stockholm. Taiwan: +3.00% vs TAIEX. Canada: +2.25% vs TSX. Japan: +1.81% vs Nikkei. Germany: +1.42% vs DAX. Switzerland: +0.36% vs SMI.
All show positive local alpha. The signal works. The issue is that FTSE returned 1.36% CAGR, Hang Seng returned 1.77%, and Nikkei returned 3.40%. These indices were themselves weak. SPY returned 8.02% over the same period.
Transaction costs matter. The backtest uses a size-tiered model: 0.2% for large-cap, 0.5% for mid-cap, 1.0% for small-cap. Rebalancing quarterly means 4 round trips per year. For small-cap positions that's 8% per year in friction. Hong Kong's +5.59% local excess clears that bar easily. Switzerland's +0.36% doesn't.
The honest take: earnings yield screening adds value vs local alternatives in most markets. It doesn't compensate for being in a weak equity market.
The Interest Coverage Filter
We require interest coverage > 3x. This prevents buying overleveraged companies. The filter is strict enough to exclude entire exchanges.
Korea (KSC) had 17 qualifying stocks. Korean companies carry higher leverage than the filter allows. Singapore (SES) had 27 stocks, same reason.
Rather than relax the filter and introduce value traps, we excluded both exchanges. The quality filters exist to avoid companies that can't service debt. They will exclude markets where high leverage is the norm.
What This Means
Earnings yield with quality filters generates positive local alpha in every market we tested. vs SPY, only India and South Africa win among foreign markets. vs local benchmarks, all 13 show positive excess (Saudi Arabia, excluded for thin data, is the only market that doesn't).
The strategy's contribution is consistent: roughly 0.4-5.6% annual excess vs the local index. But the local indices themselves had wildly different returns. FTSE 100 returned 1.36%, Sensex returned 11.12%, SPY returned 8.02%.
For local investors, the data is clear: - Hong Kong investor choosing between a Hang Seng tracker and the earnings yield screen: screen wins by +5.59% - Indian investor choosing between a Sensex tracker and the earnings yield screen: screen wins by +3.30% - US investor choosing between SPY and the earnings yield screen: screen wins by +0.90%
For global allocators benchmarking to SPY, the question is different: should you allocate to the India earnings yield screen (14.42% CAGR) or SPY (8.02%)? The India screen wins on CAGR but comes with -61.4% max drawdown vs SPY's -43.9%.
This is honest value investing. It beats local markets consistently. It doesn't beat the US market from most exchanges. Among foreign markets, only India and South Africa beat SPY outright. That's not diversification, it's concentration in the markets that outperformed the US.
How to Use This Data
If you're running a value strategy globally, here's what the data says:
Prioritize India for global portfolios. The 14.42% CAGR beats both SPY (+6.40%) and the local Sensex (+3.30%). Win rate of 57.28% vs Sensex. The strategy works in a strong local market, not just a weak one. Max drawdown of -61.40% is painful but the recovery was consistent.
South Africa for low drawdown. 9.08% CAGR with -32.76% max drawdown, shallower than SPY's -43.86%. The thin universe (16.2 stocks) means you can't scale this to large AUM, but for smaller portfolios it's the best risk-adjusted emerging market option.
Hong Kong if you're local. +5.59% vs Hang Seng is the highest local excess. But the Hang Seng itself returned 1.77% CAGR. For a Hong Kong investor, earnings yield screening beats the home market convincingly. For a USD-based investor, it lags SPY.
Taiwan for Sharpe. 0.348 Sharpe is the best globally. +3.00% vs TAIEX. Lower absolute return but the smoothest ride. Use it for low-vol value exposure.
Most developed markets add local value. Germany (+1.42% vs DAX), Japan (+1.81% vs Nikkei), Canada (+2.25% vs TSX), UK (+4.86% vs FTSE 100). All beat local benchmarks. But those local markets lagged SPY.
Avoid Thailand, Switzerland, and Saudi Arabia. Thailand's 0.084 Sharpe and +0.38% local excess are marginal. Switzerland's +0.36% local excess comes with the deepest drawdown in the dataset. Saudi Arabia shows negative excess even vs SPY.
US is optional. The +0.90% excess over 25 years is real but thin. In a taxable account with real friction, it shrinks.
Methodology Transparency
Why quarterly rebalancing? Most value studies rebalance annually or semi-annually. We rebalance quarterly to capture mean reversion faster. This increases transaction costs but captures more of the signal. The tradeoff worked in India and South Africa, failed in developed markets.
Why equal weight? Market-cap weighting concentrates the portfolio in large-caps, which reduces the value tilt. Equal weighting maximizes exposure to the signal. The downside is higher turnover and more small-cap exposure.
Why top 50? We wanted deep enough diversification to avoid single-stock blow-ups but concentrated enough to stay in the highest-conviction names. Top 20 would be too concentrated. Top 100 would dilute the signal. Top 50 is the middle ground.
Why ROE > 12%? This filters out low-quality earners. A company can have high earnings yield because the market doesn't trust management to sustain earnings. ROE > 12% ensures the company is generating acceptable returns on equity. Combined with D/E < 1.5 and IC > 3x, this creates a quality screen.
Why interest coverage > 3x? Companies with IC < 3x can't comfortably service debt. In a downturn, they face distress or bankruptcy. We want cheap companies, not distressed companies. The 3x threshold is strict enough to exclude Korea and Singapore entirely. That's intentional.
Run the Screen
WITH km AS (
  SELECT k.* FROM key_metrics_ttm k
  JOIN (SELECT symbol, MAX(fetchedAtEpoch) AS max_e FROM key_metrics_ttm GROUP BY symbol) lat
    ON k.symbol = lat.symbol AND k.fetchedAtEpoch = lat.max_e
),
fr AS (
  SELECT f.* FROM financial_ratios_ttm f
  JOIN (SELECT symbol, MAX(fetchedAtEpoch) AS max_e FROM financial_ratios_ttm GROUP BY symbol) lat
    ON f.symbol = lat.symbol AND f.fetchedAtEpoch = lat.max_e
)
SELECT
    k.symbol,
    ROUND(k.earningsYieldTTM * 100, 2) AS ey_pct,
    ROUND(r.priceToEarningsRatioTTM, 1) AS pe,
    ROUND(k.returnOnEquityTTM * 100, 1) AS roe_pct,
    ROUND(r.debtToEquityRatioTTM, 2) AS de,
    ROUND(r.interestCoverageRatioTTM, 1) AS ic,
    ROUND(k.marketCap / 1e9, 1) AS mktcap_bn,
    p.exchange,
    p.sector
FROM km k
JOIN fr r ON k.symbol = r.symbol
JOIN profile p ON k.symbol = p.symbol
WHERE k.earningsYieldTTM > 0.08
  AND k.earningsYieldTTM < 1.0
  AND r.priceToEarningsRatioTTM > 3
  AND r.priceToEarningsRatioTTM < 100
  AND k.returnOnEquityTTM > 0.12
  AND r.debtToEquityRatioTTM >= 0
  AND r.debtToEquityRatioTTM < 1.5
  AND r.interestCoverageRatioTTM > 3
  AND k.marketCap > 1000000000
QUALIFY ROW_NUMBER() OVER (PARTITION BY p.companyName ORDER BY k.marketCap DESC) = 1
ORDER BY k.earningsYieldTTM DESC
LIMIT 100
Run this screen on Ceta Research →
Backtest code: github.com/ceta-research/backtests/earnings-yield
Limitations
Currency effects. Each exchange returns are in local currency. SPY is in USD. The cross-market SPY comparison mixes strategy alpha with currency movements and local market strength. India's Rupee depreciated from 45 to 83 per USD over the period. The 14.42% INR CAGR converts to roughly 11-12% in USD, still above SPY's 8.02%. We report local-currency returns for consistency.
Local benchmark context. We provide both SPY-based comparison (for cross-market ranking) and local benchmark comparison (for local investor decisions). The UK strategy beats FTSE 100 by +4.86% but lags SPY by -1.80%. These aren't contradictory. They answer different questions: "does this beat my home market?" vs "does this beat the US market?" For global allocators, both matter.
Survivorship bias. Universe based on current exchange membership. Companies that delisted, went bankrupt, or were acquired are included when data exists but may be underrepresented. This biases results upward. The magnitude is hard to quantify but it affects all exchanges equally.
Single factor. This tests earnings yield in isolation. Combined with return on capital (Greenblatt's full Magic Formula) or momentum, results would differ. Earnings yield alone captures cheap companies. It doesn't distinguish between cheap-and-improving vs cheap-and-deteriorating. A multi-factor model would filter better.
Data: FMP financial data warehouse, 2000–2025. Updated June 2026.
Data: Ceta Research (FMP financial data warehouse). Universe: 13 exchanges with exchange-specific market cap thresholds. Backtest uses historical financial_ratios, key_metrics, and stock_eod tables with point-in-time methodology and 45-day reporting lag. Transaction costs: size-tiered (0.1-0.3% one-way based on market cap). Cross-market returns compared in local currency against SPY (USD); currency effects are not adjusted. FMP data has known limitations: coverage varies by company and time period, some historical records may contain errors or gaps, and delisted company data is less complete than active companies. Full methodology: METHODOLOGY.md. Past performance does not guarantee future results. This is educational content, not investment advice.


