
Earnings Growth Consistency on Indian Stocks (NSE): 25-Year Backtest
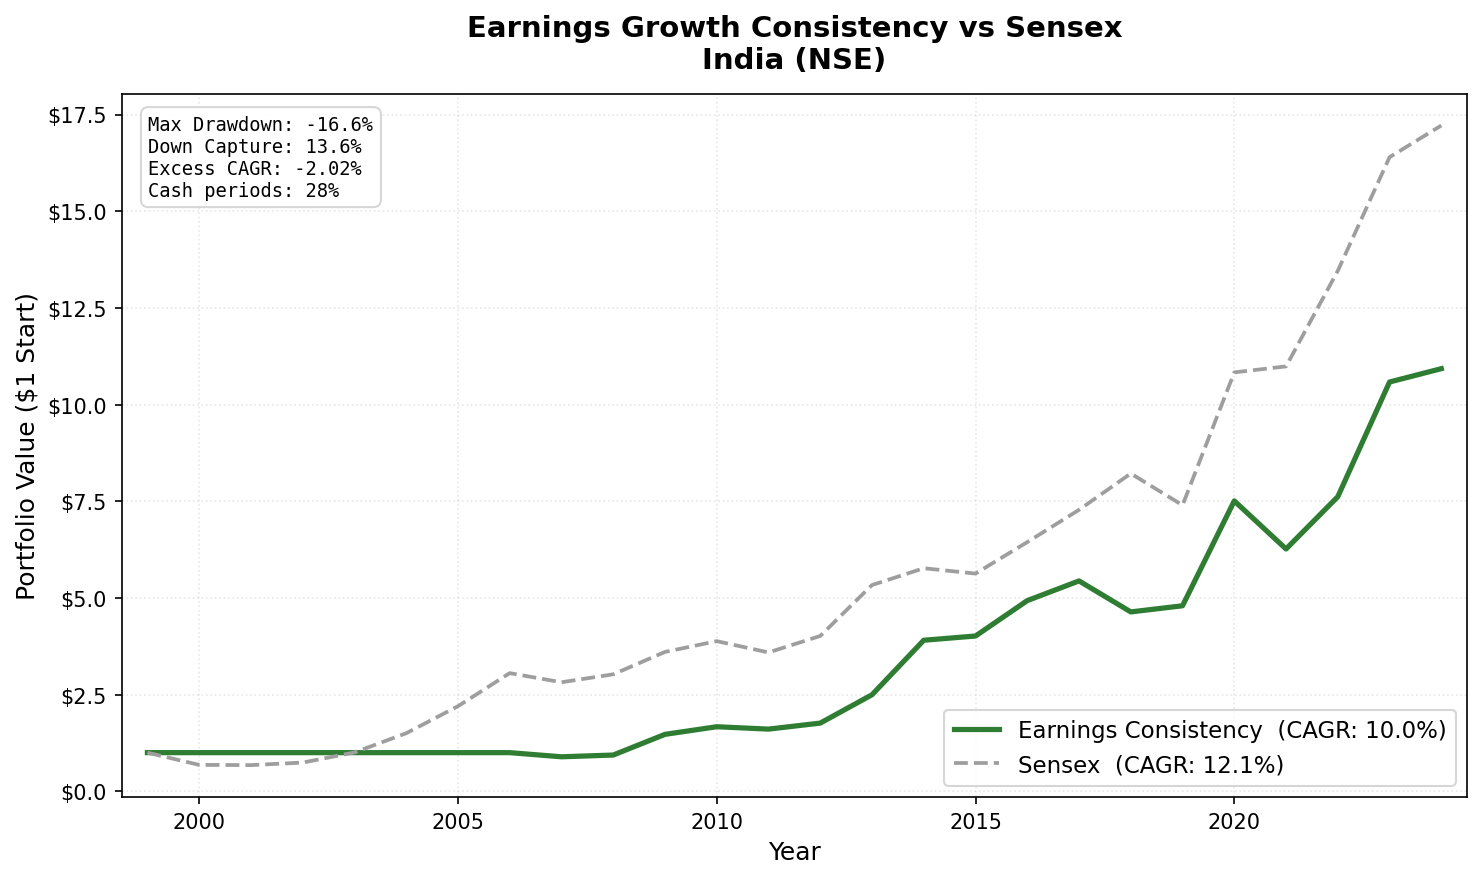
Screened NSE for 3-year net income growth streaks, ROE > 8%, D/E < 2.0. Result: 10.04% CAGR vs 12.06% Sensex (-2.02%). Strong absolute returns but underperforms local benchmark. 2014: +48.3% excess, 2009: +37.9% excess. 7 cash years (2000-2006), 18 invested years.


India delivers strong absolute returns, 10.04% CAGR, but doesn't beat the local Sensex benchmark, which returned 12.06% over the same period. -2.02% underperformance per year vs the Sensex. This is the honest result when comparing Indian equity returns to the Indian market, not to a USD benchmark like SPY.
Contents
- Method
- The Signal
- The Screen (SQL)
- What We Found
- Strong absolute returns but underperforms the Sensex.
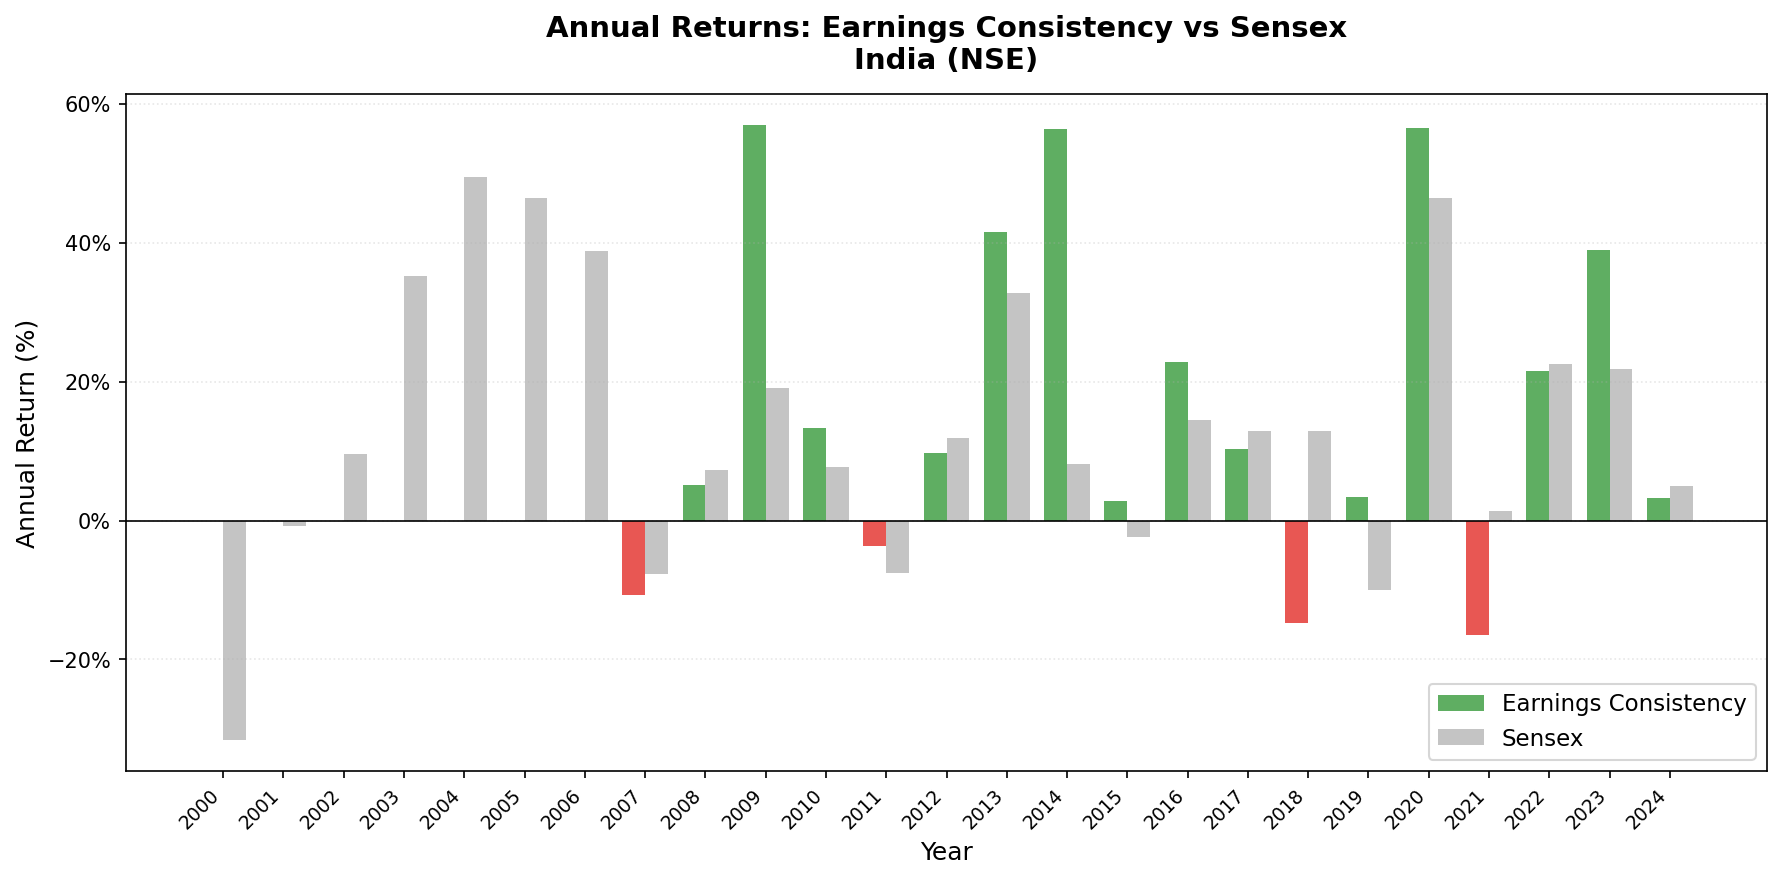
- Annual returns (July-to-July)
- 2007: First invested year shows underperformance
- 2008-2009: Strong absolute returns but mixed vs Sensex
- 2014: The Modi election year
- 2018: The worst year
- Why India Doesn't Beat the Sensex
- Backtest Methodology
- Limitations
- Takeaway
- Part of a Series
Two important caveats before going further. First: the first seven years of the backtest (2000-2006) show no invested periods. NSE data coverage in FMP for that era is insufficient to run the screen. The reported CAGR reflects 18 invested years (2007-2024), not 25. Second: this backtest uses NSE only (not BSE+NSE as in prior studies) to avoid dual-listing bias.
With those caveats stated: the 2007-2024 results are clean. India's equity market was in a secular bull market over this period, and the Sensex outperformed. The earnings consistency filter delivers 10.04% absolute, but the broad market delivered more.
Data: FMP financial data warehouse, 2000–2025. Updated June 2026.
Method
Universe: NSE-listed stocks with market cap > ₹5B, actively trading Period: July 2000 to July 2025 (25 annual periods; 7 uninvested due to data coverage, 18 invested) Rebalancing: Annual, each July. Top 30 by ROE, equal weight. Benchmark: Sensex (BSE Sensex index, INR) Execution: Next-day close (MOC) Cash rule: Hold cash if fewer than 10 stocks qualify. Data: Ceta Research (FMP financial data warehouse, 45-day point-in-time lag)
The Signal
Earnings streak: Net income grew year-over-year in each of the last three fiscal years. Four data points required. All must be positive.
ROE > 8%: Filters for capital efficiency. India has a large number of profitable micro-caps; the ROE screen combined with the MCap threshold keeps the portfolio in investable quality businesses.
D/E < 2.0: Screens out financially distressed or excessively leveraged issuers. Indian infrastructure and public sector enterprises often carry high debt; this filter removes them.
Portfolio: top 30 by ROE descending, equal weight.
The Screen (SQL)
WITH
fy_income AS (
    SELECT symbol, netIncome, dateEpoch,
        ROW_NUMBER() OVER (PARTITION BY symbol ORDER BY dateEpoch DESC) AS rn
    FROM income_statement
    WHERE period = 'FY'
      AND netIncome IS NOT NULL
      AND symbol IN (SELECT DISTINCT symbol FROM profile WHERE exchange IN ('NSE'))
),
streak AS (
    SELECT y1.symbol
    FROM fy_income y1
    JOIN fy_income y2 ON y1.symbol = y2.symbol AND y2.rn = 2
    JOIN fy_income y3 ON y1.symbol = y3.symbol AND y3.rn = 3
    JOIN fy_income y4 ON y1.symbol = y4.symbol AND y4.rn = 4
    WHERE y1.rn = 1
      AND y1.netIncome > y2.netIncome
      AND y2.netIncome > y3.netIncome
      AND y3.netIncome > y4.netIncome
      AND y4.netIncome > 0
)
SELECT
    s.symbol,
    p.companyName,
    p.sector,
    ROUND(k.returnOnEquityTTM * 100, 1) AS roe_pct,
    ROUND(f.debtToEquityRatioTTM, 2)    AS debt_to_equity,
    ROUND(k.marketCap / 1e9, 2)         AS market_cap_b
FROM streak s
JOIN key_metrics_ttm k ON s.symbol = k.symbol
JOIN financial_ratios_ttm f ON s.symbol = f.symbol
JOIN profile p ON s.symbol = p.symbol
WHERE k.returnOnEquityTTM > 0.08
  AND f.debtToEquityRatioTTM >= 0
  AND f.debtToEquityRatioTTM < 2.0
  AND k.marketCap > 5000000000
  AND p.exchange IN ('NSE')
ORDER BY k.returnOnEquityTTM DESC
LIMIT 30
Run this query on Ceta Research
What We Found
Strong absolute returns but underperforms the Sensex.
| Metric | Earnings Consistency | Sensex |
|---|---|---|
| CAGR | 10.04% | 12.06% |
| Excess CAGR | -2.02% | - |
| Sharpe Ratio | 0.162 | - |
| Max Drawdown | -16.6% | - |
| Down Capture | 13.6% | 100% |
| Win Rate (annual vs Sensex) | 48% | - |
| Avg Stocks when invested | 23.4 | - |
| Cash Periods | 7 of 25 (2000-2006) | - |
The strategy's 10.04% CAGR is solid. But India's broad equity market, as measured by the Sensex, delivered 12.06% over the same period. The earnings consistency filter doesn't beat the market in India, it underperforms by about 2% per year. This is the opposite of what we see in Anglo-Saxon markets, where the same filter beats local benchmarks.
Annual returns (July-to-July)
| Year | Portfolio | Sensex | Excess | Note |
|---|---|---|---|---|
| 2000 | 0.0% | -31.6% | +31.6% | Cash (data coverage) |
| 2001 | 0.0% | -0.8% | +0.8% | Cash (data coverage) |
| 2002 | 0.0% | +9.6% | -9.6% | Cash (data coverage) |
| 2003 | 0.0% | +35.2% | -35.2% | Cash (data coverage) |
| 2004 | 0.0% | +49.4% | -49.4% | Cash (data coverage) |
| 2005 | 0.0% | +46.5% | -46.5% | Cash (data coverage) |
| 2006 | 0.0% | +38.9% | -38.9% | Cash (data coverage) |
| 2007 | -10.7% | -7.7% | -3.0% | First invested year |
| 2008 | +5.1% | +7.3% | -2.2% | Both positive in this July-July period |
| 2009 | +57.0% | +19.1% | +37.9% | Strong recovery year |
| 2010 | +13.4% | +7.8% | +5.6% | |
| 2011 | -3.7% | -7.5% | +3.8% | |
| 2012 | +9.7% | +11.9% | -2.2% | |
| 2013 | +41.6% | +32.8% | +8.8% | |
| 2014 | +56.4% | +8.1% | +48.3% | Modi election rally |
| 2015 | +2.8% | -2.4% | +5.2% | |
| 2016 | +22.8% | +14.4% | +8.3% | |
| 2017 | +10.3% | +12.9% | -2.6% | |
| 2018 | -14.7% | +12.9% | -27.6% | Worst miss |
| 2019 | +3.4% | -10.0% | +13.4% | |
| 2020 | +56.5% | +46.4% | +10.1% | COVID recovery |
| 2021 | -16.6% | +1.4% | -18.0% | |
| 2022 | +21.6% | +22.5% | -0.9% | |
| 2023 | +38.9% | +21.8% | +17.1% | |
| 2024 | +3.3% | +5.0% | -1.7% |
2007: First invested year shows underperformance
2007: portfolio -10.7% vs Sensex -7.7% (-3.0% excess). The first year the strategy had enough NSE data to invest immediately showed the filter underperforming the broad market.
2008-2009: Strong absolute returns but mixed vs Sensex
2008 (July 2008 to July 2009): portfolio +5.1% vs Sensex +7.3%. Both positive. This period includes the Oct 2008 crash and the early 2009 recovery. By July 2009, both the earnings portfolio and the Sensex had recovered to slightly positive for the 12-month period. The portfolio underperformed by -2.2%.
2009: +57.0% vs Sensex +19.1% (+37.9% excess). India's recovery year. Companies that had grown earnings consistently entered 2009 with intact balance sheets and accelerated as domestic demand surged and global risk-on flows returned to emerging markets. This is the second-best excess year in the India study vs the Sensex, behind only 2014.
2014: The Modi election year
+56.4% in 2014 vs Sensex +8.1% (+48.3% excess). This was the year Narendra Modi's BJP won a decisive parliamentary majority. Indian equity markets surged. The earnings consistency portfolio participated fully, the +56.4% absolute return is the second-best year in the study (behind 2009's +57.0%). And vs the Sensex, +48.3% excess is the single best relative year in the study.
This is a real result. But it's also a concentration of political risk. A single election outcome created +48% excess in one year.
2018: The worst year
2018: -14.7% vs Sensex +12.9% (-27.6% excess). The single worst miss in the India study. India's equity market suffered from rising US interest rates (which pulled capital from emerging markets), rupee depreciation, and IL&FS Infrastructure's debt crisis. The Sensex still gained +12.9%. The earnings consistency portfolio fell -14.7%. A 28-point gap.
Why India Doesn't Beat the Sensex
The earnings consistency signal delivers 10.04% CAGR but underperforms the Sensex by -2.02% per year. Three structural reasons explain this:
- India's broad bull market. The Sensex itself returned 12.06% per year from 2007-2024 (the invested period). India's equity market as a whole was in a secular bull driven by domestic growth, foreign inflows, and corporate earnings expansion. A quality filter that narrows the universe to consistent earners missed some of the highest-growth companies.
- Growth beats quality in India. Indian markets reward growth more than defensive quality. The Sensex includes high-growth financials, energy, and technology companies whose earnings are lumpy but whose returns are driven by multiple expansion. The earnings consistency filter excludes these companies and selects steady earners: IT services, pharma, FMCG. Those sectors underperformed India's growth sectors over the period.
- High-volatility years favor the Sensex. India's 2004-2006 bull run (cash years for this portfolio but huge for the Sensex), 2018 NBFC resilience (+12.9% Sensex vs -14.7% portfolio), and 2021-2022 recovery all show the Sensex participating in high-amplitude moves that the quality filter missed.
The caveat: the Sharpe of 0.162 is low. The strategy's returns are volatile, and the Sensex's returns were both higher and more consistent over this period. India is the one major market where the earnings consistency filter doesn't add value vs the local benchmark.
Backtest Methodology
| Parameter | Choice |
|---|---|
| Universe | NSE, Market Cap > ₹5B |
| Signal | 3-year net income growth streak, ROE > 8%, D/E < 2.0 |
| Portfolio | Top 30 by ROE, equal weight |
| Rebalancing | Annual (July) |
| Execution | Next-day close (MOC) |
| Cash rule | Hold cash if < 10 qualify |
| Benchmark | Sensex (BSE Sensex index, INR) |
| Period | 2000-2025 (7 cash years: 2000-2006, 18 invested years: 2007-2024) |
| Data lag | Point-in-time, 45-day lag |
Limitations
7 cash periods (2000-2006). The CAGR of 10.04% is computed over all 25 annual periods, but the portfolio was invested in only 18 of them. The 2000-2006 cash years missed India's early bull run (Sensex returned +49.4% in 2004 alone, +46.5% in 2005). This understates the strategy's underperformance vs the Sensex over the full market cycle.
NSE only, not BSE+NSE. This backtest uses NSE-listed stocks only, not both exchanges. BSE was excluded to avoid dual-listing bias (38% of stocks trade on both exchanges). Prior studies used BSE+NSE and showed different results.
Political event concentration. The 2014 +56.4% year reflects the Modi election rally. That single year contributes meaningfully to the multi-year CAGR but is inseparable from political timing.
Emerging market volatility. The Sharpe of 0.162 is low. India's return stream has high standard deviation, and the Sensex delivered better risk-adjusted returns. High absolute return, yes. Risk-adjusted alpha, no.
Takeaway
India's earnings consistency portfolio delivers strong absolute returns (10.04% CAGR) but underperforms the Sensex by -2.02% per year. The strategy doesn't beat the local market. This is the opposite of what we see in Anglo-Saxon markets, where the same filter generates clear alpha.
The defining years tell the story clearly: - Wins: 2014 (+48.3% excess), 2009 (+37.9% excess), 2023 (+17.1%), 2019 (+13.4%) - Losses: 2018 (-27.6% excess), 2021 (-18.0%), 2007 (-3.0%)
The wins are large and infrequent. The losses are equally large. Over 18 invested years, the Sensex delivered higher and more consistent returns.
The earnings consistency filter doesn't work in India the way it works in the US, UK, or Canada. India's broad market rewards growth over quality, and the Sensex, which includes high-growth companies with episodic earnings, outperformed a quality-filtered subset.
Part of a Series
- Earnings Growth Consistency: US Results: 11.55% CAGR, flagship study
- Earnings Growth Consistency: Canada Results: best Sharpe globally
- Earnings Growth Consistency: UK Results: +11.12% vs FTSE 100, highest win rate
- Earnings Growth Consistency: Germany Results: European result
- Earnings Growth Consistency: Global Comparison: 17 exchanges
Data: Ceta Research, FMP financial data warehouse. Universe: NSE. Annual rebalance (July), equal weight (top 30 by ROE), 2000-2025. Benchmark: Sensex (INR). Note: 7 cash periods in 2000-2006 due to data coverage; invested periods are 2007-2024.
Past performance does not guarantee future results. This is educational content, not investment advice.


