
DuPont ROE Across 13 Markets: Where Margin Beats Leverage (and Where It Doesn't)
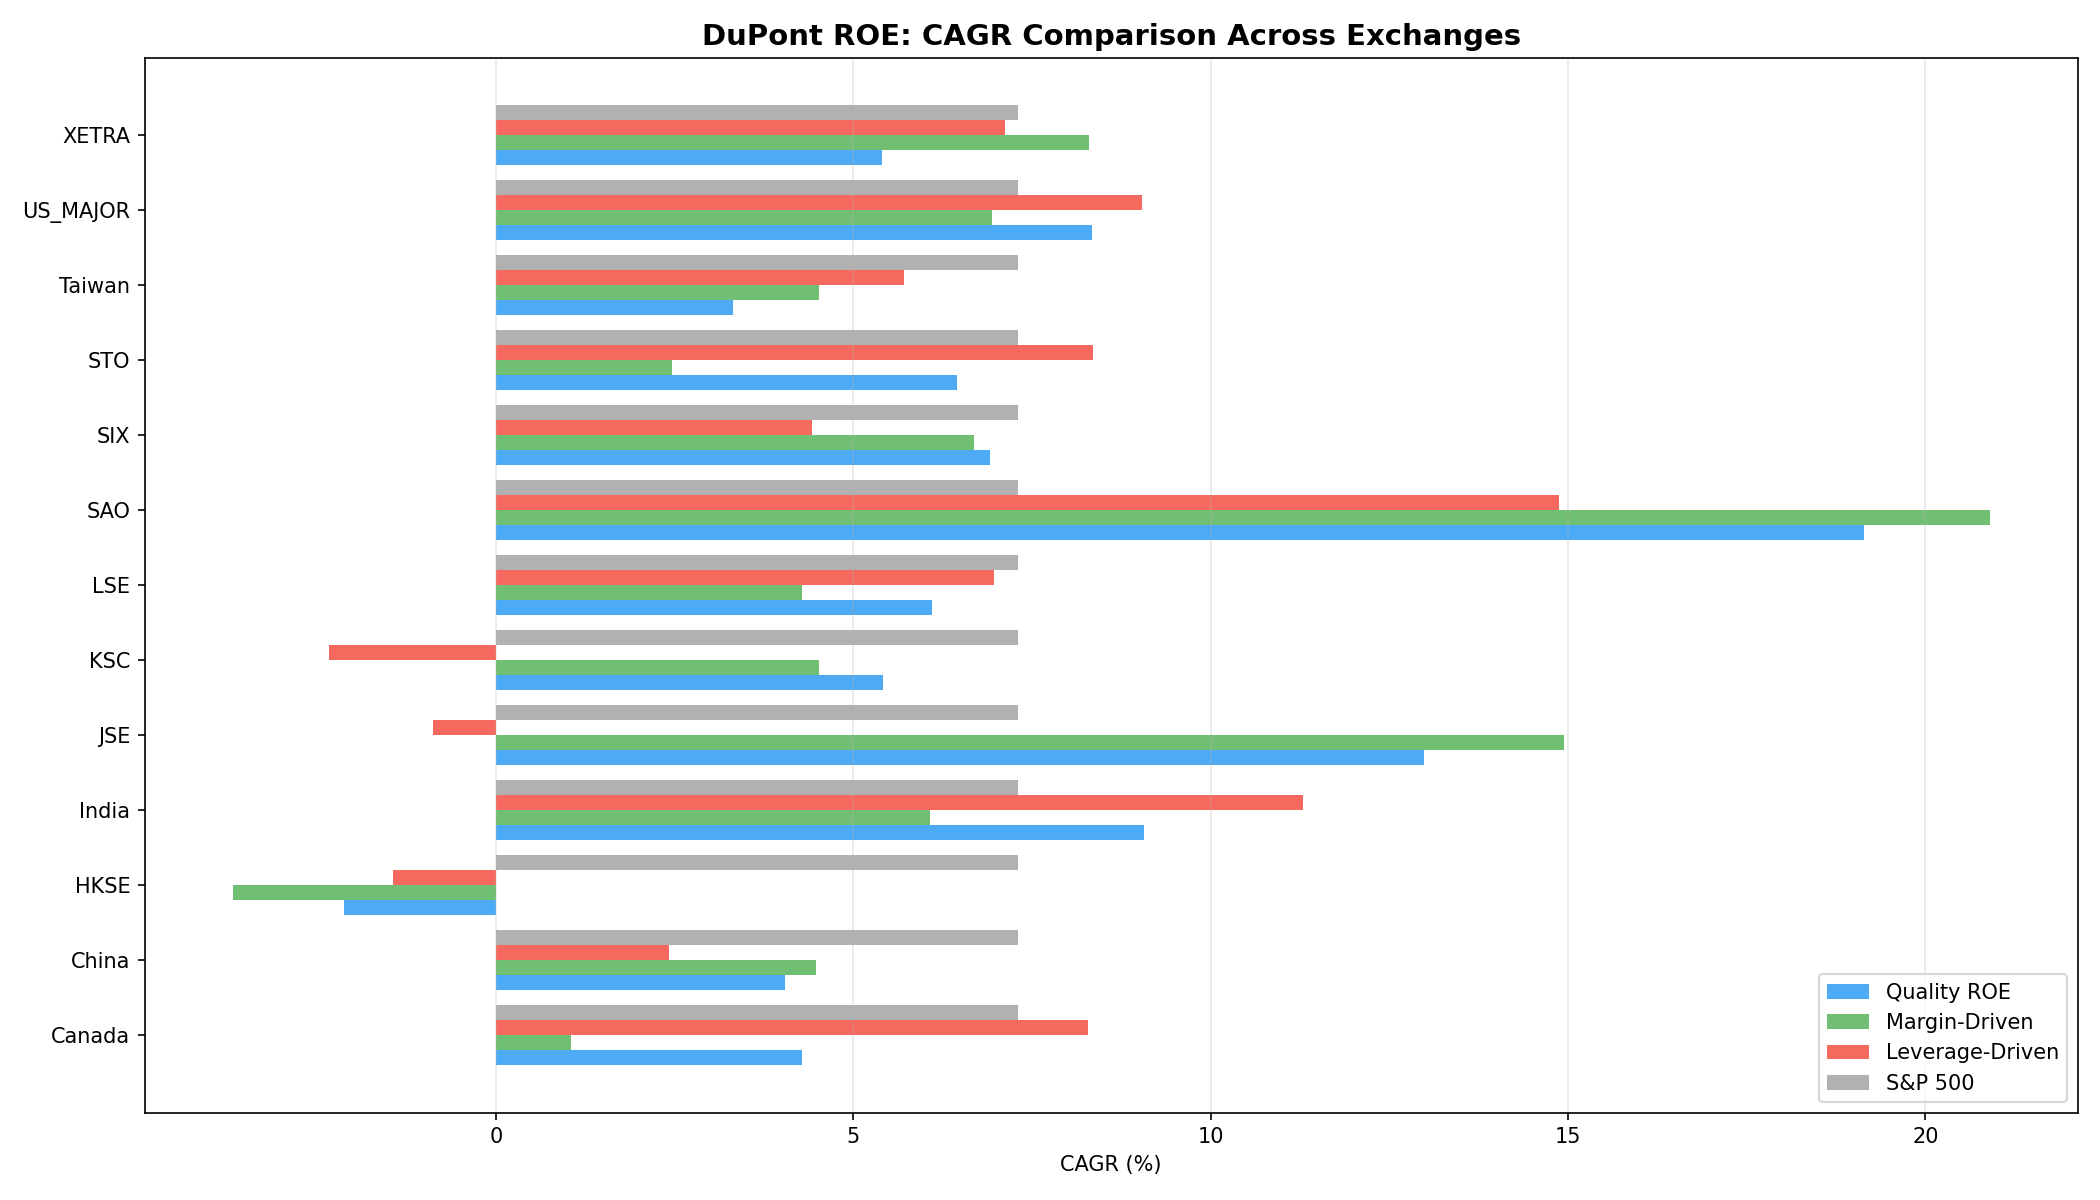
We tested DuPont ROE decomposition across 13 stock markets. Leverage-driven ROE beats margin-driven in 8 of 13 exchanges. Brazil leads with 19.1% Quality ROE CAGR. The margin advantage is market-dependent.

We ran DuPont ROE decomposition on 13 stock exchanges worldwide. Same methodology everywhere: break ROE into margin, turnover, and leverage. Build three portfolios per market (Quality ROE, top-quartile margin, top-quartile leverage). Rebalance annually. Compare.
Contents
- Full Results: All 13 Exchanges
- The Leverage vs Margin Split
- Why the Split Exists
- Quality ROE: The Universal Signal
- The Outliers
- Market Depth and Reliability
- Backtest Methodology
- Limitations
- Part of a Series
- References
The conventional wisdom says margin-driven ROE is higher quality and should outperform leverage-driven ROE. Across 13 markets, that claim holds in only 5 of them. Leverage wins in 8. The margin vs leverage question doesn't have a universal answer. It depends on where you invest.
Quality ROE (high margins, low leverage, ROE > 15%) beat the local benchmark in 11 of 13 markets. That's the more useful finding. India and Hong Kong were the only markets where the quality filter didn't add value over a passive index. Everywhere else, the decomposition works.
Data: FMP financial data warehouse, 2000–2025. Updated March 2026.
Full Results: All 13 Exchanges
| Exchange | Quality ROE CAGR | Margin Q1 CAGR | Leverage Q1 CAGR | M-L Spread | Local Benchmark | Bench CAGR | Excess | Avg Stocks |
|---|---|---|---|---|---|---|---|---|
| Brazil | 19.3% | 19.4% | 15.7% | +3.7% | Bovespa | 8.6% | +10.7% | 12 |
| South Africa | 11.5% | 12.9% | 6.7% | +6.1% | SPY* | 7.3% | +4.2% | 8 |
| India (NSE) | 9.6% | 1.9% | 11.8% | -10.0% | Sensex | 11.5% | -1.9% | 81 |
| US | 8.9% | 7.7% | 9.3% | -1.6% | S&P 500 | 7.3% | +1.5% | 227 |
| Switzerland | 6.6% | 6.5% | 4.0% | +2.5% | SMI | 2.1% | +4.5% | 23 |
| UK | 6.5% | 5.5% | 7.7% | -2.2% | FTSE 100 | 1.2% | +5.3% | 74 |
| Germany | 6.3% | 8.3% | 8.6% | -0.3% | DAX | 4.5% | +1.8% | 53 |
| Sweden | 5.8% | 2.0% | 8.8% | -6.8% | OMX Stockholm | 2.4% | +3.4% | 21 |
| Korea | 5.5% | 3.7% | -2.0% | +5.7% | KOSPI | 4.4% | +1.1% | 18 |
| Canada | 4.6% | 0.6% | 8.9% | -8.3% | TSX Composite | 4.1% | +0.6% | 29 |
| China | 4.6% | 4.5% | 2.6% | +2.0% | SSE Composite | 2.5% | +2.1% | 186 |
| Taiwan | 3.5% | 4.6% | 6.1% | -1.5% | TAIEX | 3.1% | +0.4% | 50 |
| Hong Kong | -1.2% | -0.1% | 2.5% | -2.6% | Hang Seng | 1.3% | -2.4% | 69 |
*South Africa: JSE All Share index not available in FMP data, SPY used as proxy.
Sorted by Quality ROE CAGR. Margin-Leverage Spread (M-L) is positive when margin beats leverage.
The Leverage vs Margin Split
This is the core finding. Leverage-driven ROE beat margin-driven in 8 of 13 markets. Margin won in 5.
Where leverage wins:
| Exchange | Margin CAGR | Leverage CAGR | M-L Spread |
|---|---|---|---|
| India (NSE) | 1.9% | 11.8% | -10.0% |
| Canada | 0.6% | 8.9% | -8.3% |
| Sweden | 2.0% | 8.8% | -6.8% |
| UK | 5.5% | 7.7% | -2.2% |
| Hong Kong | -0.1% | 2.5% | -2.6% |
| US | 7.7% | 9.3% | -1.6% |
| Taiwan | 4.6% | 6.1% | -1.5% |
| Germany | 8.3% | 8.6% | -0.3% |
India shows the widest gap at -10.0%. NSE leverage-driven companies (infrastructure, capital goods, real estate) returned 11.8% annually. Margin-driven stocks (IT services, pharma) delivered just 1.9%. That's a 10-point spread, the largest we've seen. The market priced in the quality premium on margin-driven names to the point where their future returns were minimal.
Canada follows at -8.3%. Canadian high-ROE stocks that lean on leverage (resource companies, REITs, pipeline operators) outperformed margin-driven names substantially. Sweden at -6.8%, driven by leveraged industrials outperforming high-margin names.
Where margin wins:
| Exchange | Margin CAGR | Leverage CAGR | M-L Spread |
|---|---|---|---|
| South Africa | 12.9% | 6.7% | +6.1% |
| Korea | 3.7% | -2.0% | +5.7% |
| Brazil | 19.4% | 15.7% | +3.7% |
| Switzerland | 6.5% | 4.0% | +2.5% |
| China | 4.5% | 2.6% | +2.0% |
South Africa's +6.1% spread shows margin-driven companies won decisively. Margin-driven stocks returned 12.9% annually vs leverage-driven at 6.7%. The JSE's leveraged universe skews toward mining and resources, sectors that struggled over the 25-year period. High-margin stocks (consumer franchises, retailers) were sheltered from global commodity volatility.
Korea's +5.7% margin advantage also stands out. The chaebol structure means leverage-driven Korean stocks tend to be conglomerates with cross-holdings and opaque capital allocation. Leverage-driven companies actually lost -2.0% annually. Markets discount this structure heavily. Margin-driven companies (semiconductor, consumer electronics) earned 3.7%, modest but positive.
Why the Split Exists
The margin-vs-leverage outcome isn't random. Three factors predict which side wins in a given market.
1. Interest rate environment. In markets where corporate borrowing costs are low relative to return on assets, leverage works. The US, UK, Canada, and Sweden all had long periods of cheap corporate debt. Companies that borrowed and deployed capital earned the spread. In markets with higher or more volatile rates (South Africa, Brazil to some extent), leverage carries real cost and real risk.
2. Sector composition. Markets dominated by capital-light, high-margin industries (Korea's semiconductor sector, South Africa's consumer franchises) naturally reward margin-driven ROE. Markets with capital-intensive, leveraged industries (Canada's pipelines, India's infrastructure) reward leverage.
3. Market depth. Small universes amplify outliers. South Africa (11 stocks), Korea (19), and Switzerland (28) are thin enough that a few companies can drive the entire result. The US (231 stocks), India (165), and China (190) produce more statistically robust signals.
Quality ROE: The Universal Signal
Regardless of the margin-vs-leverage split, Quality ROE (combining both filters) was positive in 11 of 13 markets. Only Hong Kong (-2.1%) and South Africa's leverage portfolio (not Quality ROE itself, which returned 13.0%) produced negative results.
This makes Quality ROE the more deployable signal. You don't need to predict whether margin or leverage will dominate in a given market. The combined filter works almost everywhere.
The top five Quality ROE markets:
| Exchange | Quality ROE CAGR | Excess vs Local | Avg Stocks |
|---|---|---|---|
| Brazil | 19.3% | +10.7% | 12 |
| South Africa | 11.5% | +4.2%* | 8 |
| India (NSE) | 9.6% | -1.9% | 81 |
| US | 8.9% | +1.5% | 227 |
| Switzerland | 6.6% | +4.5% | 23 |
Brazil's 19.3% is the highest, but with only 12 stocks on average, the result is highly concentrated. India returned 9.6% with 81 stocks but trailed the Sensex by 1.9% per year, so passive exposure won there. The US offers the deepest universe at 227 stocks with +1.5% excess vs SPY. If you want statistical confidence behind your Quality ROE allocation, the US is the market with enough breadth to trust. Switzerland and UK also show strong excess returns (+4.5% and +5.3%) but with thinner universes.
The Outliers
Brazil (19.3% Quality ROE, +10.7% vs Bovespa). The headline number is real but concentrated. Only 12 qualifying stocks per year. Brazil's high nominal interest rates and volatile macro environment mean that companies which achieve ROE > 15% with balanced quality are genuinely exceptional. The filter selects for the best operators in a tough capital environment. The Bovespa returned just 8.6% over the same period.
India (-1.9% vs Sensex). The only large-universe market where Quality ROE trailed the local index. The NSE Sensex returned 11.5% while Quality ROE returned 9.6%. Margin-driven stocks collapsed to just 1.9% CAGR. The market priced in the quality premium on IT services and pharma to the point where their returns disappeared. Leverage-driven names (infrastructure, industrials) captured India's growth cycle at 11.8% annually, roughly matching the Sensex.
Hong Kong (-2.4% vs Hang Seng). One of two markets where Quality ROE trailed the local index. Hong Kong's property-heavy economy means filtering for low leverage removes much of the market. Quality ROE returned -1.2% vs Hang Seng at +1.3%. Leverage-driven stocks actually returned +2.5%, the only DuPont track that beat the benchmark.
Korea (+5.7% margin advantage). Korean leverage-driven stocks lost -2.0% annually. The chaebol discount is severe enough that even ROE > 15% leveraged companies underperform on an absolute basis. Margin-driven companies earned 3.7%, modest but positive. Quality ROE beat KOSPI by +1.1%.
Market Depth and Reliability
We should be honest about where the numbers are trustworthy and where they're not.
| Tier | Exchanges | Avg Stocks | Confidence |
|---|---|---|---|
| High | US, China | 186-227 | Strong |
| Medium | India (NSE), UK, Hong Kong, Taiwan | 50-81 | Moderate |
| Low | Germany, Canada, Switzerland, Sweden, Korea, Brazil, South Africa | 8-53 | Directional only |
The US and China produce enough qualifying stocks every year that the results reflect genuine factor behavior. India dropped from 165 to 81 stocks after excluding BSE (removed due to duplication), moving it to medium tier. The medium-tier markets have enough depth for reasonable conclusions but are sensitive to outlier years. The low-tier markets are useful as directional evidence. South Africa's +6.1% spread on 8 stocks per year and Brazil's +10.7% excess on 12 stocks should be treated as interesting patterns, not actionable signals.
Backtest Methodology
- Data: FMP financial data accessed via Ceta Research warehouse. Price data from
stock_eod(adjusted closes). - Point-in-time: Annual financials with standard filing lag. April rebalancing.
- DuPont decomposition: Net profit margin, asset turnover, equity multiplier (1 + D/E) from
financial_ratios. - Quality ROE filter: ROE > 15%, net profit margin > 8%, equity multiplier < 3.0.
- Quartile portfolios: Margin Q1 = top quartile by net profit margin. Leverage Q1 = top quartile by equity multiplier. Both restricted to ROE > 15%.
- Market cap thresholds: Exchange-specific minimums. $1B for US, scaled for other markets.
- Exclusions: Financial Services and Utilities removed from all exchanges.
- Transaction costs: Not modeled. Annual turnover is low.
Limitations
Small universes. South Africa (11 stocks), Brazil (18), and Korea (19) are too thin for high-confidence conclusions. The extreme spreads in these markets could be driven by a handful of companies.
Currency effects. All returns in local currency. For international investors, FX movements can dominate factor returns in smaller markets.
Transaction costs. Not modeled. Less liquid markets (South Africa, Brazil, Korea) would see higher implementation costs.
Sector composition drives results. The DuPont decomposition in concentrated economies often ends up being a sector bet. South Africa's margin advantage is really "consumer over mining." Canada's leverage advantage is really "energy/pipelines over everything else." The signal may be sector exposure, not factor exposure.
No risk-free rate adjustment. Sharpe ratios use a flat USD rate for comparability. Markets with high local rates (Brazil, South Africa, India) would show lower risk-adjusted returns on a local basis.
Part of a Series
- DuPont ROE: US Stocks (8.86% CAGR, +1.5% vs SPY)
- DuPont ROE: India NSE (9.56% CAGR, trailed Sensex)
- DuPont ROE: UK (6.45% CAGR, +5.3% vs FTSE 100)
References
- Soliman, M. (2008). The Use of DuPont Analysis by Market Participants. The Accounting Review.
- Fairfield, P., & Yohn, T. (2001). Using Asset Turnover and Profit Margin to Forecast Changes in Profitability. Review of Accounting Studies.
Data: Ceta Research (FMP financial data warehouse), 2000-2025. Full methodology: backtests/METHODOLOGY.md
Past performance does not guarantee future results. This is educational content, not investment advice.


