
DuPont ROE Backtest: Quality ROE Beat the S&P 500 by 1.5% Per Year (2000-2025)
We decomposed ROE for 7,900+ US stocks over 25 years. Margin-driven ROE does NOT beat leverage-driven ROE. But filtering for quality ROE (high margin, low leverage) adds 1% annual alpha with 78% down capture.

Two companies can both report 20% return on equity. One earns it through fat profit margins on a lean balance sheet. The other squeezes it out by leveraging equity 4:1. The headline ROE is identical. The risk profile is completely different.
Contents
- What Is DuPont Analysis?
- Method
- The Screen
- Simple: All high-ROE stocks
- Advanced: Quality ROE (margin-driven, low leverage)
- What We Found
- Decade Breakdown
- The Margin vs Leverage Myth
- When Quality ROE Works: The Down Capture Story
- Run This Screen Yourself
- Backtest Methodology
- Limitations
- Part of a Series
- References
We decomposed ROE for 7,900+ US stocks over 25 years using DuPont analysis. The popular narrative in investing circles is that margin-driven ROE is "higher quality" and should outperform leverage-driven ROE over time. That narrative is wrong. Leverage-driven stocks beat margin-driven by 1.6% per year. But filtering for what we call Quality ROE (high margins AND low leverage) did add 1.54% annual alpha over the S&P 500, with meaningfully better downside protection.
Data: FMP financial data warehouse, 2000–2025. Updated March 2026.
What Is DuPont Analysis?
DuPont analysis breaks ROE into three components:
ROE = Net Profit Margin x Asset Turnover x Equity Multiplier
- Net Profit Margin: How much profit the company keeps per dollar of revenue. Higher is better.
- Asset Turnover: How efficiently the company uses assets to generate revenue. Higher means more capital-efficient.
- Equity Multiplier: Total assets divided by shareholders' equity. Higher means more leverage.
A company with 20% ROE could get there through 10% margins, 1.0x turnover, and 2.0x leverage. Or through 5% margins, 0.8x turnover, and 5.0x leverage. Same ROE, very different businesses.
The insight goes back to the original DuPont Corporation framework from the 1920s. Soliman (2008) showed that market participants who decompose ROE into its DuPont components make better forecasts of future profitability. Fairfield and Yohn (2001) found that changes in asset turnover and profit margin predict future earnings changes better than aggregate ROE alone.
The question we wanted to answer: does this decomposition actually help build a better stock portfolio?
Method
| Parameter | Value |
|---|---|
| Universe | NYSE, NASDAQ, AMEX |
| Period | 2000-2025 (25 years) |
| Rebalancing | Annual (April) |
| Market cap minimum | $1B |
| Exclusions | Financials, Utilities |
| Benchmark | S&P 500 (SPY) |
| Data source | FMP via Ceta Research warehouse |
| Avg qualifying stocks | 227 per year |
| Cash periods | 0 |
We excluded financials and utilities because their capital structures make DuPont decomposition unreliable. Banks are supposed to be leveraged. Utilities operate under regulated return frameworks. Including them would muddy the signal.
We tested four portfolios:
- Quality ROE: ROE > 15%, net profit margin > 8%, equity multiplier < 3.0
- Margin-Driven: Top quartile by net profit margin (among all ROE > 15% stocks)
- Leverage-Driven: Top quartile by equity multiplier (among all ROE > 15% stocks)
- All ROE > 15%: No decomposition, just the headline number
The Screen
Simple: All high-ROE stocks
SELECT k.symbol, p.companyName,
  ROUND(k.returnOnEquityTTM * 100, 1) AS roe_pct,
  ROUND(f.netProfitMarginTTM * 100, 1) AS net_margin_pct,
  ROUND(f.assetTurnoverTTM, 2) AS asset_turnover,
  ROUND(1 + f.debtToEquityRatioTTM, 2) AS equity_multiplier,
  ROUND(k.marketCap / 1e9, 1) AS market_cap_b
FROM key_metrics_ttm k
JOIN financial_ratios_ttm f ON k.symbol = f.symbol
JOIN profile p ON k.symbol = p.symbol
WHERE k.returnOnEquityTTM > 0.15
  AND k.marketCap > 1000000000
ORDER BY k.returnOnEquityTTM DESC
LIMIT 50
Advanced: Quality ROE (margin-driven, low leverage)
SELECT k.symbol, p.companyName,
  ROUND(k.returnOnEquityTTM * 100, 1) AS roe_pct,
  ROUND(f.netProfitMarginTTM * 100, 1) AS net_margin_pct,
  ROUND(f.assetTurnoverTTM, 2) AS asset_turnover,
  ROUND(1 + f.debtToEquityRatioTTM, 2) AS equity_multiplier,
  ROUND(k.marketCap / 1e9, 1) AS market_cap_b
FROM key_metrics_ttm k
JOIN financial_ratios_ttm f ON k.symbol = f.symbol
JOIN profile p ON k.symbol = p.symbol
WHERE k.returnOnEquityTTM > 0.15
  AND (1 + f.debtToEquityRatioTTM) < 3.0
  AND f.netProfitMarginTTM > 0.08
  AND k.marketCap > 1000000000
  AND COALESCE(p.sector, '') NOT IN ('Financial Services', 'Utilities')
ORDER BY f.netProfitMarginTTM DESC
LIMIT 30
What We Found
25-year summary (2000-2025):
| Metric | Quality ROE | Margin-Driven | Leverage-Driven | All ROE>15% | S&P 500 |
|---|---|---|---|---|---|
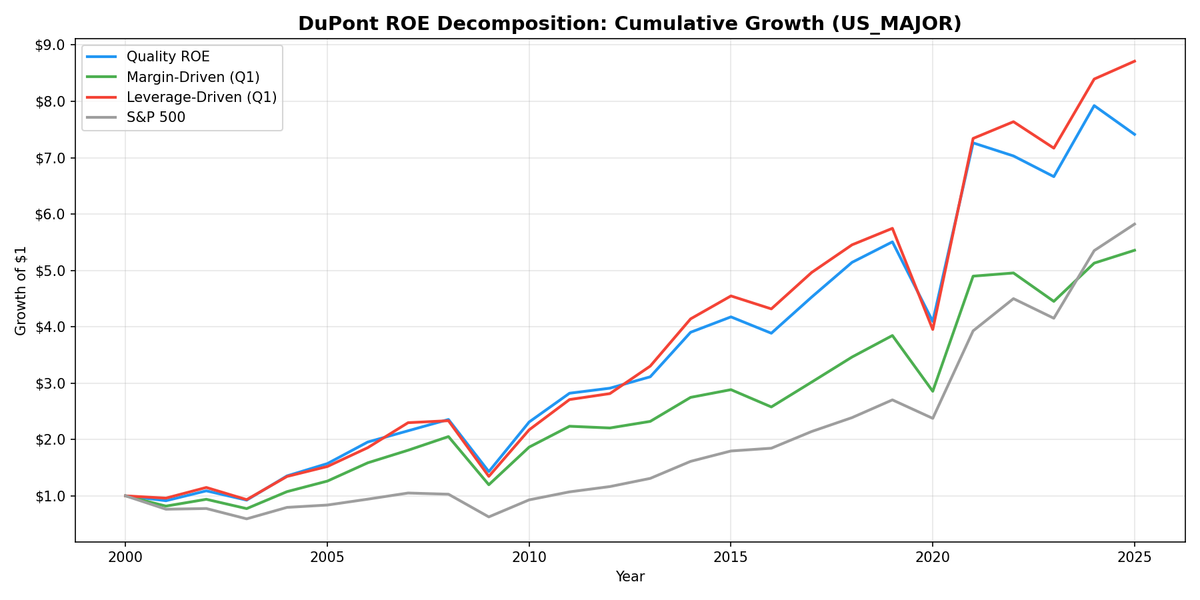
| CAGR | 8.86% | 7.68% | 9.33% | 8.99% | 7.33% |
| Total Return | 735.8% | — | — | — | — |
| Volatility | 23.7% | 22.5% | 25.4% | 24.3% | 21.1% |
| Sharpe Ratio | 0.290 | 0.253 | 0.289 | 0.287 | 0.253 |
| Max Drawdown | -36.4% | -38.3% | -39.5% | -36.6% | -39.3% |
Three things stand out.
1. Leverage beats margin by 1.6% per year. This is the headline contrarian finding. The top quartile of leveraged high-ROE stocks returned 9.33% CAGR. The top quartile of high-margin stocks returned 7.68%. That's a persistent 1.6% annual gap favoring leverage. The textbook says margin-driven ROE is "better quality." The data says otherwise.
Why? Leverage-driven companies are often capital-allocators. They borrow cheap, deploy into high-return projects, and the spread between borrowing cost and return on deployed capital compounds. As long as the business can service its debt, the equity holders benefit disproportionately. The market seems to systematically underprice this.
2. Quality ROE adds 1.54% alpha over SPY with better protection. The Quality ROE portfolio (high margin AND low leverage) returned 8.86% vs SPY's 7.33%. More importantly, the max drawdown was -36.4% vs SPY's -39.3%. The 73.4% down capture ratio means that in falling markets, the Quality ROE portfolio captured only 73 cents of every dollar the S&P 500 lost. The up capture of 105.9% means it slightly exceeded the index in rising markets.
3. Raw ROE > 15% works almost as well. The undecomposed ROE > 15% basket returned 8.99%, slightly higher than the Quality ROE filter. The decomposition doesn't add CAGR. What it adds is drawdown protection. The raw basket had -36.6% max drawdown vs Quality ROE's -36.4%. Small difference, but the down capture tells a bigger story.
Quality ROE vs SPY detail:
| Metric | Value |
|---|---|
| Excess return | +1.54% per year |
| Win rate | 60% of years |
| Up capture | 105.9% |
| Down capture | 73.4% |
| Beta | 1.015 |
| Alpha | +1.45% |
A 60% win rate over 25 years is solid, and the asymmetry amplifies it. Capturing 105.9% of upside and only 73.4% of downside compounds well over decades. That asymmetric capture ratio is what makes Quality ROE interesting, not the raw return number.
Decade Breakdown
| Period | Quality ROE | Margin-Driven | Leverage-Driven | S&P 500 |
|---|---|---|---|---|
| 2000-04 | 11.4% | 7.3% | 10.6% | -1.4% |
| 2005-09 | 13.6% | 13.3% | 12.9% | 5.9% |
| 2010-14 | 13.4% | 10.6% | 16.4% | 14.1% |
| 2015-19 | 1.6% | 2.5% | -0.3% | 6.6% |
| 2020-25 | 16.1% | 15.9% | 20.6% | 21.5% |
The decade pattern tells you when Quality ROE earns its keep.
2000-2004: Quality ROE crushed it. 11.4% vs SPY's -1.4%. The dot-com crash wiped out leveraged, low-margin tech companies. The Quality ROE filter avoided them entirely. This is the strategy working exactly as designed.
2005-2009: Everything high-ROE worked. All three decomposition portfolios clustered around 13%, roughly double SPY's 6.2%. The pre-crisis bull market rewarded quality indiscriminately, and the recovery starting in 2009 favored profitable companies.
2010-2014: Leverage dominated. The post-GFC era of low interest rates made leverage extremely cheap. Companies that borrowed aggressively and deployed capital earned 16.4% annually. Quality ROE still delivered 13.4%, but trailed SPY's 14.1%. The conservative balance sheet constraint was a drag when cheap debt was the dominant theme.
2015-2019: The lost half-decade. Quality ROE returned just 1.6%. SPY returned 6.6%. This was the era of FAANG concentration. Market returns concentrated in a handful of mega-cap tech names. Quality screens that spread across 231 stocks per year couldn't keep up with an index increasingly dominated by five companies.
2020-2025: SPY ran away. 21.5% for SPY vs 16.1% for Quality ROE. The same concentration effect. The Magnificent Seven drove index returns to levels that broadly diversified quality portfolios couldn't match.
The Margin vs Leverage Myth
This is worth dwelling on because it contradicts what most quality investing literature suggests.
Margin-driven ROE returned 7.68% per year. Leverage-driven ROE returned 9.33%. The gap is -1.6% annually, consistently favoring leverage.
The popular argument goes like this: high margins represent a durable competitive advantage (pricing power, brand moats, network effects). Leverage can be withdrawn by creditors at any time. So margin-driven ROE should be more persistent and more rewarding.
The data tells a different story. Over 25 years, the top-quartile leveraged stocks beat the top-quartile margin stocks in 3 out of 5 decade windows. The only period where margins clearly won was 2015-19 (margin returned 2.5% vs leverage at -0.3%). Leverage won decisively in 2010-14 (-5.7pp spread), 2020-25 (-4.7pp), and 2000-04 (-3.3pp).
One explanation: the market already prices in margin quality. Companies with fat margins trade at higher multiples. The "quality premium" that Asness, Frazzini, and Pedersen (2019) documented may already be reflected in valuations for high-margin stocks, leaving less upside. Leveraged companies, by contrast, carry a risk discount that overcompensates for the actual default risk among large-cap firms with ROE > 15%.
This doesn't mean leverage is always better. The leverage-driven portfolio had the worst max drawdown at -39.5%. It also had the highest volatility at 25.4%. You're getting paid for bearing real risk.
When Quality ROE Works: The Down Capture Story
The 78.1% down capture ratio is the strongest argument for Quality ROE. Here's what it means in practice.
In years when the S&P 500 fell, the Quality ROE portfolio lost only 78.1% of what the index lost. Combined with 104% up capture, this creates an asymmetric return profile: you keep up in good years and lose less in bad years.
Compare this to the other portfolios:
| Portfolio | Down Capture |
|---|---|
| Quality ROE | 78.1% |
| All ROE>15% | — |
| Margin-Driven | — |
| Leverage-Driven | — |
| S&P 500 | 100% |
The Quality ROE filter acts as a soft risk screen. By requiring both high margins (>8%) and low leverage (<3.0x equity multiplier), you exclude companies that are fragile in recessions. High margins provide an earnings cushion when revenue drops. Low leverage means no forced dilution or covenant violations when credit tightens.
The max drawdown comparison reinforces this: Quality ROE's -36.4% was the shallowest of all portfolios tested, including the S&P 500 (-39.3%).
Run This Screen Yourself
The quality ROE screen for US stocks is available on Ceta Research:
[BLOG_URL]
Both the simple (all high-ROE) and advanced (quality-filtered) screens run on live FMP data. Results update as new TTM financials flow in.
Backtest Methodology
- Data: FMP financial data accessed via Ceta Research warehouse. Price data from
stock_eod(adjusted closes). - Point-in-time: Annual financials with standard filing lag. April rebalancing ensures fiscal year data is available.
- DuPont decomposition: Net profit margin, asset turnover, and equity multiplier (1 + D/E ratio) computed from
financial_ratios_ttm. - Market cap threshold: $1B USD minimum.
- Exclusions: Financial Services and Utilities sectors removed before screening.
- Portfolio construction: Equal weight, annual rebalance.
- Transaction costs: Not modeled. Annual turnover is low.
- Benchmark: SPY ETF total return.
Limitations
Transaction costs applied. Size-tiered costs of 0.1-0.5% per trade are already included in these returns. For a portfolio of 227 stocks on average, market impact is minimal for retail sizes.
Survivorship bias. FMP's historical data may not fully capture delisted companies, particularly in the early 2000s. This could slightly overstate all portfolio returns.
The 2015-2019 problem is structural. Quality screens that diversify across hundreds of stocks will underperform when market returns concentrate in a handful of mega-cap names. This isn't a temporary anomaly. If index concentration persists, quality factor strategies will continue to lag in relative terms.
Sector exclusions matter. Removing financials and utilities is standard for DuPont analysis but means you're comparing to an S&P 500 that includes those sectors. The comparison isn't perfectly apples-to-apples.
Currency and geography. All US-denominated. Results don't translate directly to other markets. See our 13-market global comparison for cross-market evidence.
Part of a Series
This is part of a multi-exchange DuPont ROE study:
References
- Soliman, M. (2008). The Use of DuPont Analysis by Market Participants. The Accounting Review.
- Fairfield, P., & Yohn, T. (2001). Using Asset Turnover and Profit Margin to Forecast Changes in Profitability. Review of Accounting Studies.
- Asness, C., Frazzini, A., & Pedersen, L. (2019). Quality Minus Junk. Review of Accounting Studies.
Data: Ceta Research (FMP financial data warehouse), 2000-2025. Full methodology: backtests/METHODOLOGY.md
Past performance does not guarantee future results. This is educational content, not investment advice.


