
DuPont ROE on Taiwanese Stocks: Marginal +0.43% Over TAIEX (25-Year Backtest)
DuPont ROE decomposition on TAI+TWO from 2000-2025. Quality ROE returned just 3.30% CAGR with 25.1% volatility and -58.7% max drawdown. All tracks trail SPY (7.30%). Taiwan's tech-heavy export economy resists DuPont quality screening.


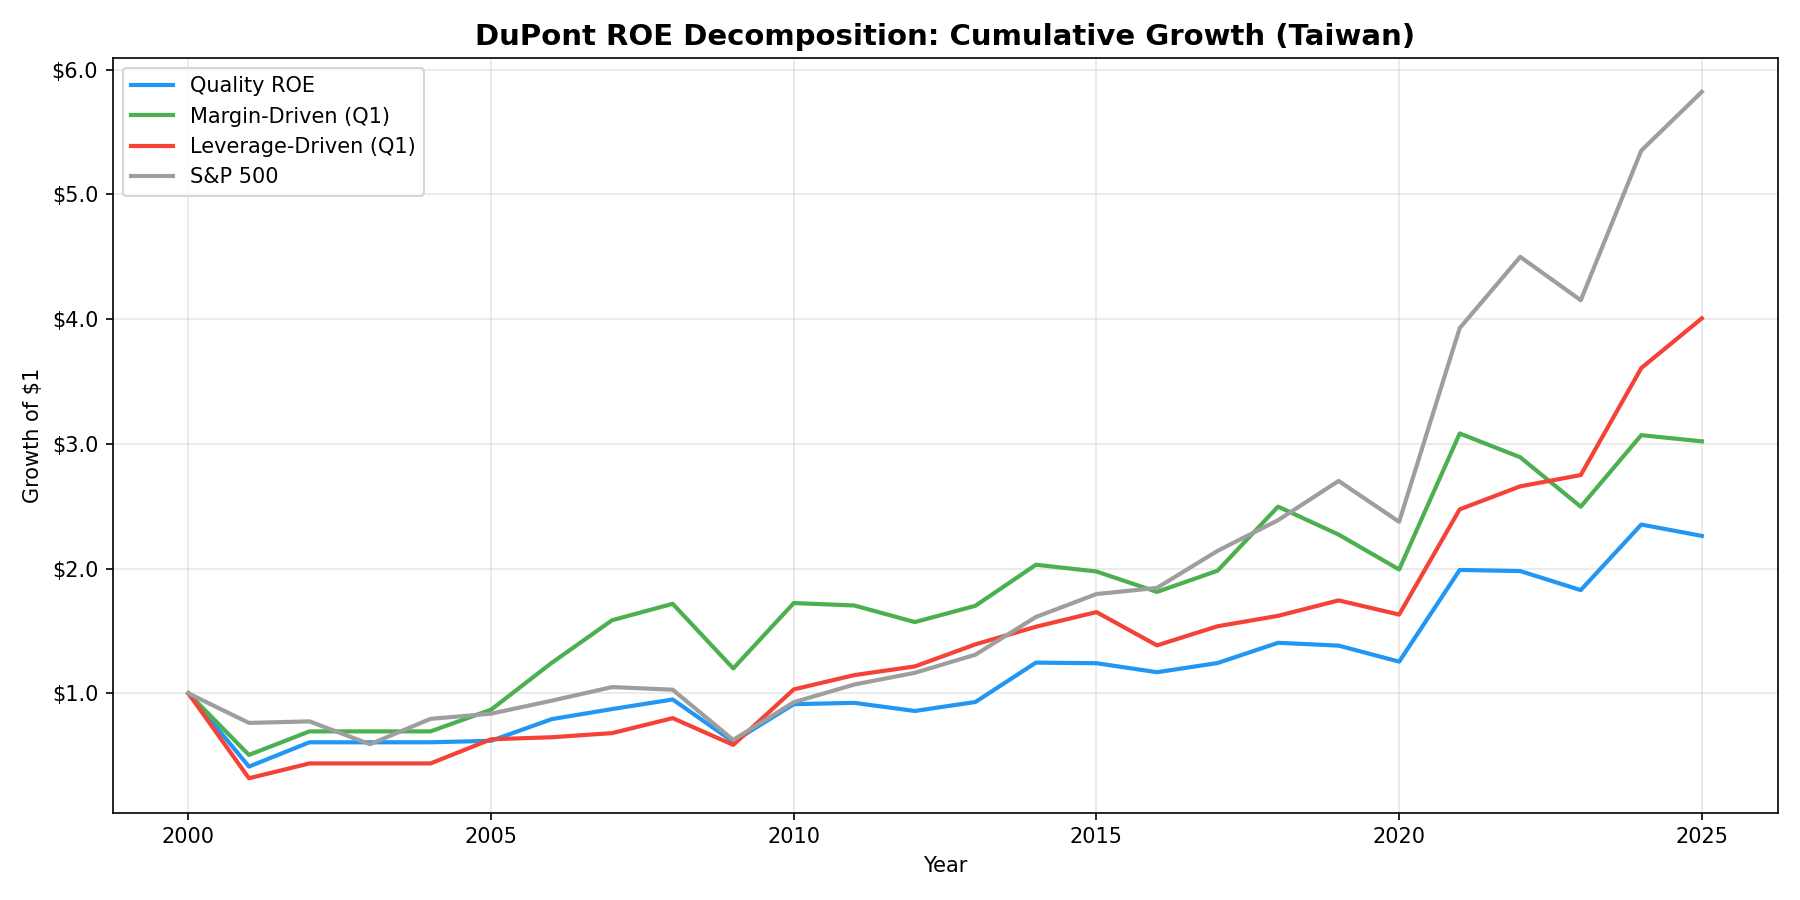
We decomposed ROE into margin, turnover, and leverage for every qualifying stock on Taiwan's TAI and TWO exchanges from 2000 to 2025. Quality ROE returned 3.48% CAGR against a TAIEX benchmark of 3.05%, a marginal +0.43% excess return. Margin-driven hit 4.59%. Leverage-driven reached 6.12%. The unfiltered ROE > 15% bucket managed 5.18%.
Contents
- Method
- What is DuPont Analysis?
- The Screen
- What We Found
- A thin margin advantage over the local index. Quality ROE edges TAIEX by +0.43%.
- Why Taiwan resists DuPont quality screening
- Annual returns
- Backtest Methodology
- Limitations
- Takeaway
- Part of a Series
- References
Taiwan's tech-heavy, export-driven economy produces only marginal alpha from DuPont quality screening. The excess return is real but thin. Against the local benchmark, quality ROE barely edges ahead.
For the full DuPont methodology, decomposition logic, and US results, see our US DuPont ROE analysis.
Data: FMP financial data warehouse, 2000–2025. Updated March 2026.
Method
| Parameter | Value |
|---|---|
| Universe | TAI + TWO (TWSE + TPEx), market cap > NT$10B (~$312M) |
| Exclusions | Financials, utilities |
| Period | 2000-2025 (25 years) |
| Rebalancing | Annual (April, 45-day filing lag) |
| Holding period | 12 months |
| Portfolio size | Equal weight, top 30 per group |
| Transaction costs | 0.15% per trade |
| Benchmark | TAIEX (Taiwan Stock Exchange Weighted Index) |
| Cash rule | Hold cash if fewer than 10 qualifying stocks |
| Data source | Ceta Research (FMP financial data warehouse) |
DuPont components were calculated from annual financial statements. Stocks with ROE above 15% were classified into margin-driven (top quartile net margin) or leverage-driven (top quartile equity multiplier). The Quality ROE portfolio required both decent margins and controlled leverage. Two periods went to cash early in the sample when fewer than 10 stocks qualified.
What is DuPont Analysis?
ROE measures net income per dollar of shareholder equity. A company reporting 20% ROE generates $20 for every $100 of equity. Sounds straightforward. But two companies can hit that number through completely different paths.
DuPont breaks ROE into three drivers:
ROE = Net Profit Margin x Asset Turnover x Equity Multiplier
- Net Profit Margin (Net Income / Revenue): How much of each revenue dollar becomes profit. TSMC runs around 25-30%. A typical electronics OEM runs 3-5%.
- Asset Turnover (Revenue / Total Assets): How hard the assets work. Asset-light services companies score high. Capital-intensive semiconductor fabs score lower.
- Equity Multiplier (Total Assets / Shareholders' Equity): Leverage. Higher numbers mean more debt in the capital structure.
Taiwan makes this decomposition especially interesting. The economy is dominated by semiconductor and electronics companies where capital intensity, cyclical margins, and global supply chain dynamics make ROE composition volatile and hard to predict.
The Screen
-- DuPont Quality Screen: Taiwan (TAI + TWO)
-- Margin-driven ROE stocks
SELECT
    k.symbol,
    p.companyName,
    p.sector,
    k.returnOnEquityTTM * 100 AS roe_pct,
    f.netProfitMarginTTM * 100 AS net_margin_pct,
    f.assetTurnoverTTM,
    (1 + f.debtToEquityRatioTTM) AS equity_multiplier,
    k.marketCap / 1e9 AS market_cap_b_twd
FROM key_metrics_ttm k
JOIN financial_ratios_ttm f ON k.symbol = f.symbol
JOIN profile p ON k.symbol = p.symbol
WHERE k.returnOnEquityTTM > 0.15
  AND (1 + f.debtToEquityRatioTTM) < 3.0
  AND f.netProfitMarginTTM > 0.08
  AND k.marketCap > 10000000000
  AND p.exchange IN ('TAI', 'TWO')
  AND p.sector NOT IN ('Financial Services', 'Utilities')
  AND p.isActivelyTrading = true
ORDER BY f.netProfitMarginTTM DESC
LIMIT 30
The market cap threshold of NT$10B (~$312M) screens out micro-caps. The exchange filter targets both the main board (TAI) and the over-the-counter market (TWO). Financials and utilities are excluded as with all our DuPont backtests.
What We Found
A thin margin advantage over the local index. Quality ROE edges TAIEX by +0.43%.
| Portfolio | CAGR | Volatility | Max Drawdown | vs TAIEX |
|---|---|---|---|---|
| Leverage-Driven ROE > 15% | 6.12% | -- | -- | +3.07% |
| All ROE > 15% | 5.18% | -- | -- | +2.13% |
| Margin-Driven ROE > 15% | 4.59% | -- | -- | +1.54% |
| Quality ROE (combined) | 3.48% | 25.1% | -58.7% | +0.43% |
| TAIEX | 3.05% | -- | -- | -- |
The margin-leverage spread is -1.5%. Leverage-driven stocks won at 6.12% vs margin-driven at 4.59%. That gap points in the same direction as the UK: markets with export-oriented, capital-intensive industries tend to reward leverage over margins.
Against the local TAIEX benchmark (3.05% CAGR over 25 years), the numbers look different than when measured against SPY. Quality ROE at 3.48% does beat the index, but by only 43 basis points. That's a real but marginal advantage. Quality ROE had 25.1% annualized volatility and a -58.7% maximum drawdown. Those risk numbers are harsh for a 3.48% return. Two periods went to cash in the early years (2000-2001) when the qualifying universe was too thin. With an average of about 50 stocks per period, the screen runs tight on Taiwan's smaller exchange.
Why Taiwan resists DuPont quality screening
Semiconductor cyclicality breaks margin persistence. TSMC might run 30% margins in a boom year and 20% during a downturn. The suppliers and foundry customers cycling around it see even wider swings. When a company's margin is driven by the global semiconductor cycle rather than structural competitive advantage, the DuPont decomposition captures a snapshot that doesn't predict next year's margins.
Small qualifying universe. Roughly 50 stocks per period pass the quality ROE filter. Compare that to ~190 in China or ~200 in the US. A thin universe means higher concentration risk. A few semiconductor names that happen to be at the top of their margin cycle can dominate the portfolio, then mean-revert the following year.
Export dependency compresses local signals. Taiwanese companies are deeply tied to global demand for electronics and semiconductors. When Apple, Nvidia, or Qualcomm adjust orders, it flows directly through Taiwanese supply chains. Company-level quality signals from DuPont decomposition get drowned out by macro demand cycles that originate outside Taiwan.
Two cash periods. The early years (around 2000-2001) had too few qualifying stocks, forcing the portfolio into cash. This drags the CAGR but also reveals a data limitation: FMP coverage of Taiwanese fundamentals is thinner in the early period.
Annual returns
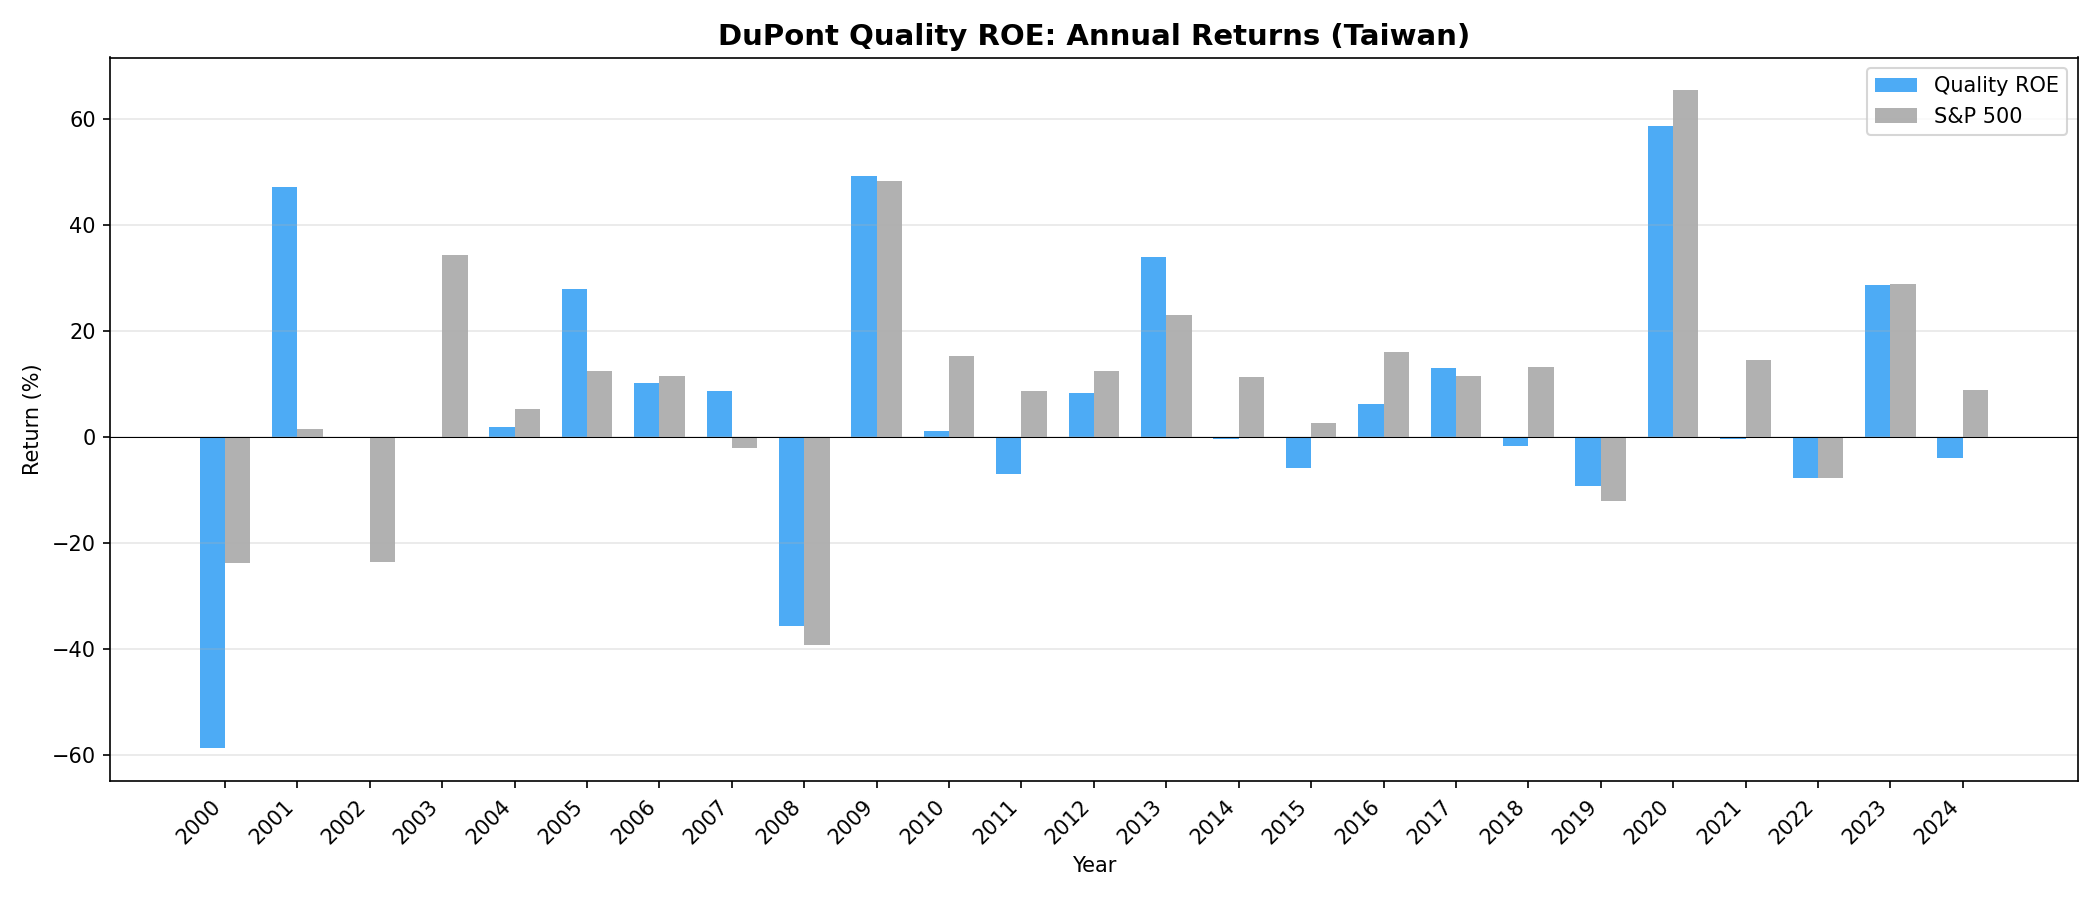
The annual pattern shows the semiconductor cycle clearly. Big up years align with global tech demand peaks. Down years align with inventory corrections and demand slumps. The DuPont decomposition adds only marginal selection value on top of what you'd get from simply holding a Taiwan ETF. The quality screen beats TAIEX, but narrowly.
Backtest Methodology
| Parameter | Choice |
|---|---|
| Universe | TAI + TWO, market cap > NT$10B (~$312M), excl. financials/utilities |
| Signal | DuPont decomposition from annual FY data |
| Classification | Top quartile net margin within ROE > 15% = margin-driven. Top quartile equity multiplier within ROE > 15% = leverage-driven |
| Quality ROE | ROE > 15%, equity multiplier < 3.0, net margin > 8% |
| Rebalance | Annual (April, 45-day lag after fiscal year end) |
| Holding period | 12 months |
| Portfolio size | Equal weight, top 30 per group |
| Transaction costs | 0.15% per trade |
| Cash rule | Hold cash if fewer than 10 qualifying stocks |
| Cash periods | 2 (early years, thin data) |
| Survivorship bias | Mitigated via point-in-time financial data |
| Look-ahead bias | 45-day lag on all fundamental data |
| Benchmark | TAIEX (Taiwan Stock Exchange Weighted Index) |
| Avg stocks (Quality ROE) | ~50 per period |
Limitations
Semiconductor concentration. Taiwan's stock market is dominated by the semiconductor supply chain. TSMC alone accounts for a massive share of total market capitalization. Even after excluding it from the top-30 portfolio (if it doesn't qualify), the remaining tech and electronics companies move in sympathy with the semiconductor cycle. Sector diversification is structurally limited.
Thin universe. About 50 qualifying stocks per period, with two periods going to cash. This creates higher concentration risk and makes the CAGR more sensitive to individual stock outcomes than in deeper markets.
Cyclical margin distortion. Margins in semiconductor and electronics manufacturing swing with the global demand cycle. A company at 15% margin during a boom may drop to 8% during a correction. The annual April rebalance captures one snapshot. Companies classified as "margin-driven" at rebalance may lose that status within months.
Export-driven correlation. Most large Taiwanese companies derive significant revenue from exports. This creates high correlation with global tech demand and reduces the diversification benefit of holding multiple names from the same exchange.
Currency effects. Returns are in TWD. The TWD/USD exchange rate has been relatively stable but still adds a currency dimension for international investors. The TAIEX benchmark is also in TWD, so currency risk doesn't affect the relative comparison.
Early-period data gaps. FMP coverage of Taiwanese stocks is sparser before 2003-2004. The two cash periods reflect this limitation. Effective backtest history is closer to 22-23 years than the full 25.
Market cap threshold effect. At NT$10B (~$312M), the threshold is relatively high for Taiwan's market. Lowering it would increase the universe but introduce liquidity concerns.
Takeaway
Taiwan is one of the harder markets we've tested for DuPont ROE decomposition. Quality ROE returned 3.48% against TAIEX at 3.05%. A +0.43% excess return is real but narrow. It doesn't justify the active risk. The margin-driven portfolio at 4.59% was better. Leverage-driven at 6.12% was the strongest result, though still modest in absolute terms.
The benchmark context matters here. Taiwan's TAIEX itself returned only 3.05% CAGR over 25 years. That's a low bar. The DuPont screen clears it, but barely. Against that backdrop, the honest takeaway is that quality screening adds marginal value in Taiwan, not the decisive alpha it generates in Brazil or the US.
The core issue: DuPont analysis works best in markets with diverse sector composition and structurally persistent margins. Taiwan's semiconductor cycle dominates returns. Margins swing with global demand. Company-level DuPont signals are modest compared to the macro-driven forces that actually move Taiwanese equities.
For Taiwan, investors seeking more than marginal alpha are better served by sector-aware strategies or direct tech exposure than by a quality screen that assumes margin persistence in a cyclical market.
Part of a Series
This analysis is part of our DuPont ROE global exchange comparison: - DuPont ROE on US Stocks -- 14.2% margin-driven CAGR, full methodology - DuPont ROE on Chinese Stocks -- modest margin advantage, +2.07% vs SSE Composite - DuPont ROE on UK Stocks -- +5.30% excess vs FTSE 100, leverage wins at 7.70% CAGR
References
- Soliman, M.T. (2008). "The Use of DuPont Analysis by Market Participants." The Accounting Review, 83(3), 823-853.
- Fairfield, P.M. and Yohn, T.L. (2001). "Using Asset Turnover and Profit Margin to Forecast Changes in Profitability." Review of Accounting Studies, 6(4), 371-385.
- Lam, F.Y., Wang, S. and Wei, K.C.J. (2020). "The Profitability Premium: Macroeconomic Risks or Expectation Errors?" Financial Analysts Journal, 76(2), 54-70.
Data: Ceta Research (FMP financial data warehouse), 2000-2025. Annual April rebalance, equal weight top 30, 0.15% transaction costs. Past performance is not indicative of future results.
Past performance does not guarantee future results. This is educational content, not investment advice.


