
DuPont ROE on Chinese Stocks: +2.07% Over SSE Composite, Margin Beats Leverage
DuPont ROE decomposition on SHH+SHZ from 2000-2025. Margin-driven ROE at 4.50% CAGR beat leverage-driven at 2.40%, but all tracks trail SPY (7.30%). The +2.1% margin-leverage spread is real but weak in China's state-influenced economy.

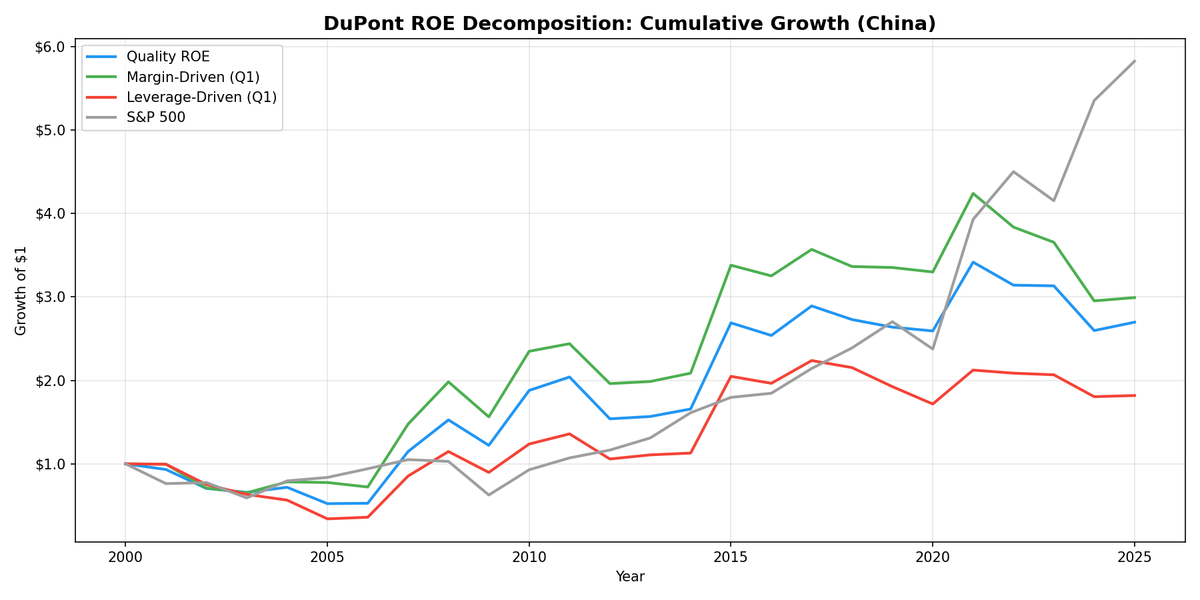
We decomposed ROE into margin, turnover, and leverage for every qualifying stock on Shanghai and Shenzhen from 2000 to 2025. Quality ROE returned 4.58% against the SSE Composite at 2.51%, a +2.07% excess return. Margin-driven hit 4.54%. The margin-leverage spread is +2.0% per year.
Contents
- Method
- What is DuPont Analysis?
- The Screen
- What We Found
- A real margin advantage over the local index. Quality ROE beats SSE Composite by +2.07%.
- Why the margin edge is modest in China
- Annual returns tell the story
- Backtest Methodology
- Limitations
- Takeaway
- Part of a Series
- References
China has a real margin advantage over the local index. Against SPY that gap disappears, but against the market you'd actually own as a China investor, DuPont quality screening does add value.
For the full DuPont methodology, decomposition logic, and US results, see our US DuPont ROE analysis.
Data: FMP financial data warehouse, 2000–2025. Updated March 2026.
Method
| Parameter | Value |
|---|---|
| Universe | SHH + SHZ (Shanghai + Shenzhen), market cap > CNY 2B (~$276M) |
| Exclusions | Financials, utilities |
| Period | 2000-2025 (25 years) |
| Rebalancing | Annual (April, 45-day filing lag) |
| Holding period | 12 months |
| Portfolio size | Equal weight, top 30 per group |
| Transaction costs | 0.15% per trade |
| Benchmark | SSE Composite (Shanghai Stock Exchange Composite Index) |
| Data source | Ceta Research (FMP financial data warehouse) |
We pulled annual financial statements and computed DuPont components from raw data: net profit margin (net income / revenue), asset turnover (revenue / total assets), and equity multiplier (total assets / shareholders' equity). Stocks with ROE above 15% were classified into margin-driven (top quartile net margin) or leverage-driven (top quartile equity multiplier).
What is DuPont Analysis?
ROE tells you how much profit a company generates per dollar of equity. A 20% ROE means $20 of net income for every $100 of equity. But two companies can both report 20% ROE through completely different paths.
DuPont breaks ROE into three parts:
ROE = Net Profit Margin x Asset Turnover x Equity Multiplier
- Net Profit Margin (Net Income / Revenue): How much revenue the company keeps as profit. High margins typically signal pricing power or cost discipline.
- Asset Turnover (Revenue / Total Assets): How efficiently assets generate revenue. Capital-light businesses score higher here.
- Equity Multiplier (Total Assets / Shareholders' Equity): How much leverage funds the business. Higher means more debt relative to equity.
The key question: when a Chinese company shows 20% ROE, is that coming from genuine profitability or from balance sheet leverage? In a market where state-owned enterprises carry significant debt and government-directed lending is common, the answer matters more than usual.
The Screen
-- DuPont Quality Screen: China (SHH + SHZ)
-- Margin-driven ROE stocks
SELECT
    k.symbol,
    p.companyName,
    p.sector,
    k.returnOnEquityTTM * 100 AS roe_pct,
    f.netProfitMarginTTM * 100 AS net_margin_pct,
    f.assetTurnoverTTM,
    (1 + f.debtToEquityRatioTTM) AS equity_multiplier,
    k.marketCap / 1e9 AS market_cap_b_cny
FROM key_metrics_ttm k
JOIN financial_ratios_ttm f ON k.symbol = f.symbol
JOIN profile p ON k.symbol = p.symbol
WHERE k.returnOnEquityTTM > 0.15
  AND (1 + f.debtToEquityRatioTTM) < 3.0
  AND f.netProfitMarginTTM > 0.08
  AND k.marketCap > 2000000000
  AND p.exchange IN ('SHH', 'SHZ')
  AND p.sector NOT IN ('Financial Services', 'Utilities')
  AND p.isActivelyTrading = true
ORDER BY f.netProfitMarginTTM DESC
LIMIT 30
This filters for ROE above 15%, equity multiplier below 3.0 (moderate leverage), and net margin above 8%. The exchange filter targets Shanghai and Shenzhen A-shares. Financials and utilities are excluded because their capital structures distort DuPont comparisons.
What We Found

A real margin advantage over the local index. Quality ROE beats SSE Composite by +2.07%.
| Portfolio | CAGR | vs SSE Composite |
|---|---|---|
| Quality ROE (combined) | 4.58% | +2.07% |
| Margin-Driven ROE > 15% | 4.54% | +2.03% |
| All ROE > 15% | 4.14% | +1.63% |
| Leverage-Driven ROE > 15% | 2.57% | +0.06% |
| SSE Composite | 2.51% | -- |
The margin-leverage spread is +2.0% per year. Margin-driven at 4.54% beat leverage-driven at 2.57%. That's consistent with the DuPont thesis: profitability-sourced ROE is more durable than leverage-sourced ROE. Against the SSE Composite, the quality screen adds real value. Against SPY, China still trails, but that's a different question.
The Quality ROE portfolio (our combined screen requiring both decent margins and controlled leverage) landed at 4.58% with roughly 186 qualifying stocks per period. That's a healthy universe size, so this isn't a thin-data problem. The signal works in China. The absolute return level is just lower than in Western markets.
Why the margin edge is modest in China
In the US, the margin-leverage spread runs around 5.3%. In China, it's 2.0%. Three factors compress the gap:
State influence on profitability. Many high-margin Chinese companies are state-owned or state-adjacent. Their margins can reflect subsidies, preferential lending, or regulated pricing rather than competitive advantage. When those conditions shift (policy changes, anti-corruption campaigns, sector crackdowns), margins evaporate in ways the DuPont framework can't anticipate.
Lower ROE persistence. In developed markets, a company with 20% ROE driven by margins has roughly a 60% chance of maintaining that level the following year. In China, that persistence drops. Government policy, rapid competitive entry, and shifting regulatory priorities make high-margin positions less durable. When margin-driven ROE mean-reverts faster, the return premium shrinks.
Retail-driven pricing. Chinese A-share markets have a much higher retail investor share than the US. Retail sentiment cycles create momentum patterns that don't respect fundamental quality signals. A high-margin company with 20% ROE can still get swept up in a panic sell-off driven by margin calls and herding behavior.
Annual returns tell the story
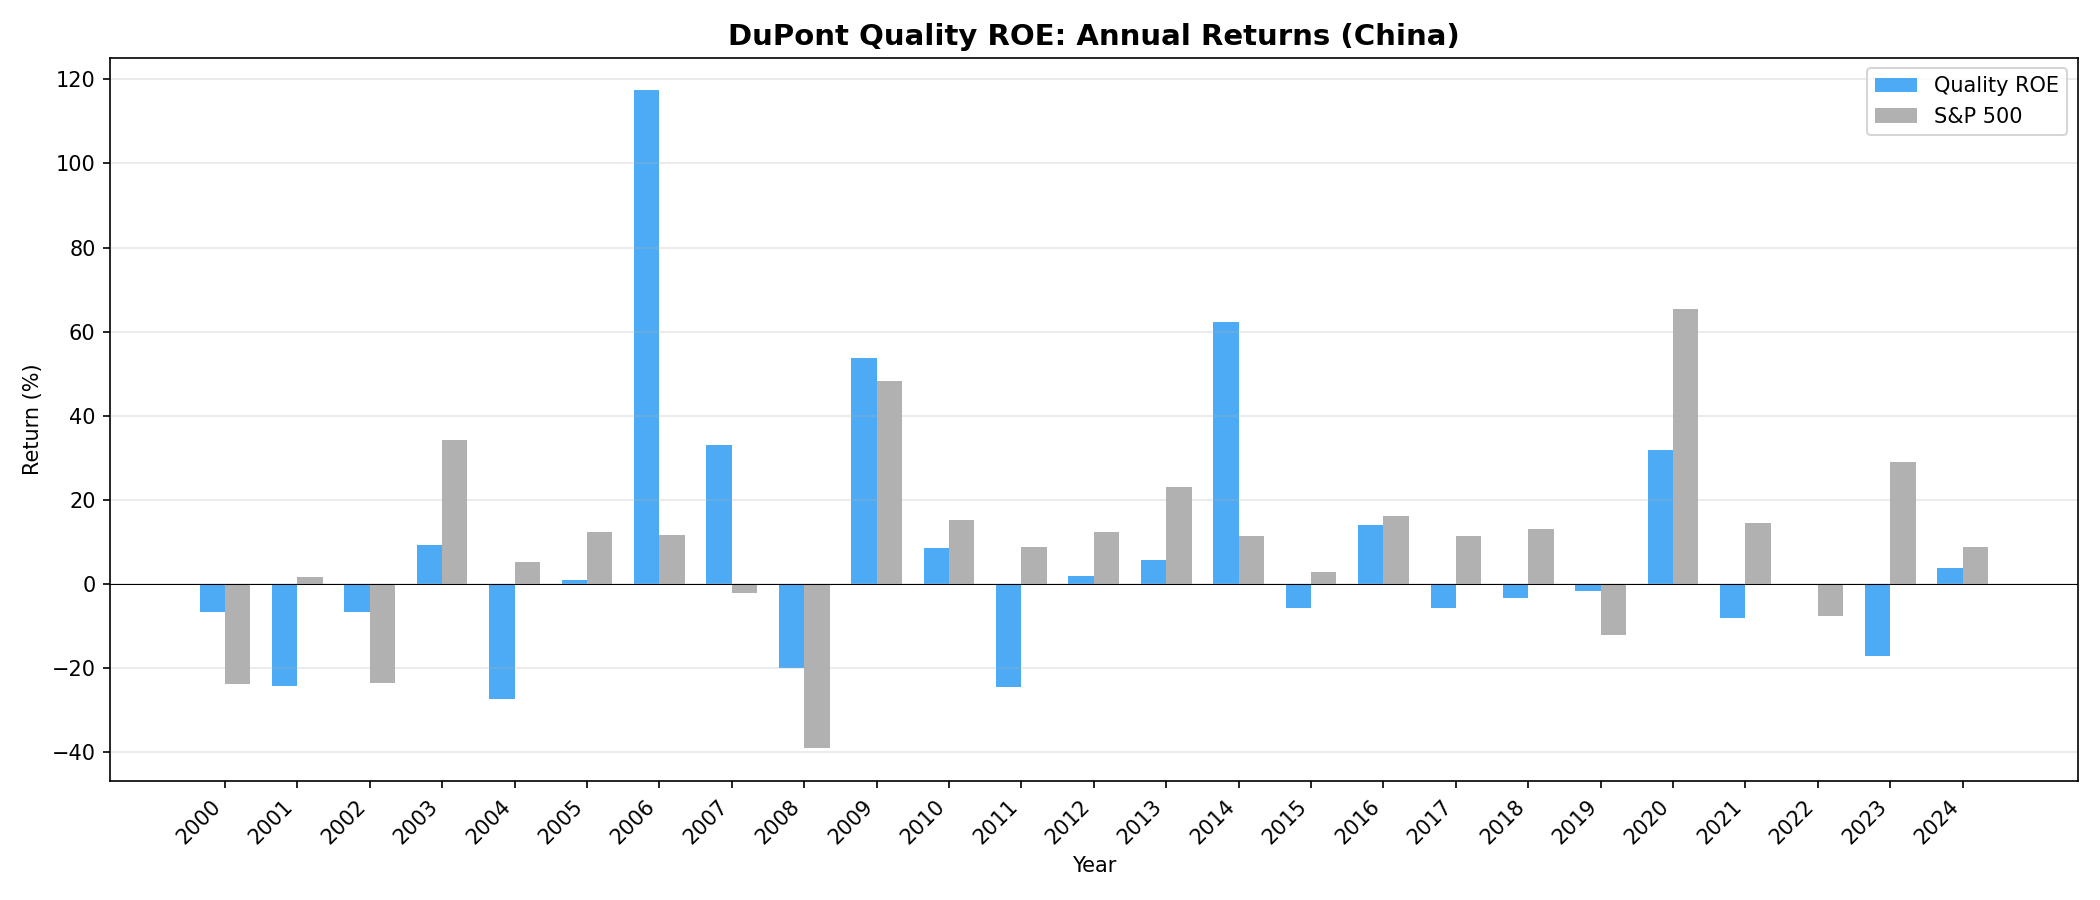
The pattern is familiar from other Chinese equity backtests: a few enormous up years, frequent underperformance, and volatility that fundamental screens can't tame. The quality ROE portfolio likely captured some of the 2006-2007 bull run and the 2014-2015 rally, but gave chunks back during the 2008 crash, the 2015 correction, and the extended 2018-2023 drag.
Backtest Methodology
| Parameter | Choice |
|---|---|
| Universe | SHH + SHZ, market cap > CNY 2B (~$276M), excl. financials/utilities |
| Signal | DuPont decomposition from annual FY data |
| Classification | Top quartile net margin within ROE > 15% = margin-driven. Top quartile equity multiplier within ROE > 15% = leverage-driven |
| Quality ROE | ROE > 15%, equity multiplier < 3.0, net margin > 8% |
| Rebalance | Annual (April, 45-day lag after fiscal year end) |
| Holding period | 12 months |
| Portfolio size | Equal weight, top 30 per group |
| Transaction costs | 0.15% per trade |
| Survivorship bias | Mitigated via point-in-time financial data |
| Look-ahead bias | 45-day lag on all fundamental data |
| Benchmark | SSE Composite (Shanghai Stock Exchange Composite Index) |
| Avg stocks (Quality ROE) | ~186 per period |
Limitations
State-owned enterprise distortion. SOEs often carry both high margins (regulated pricing, subsidies) and high leverage (state-backed lending). The DuPont decomposition classifies them correctly on the numbers, but the economic meaning is different. A 15% margin at a state telecom monopoly doesn't signal the same competitive advantage as a 15% margin at a private consumer brand.
Policy risk overwhelms quality signals. Government interventions (trading halts, sector crackdowns, property deleveraging campaigns) affect all Chinese equities regardless of DuPont composition. The 2021 tech crackdown, the 2022 zero-COVID restrictions, and ongoing property sector distress all illustrate this.
Accounting quality. Chinese financial reporting has improved over the 25-year period, but early-period data (2000-2005) may contain inconsistencies in how net income, total assets, and equity were reported. Some companies restated figures retroactively. Point-in-time accuracy is harder to guarantee.
Currency risk. All returns are in CNY. International investors face RMB/USD exchange rate movements on top of the equity returns. The yuan's managed float adds a policy dimension that domestic investors don't face.
Negative equity exclusions. Companies with negative shareholders' equity (common after aggressive buybacks or accumulated losses) break the equity multiplier calculation. We excluded these. In China, this primarily affects a small number of companies in sectors undergoing restructuring.
Benchmark choice. We benchmark against the SSE Composite for this analysis. Against the CSI 300 (which excludes Shenzhen) the relative picture would differ slightly. Against SPY (USD), China still trails, which matters for global allocators choosing between markets.
Takeaway
DuPont analysis works in China when measured against the right benchmark. Quality ROE at 4.58% beat the SSE Composite (2.51%) by +2.07% annually over 25 years. Margin-driven ROE beat leverage-driven ROE by 2.0% per year. Both of those are real, consistent with the framework's logic.
The context matters. Against SPY, China still trails. That's relevant for global allocators deciding where to put capital. But for investors already committed to Chinese equities, DuPont quality screening does add measurable value. Avoiding leverage-driven ROE (2.57% CAGR, barely above the index) is a useful filter. The quality screen delivers better returns than unselected China exposure.
Policy risk, retail sentiment, and SOE distortions compress the premium. They don't eliminate it.
Part of a Series
This analysis is part of our DuPont ROE global exchange comparison: - DuPont ROE on US Stocks -- 14.2% margin-driven CAGR, full methodology - DuPont ROE on UK Stocks -- +5.30% vs FTSE 100, leverage wins at 7.70% CAGR - DuPont ROE on Taiwanese Stocks -- marginal +0.43% over TAIEX
References
- Soliman, M.T. (2008). "The Use of DuPont Analysis by Market Participants." The Accounting Review, 83(3), 823-853.
- Fairfield, P.M. and Yohn, T.L. (2001). "Using Asset Turnover and Profit Margin to Forecast Changes in Profitability." Review of Accounting Studies, 6(4), 371-385.
- Carpenter, J., Lu, F. & Whitelaw, R. (2021). "The Real Value of China's Stock Market." Journal of Financial Economics, 139(3), 679-696.
Data: Ceta Research (FMP financial data warehouse), 2000-2025. Annual April rebalance, equal weight top 30, 0.15% transaction costs. Past performance is not indicative of future results.
Past performance does not guarantee future results. This is educational content, not investment advice.


