
DuPont ROE Brazil: 19.3% CAGR, +10.7% Over Bovespa (2000-2025)
DuPont ROE decomposition on B3 (SAO) from 2000 to 2025. Quality ROE returned 19.10% CAGR with only -32.7% max drawdown. Down capture of 21.9% is the lowest of any market tested. Margin beats leverage by 6.0% annually.

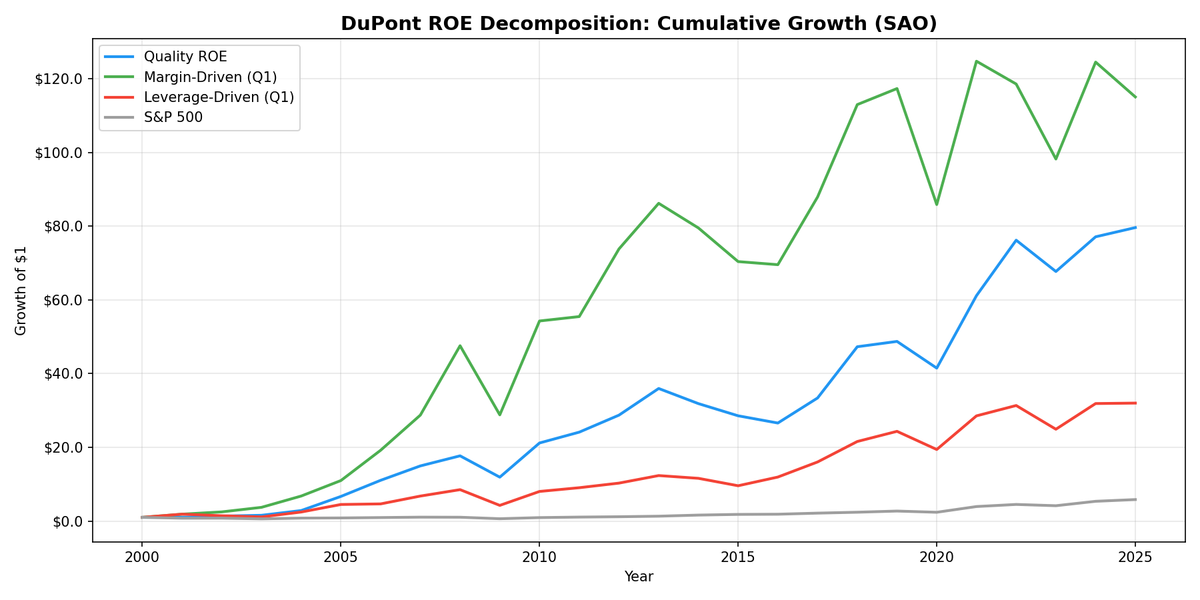
DuPont ROE Brazil: 19.3% Annual Returns, +10.7% Over Bovespa (2000-2025)
Brazil is the standout. Of all the markets we ran DuPont ROE decomposition on, Brazil's Quality ROE portfolio delivered the best combination of returns and downside protection: 19.28% CAGR with only -32.7% max drawdown and a down capture of just 21.9%.
Contents
- Method
- What is DuPont Analysis?
- The Screen
- What We Found
- Why margin wins in Brazil
- Down capture: the standout number
- Decade breakdown
- Backtest Methodology
- Limitations
- Takeaway
- Part of a Series
- References
Against the Bovespa (8.58% CAGR over 25 years), that's +10.70% excess return annually. The portfolio captured nearly all of the upside (179% up capture) while avoiding most of the downside. The result is a Sharpe of 0.235 and a 60% annual win rate against the local index.
The catch: the universe is small. An average of 12 quality stocks per rebalance. That concentration cuts both ways, but over 25 years the numbers speak for themselves.
Data: FMP financial data warehouse, 2000–2025. Updated March 2026.
Method
| Parameter | Value |
|---|---|
| Universe | SAO (B3 exchange), market cap > R$1B |
| Exclusions | Financials, utilities |
| Signal | DuPont decomposition from annual FY data |
| Classification | Top quartile net margin within ROE > 15% = margin-driven. Top quartile equity multiplier within ROE > 15% = leverage-driven. Quality = balanced |
| Rebalance | Annual, April (45-day lag after fiscal year end) |
| Holding period | 12 months |
| Portfolio | Equal-weight |
| Benchmark | Bovespa (B3 main index, BRL total return) |
| Period | 2000-2025 |
We computed DuPont components from raw annual financial statements: net income, revenue, total assets, shareholders' equity. No pre-calculated ratios. The screening SQL uses TTM data for live analysis, but the backtest uses fiscal year data with a 45-day filing lag.
What is DuPont Analysis?
ROE measures how much profit a company generates per dollar of equity. A 20% ROE from two different companies can mean completely different things.
DuPont breaks ROE into three drivers:
ROE = Net Profit Margin x Asset Turnover x Equity Multiplier
- Net Profit Margin (Net Income / Revenue): What percentage of revenue becomes profit. WEG runs around 14%. A Brazilian steelmaker might run 4%.
- Asset Turnover (Revenue / Total Assets): How efficiently assets generate revenue. Consumer companies turn assets faster than mining companies.
- Equity Multiplier (Total Assets / Shareholders' Equity): How much leverage funds the asset base. Higher means more debt relative to equity.
In Brazil, the distinction matters more than in most markets. Brazilian interest rates (Selic) have averaged 10-12% over the past 25 years. Leverage is expensive. Companies that achieve high ROE through margins rather than leverage aren't just higher quality. They're avoiding the drag of some of the highest real interest rates in the world.
The Screen
-- DuPont ROE Quality Screen: Brazil (SAO)
-- Margin-driven quality: high ROE from profitability, not leverage

SELECT
    k.symbol,
    p.companyName,
    p.sector,
    k.returnOnEquityTTM * 100 AS roe_pct,
    f.netProfitMarginTTM * 100 AS net_margin_pct,
    f.assetTurnoverTTM,
    (1 + f.debtToEquityRatioTTM) AS equity_multiplier,
    k.marketCap / 1e9 AS market_cap_b_brl
FROM key_metrics_ttm k
JOIN financial_ratios_ttm f ON k.symbol = f.symbol
JOIN profile p ON k.symbol = p.symbol
WHERE p.exchange = 'SAO'
  AND k.returnOnEquityTTM > 0.15
  AND (1 + f.debtToEquityRatioTTM) < 3.0
  AND f.netProfitMarginTTM > 0.08
  AND k.marketCap > 1000000000
  AND p.sector NOT IN ('Financial Services', 'Utilities')
  AND p.isActivelyTrading = true
ORDER BY f.netProfitMarginTTM DESC
LIMIT 30
Brazil's small universe means this screen typically returns 10-20 stocks. The names that pass are concentrated in a few sectors: consumer staples (Ambev), industrials (WEG), energy (Petrobras), and mining (Vale). These are companies with genuine competitive moats in a market where most firms rely on leverage.
What We Found
Margin wins in Brazil. That's the opposite of India, and it makes sense given Brazil's high interest rate environment.
| Portfolio | CAGR | Volatility | Sharpe | Max Drawdown | vs Bovespa |
|---|---|---|---|---|---|
| Margin-Driven ROE > 15% | 19.38% | 37.1% | 0.281 | -- | +10.80% |
| Quality ROE (balanced) | 19.28% | 36.8% | 0.235 | -32.7% | +10.70% |
| All ROE > 15% | 17.22% | -- | -- | -- | +8.64% |
| Leverage-Driven ROE > 15% | 15.68% | 40.7% | -- | -50.1% | +7.10% |
| Bovespa | 8.58% | -- | -- | -- | -- |
The margin-to-leverage spread is +3.7%. Margin-driven companies outperformed leverage-driven companies by 3.7% per year. This is among the strongest margin advantages we found in any market, and the direct opposite of India's spread favoring leverage.
Quality ROE sits just below margin-driven at 19.28% CAGR. Against the Bovespa (8.58%), that's +10.70% excess return annually. The 60% win rate means Quality ROE beat the local index in 15 of 25 years.
Why margin wins in Brazil
Brazil's Selic rate averaged 10-12% from 2000 to 2025, with peaks above 14%. Companies that fund expansion with debt pay dearly for it. A leveraged Brazilian company needs to generate returns well above the Selic rate just to break even on its debt. Many don't.
Margin-driven companies avoid this trap. They self-fund growth from operating cash flow. In a high-rate environment, that's an enormous structural advantage. WEG, the industrial company, is the poster child: consistently high margins, low leverage, and returns that compound through every rate cycle.
Down capture: the standout number
| Metric | Value |
|---|---|
| Excess return vs Bovespa (annualized) | +10.70% |
| Alpha | +11.18% |
| Win rate (annual) | 60% |
| Up capture | 179% |
| Down capture | 21.9% |
| Average quality stocks | 12 |
| Cash periods | 1 |
A 21.9% down capture is extraordinary. When the market fell, this portfolio barely participated. Three possible explanations:
1. Domestic focus. Brazilian quality companies tend to serve the domestic market. When US markets sell off on US-specific concerns (tech corrections, rate hikes), Brazilian consumer and industrial companies don't necessarily follow.
2. Commodity tailwinds during global stress. Several Brazilian quality names are commodity-adjacent. When global markets sell off on inflation fears, commodity prices often rise simultaneously, providing a natural hedge.
3. Small concentrated portfolio. With only 12 stocks on average, a few strong performers can dominate the portfolio's behavior. The down capture could partly reflect the specific companies that survived the quality filter rather than a systematic property.
Decade breakdown
| Period | Quality ROE | Notes |
|---|---|---|
| 2000-2004 | 53.5% | Commodity supercycle, BRL recovery |
| 2005-2009 | 32.9% | Pre-crisis boom, 2008 crash, 2009 recovery |
| 2010-2014 | 7.3% | Dilma era, economic slowdown |
| 2015-2019 | 9.7% | Political crisis, Temer/Bolsonaro reforms |
| 2020-2025 | 15.6% | COVID recovery, commodity prices |
The 2000-2004 period stands out at 53.5% annually. This was the tail end of Brazil's recovery from its 1999 currency crisis, combined with the early stages of the commodity supercycle. Quality companies with strong margins benefited from rising commodity prices and a stabilizing currency.
The 2010-2014 slowdown to 7.3% reflects Brazil's economic stagnation under the Dilma administration. Even quality companies struggled as GDP growth stalled and domestic demand weakened.
Backtest Methodology
| Parameter | Value |
|---|---|
| Universe | SAO (B3), market cap > R$1B |
| Exclusions | Financials, utilities |
| Signal | DuPont decomposition: net margin, asset turnover, equity multiplier |
| Quality ROE | ROE > 15%, both net margin and equity multiplier above median |
| Margin-driven | Top quartile net margin within ROE > 15% |
| Leverage-driven | Top quartile equity multiplier within ROE > 15% |
| Rebalance | Annual, April |
| Filing lag | 45 days (point-in-time) |
| Portfolio | Equal-weight |
| Transaction costs | 0.15% per trade |
| Benchmark | Bovespa (B3 main index, BRL total return) |
Limitations
Small universe (12 stocks average). This is the biggest caveat. With only 12 qualifying stocks on average, individual company outcomes drive portfolio returns. One exceptional performer or one blowup has outsized impact. The results are real, but they reflect a concentrated bet on a very narrow set of Brazilian quality companies.
The 2000-2004 period inflates the CAGR. 53.5% annually for five years does heavy lifting on the 25-year CAGR. Remove that period and the CAGR drops to roughly 14-15%. Still strong, but the headline 19.1% includes a period that's unlikely to repeat.
Currency risk. All returns are in BRL. The Brazilian real depreciated significantly against the USD over 25 years (from roughly 1.8/USD in 2000 to 5.5/USD in 2025). International investors would see substantially lower USD-adjusted returns.
SAO data quality. FMP's coverage of Brazilian stocks has gaps, particularly in the earlier years. Some companies have missing financial statement data that could introduce survivorship bias.
Financials and utilities excluded. Brazil's financial sector (Itau, Bradesco, B3) and utilities (Eletrobras, CPFL) are among the largest listed companies. Excluding them significantly narrows the universe and may overstate the strategy's capacity.
Takeaway
Brazil is the best market we found for DuPont ROE decomposition. Quality ROE returned 19.28% annually with a Sharpe of 0.235 and a max drawdown of only -32.7%. That's +10.70% annually over the Bovespa. The 21.9% down capture is the lowest of any market we tested.
The key structural insight: Brazil's high interest rate environment makes leverage expensive. Companies that earn high ROE through margins have a genuine and persistent advantage. The margin-to-leverage spread of +3.7% is among the strongest we've seen.
The honest caveat is the small universe. Twelve stocks on average means this is a concentrated bet, not a diversified factor tilt. The numbers are real, but they depend on a very small number of Brazilian quality companies continuing to deliver.
Part of a Series
- DuPont ROE: US Stocks -- flagship backtest, 22 years of US data
References
- Soliman, M.T. (2008). "The Use of DuPont Analysis by Market Participants." The Accounting Review, 83(3), 823-853.
- Fairfield, P.M. and Yohn, T.L. (2001). "Using Asset Turnover and Profit Margin to Forecast Changes in Profitability." Review of Accounting Studies, 6(4), 371-385.
Data: Ceta Research (FMP financial data warehouse), 2000-2025.
Past performance does not guarantee future results. This is educational content, not investment advice.


