
High Yield Blue Chips in Sweden: 9.7% CAGR Over 25 Years of Stockholm Exchange Data
The Dogs of the Dow adapted for Sweden. Take the 30 largest STO stocks, buy the 10 highest-yielding. 9.7% CAGR over 25 years, +6.8% excess over the OMX Stockholm 30, 68% win rate against the local benchmark.

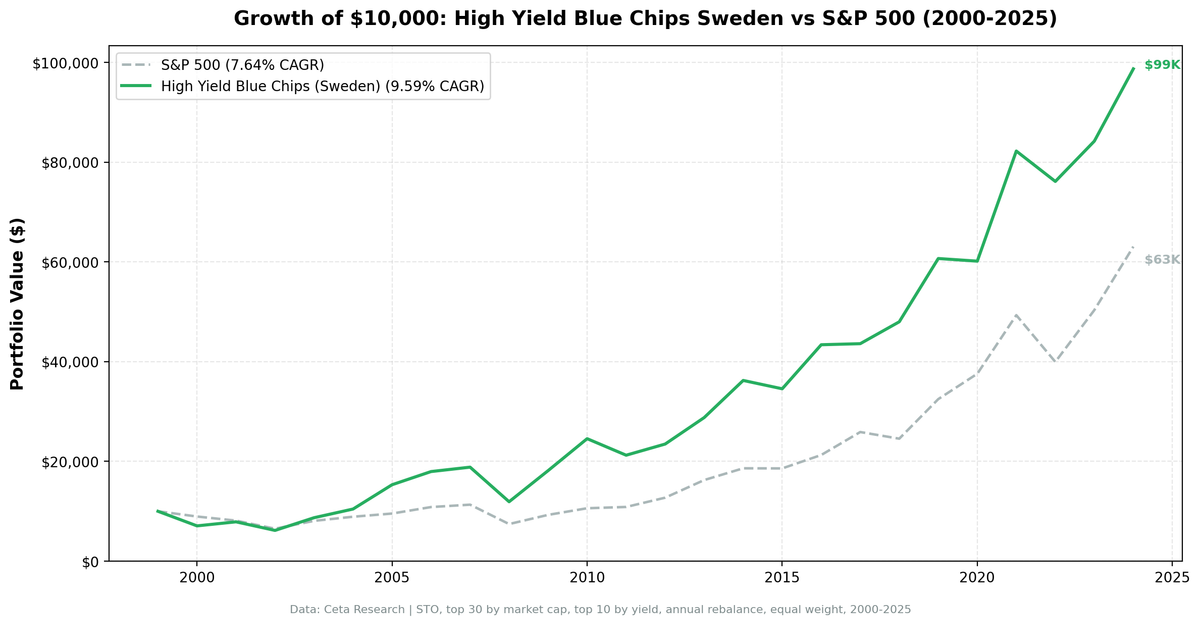
We adapted the Dogs of the Dow for Sweden's Stockholm Exchange. Take the 30 largest STO stocks by market cap (SEK 5B+), buy the 10 highest-yielding, hold for a year, repeat. Over 25 years (2000-2025), this returned 9.7% annually, turning $10,000 into $102,000. That's +6.8% excess over the OMX Stockholm 30, with a 68% win rate against the local benchmark.
Contents
- Method
- Why Sweden?
- The Screen (SQL)
- What We Found
- Swedish blue chips beat the OMX30 by 6.8% annually.
- Sweden's strength is crisis protection.
- Full annual performance
- Limitations
- Takeaway
Data: FMP financial data warehouse, 2000–2025. Updated March 2026.
Method
Data source: Ceta Research (FMP financial data warehouse) Universe: Stockholm Exchange (STO), top 30 stocks by market cap Period: 2000-2025 (25 annual periods) Rebalancing: Annual (January), equal weight, top 10 by dividend yield Execution: Next-day close (market-on-close) Benchmark: OMX Stockholm 30 (local currency, SEK) Transaction costs: Size-tiered (0.1% for >$10B, 0.3% for $2-10B, 0.5% for <$2B) Cash rule: Hold cash if fewer than 5 stocks qualify (never triggered)
For the full strategy explanation and US results, see the main Dogs of the Dow post.
Why Sweden?
Sweden is a strong market for dividend strategies. The Stockholm Exchange hosts global blue chips like Ericsson, Volvo, Atlas Copco, and Investor AB. Swedish companies have a strong dividend culture, many paying out 40-60% of earnings consistently. The market is deep enough (30+ large-cap stocks) to support the strategy.
What makes the results striking: the OMX Stockholm 30 only returned 2.95% CAGR from 2000 to 2025. High-yield blue chips returned 9.7%. That's +6.8% annual excess over the local market, with a 68% win rate.
The Screen (SQL)
WITH blue_chips AS (
    SELECT k.symbol, p.companyName, k.marketCap
    FROM key_metrics_ttm k
    JOIN profile p ON k.symbol = p.symbol
    WHERE p.exchange = 'STO'
        AND k.marketCap > 5e9
    ORDER BY k.marketCap DESC
    LIMIT 30
)
SELECT
    bc.symbol,
    bc.companyName,
    f.dividendYieldTTM * 100 as dividend_yield_pct,
    bc.marketCap / 1e9 as market_cap_billions,
    f.priceToEarningsRatioTTM as pe_ratio
FROM blue_chips bc
JOIN financial_ratios_ttm f ON bc.symbol = f.symbol
WHERE f.dividendYieldTTM > 0
ORDER BY f.dividendYieldTTM DESC
LIMIT 10
Run this screen on Ceta Research →
What We Found
Swedish blue chips beat the OMX30 by 6.8% annually.
| Metric | STO Blue Chips | OMX Stockholm 30 |
|---|---|---|
| CAGR | 9.7% | 2.95% |
| Total Return | 921% | 107% |
| Sharpe Ratio | 0.342 | 0.047 |
| Sortino Ratio | 0.670 | 0.070 |
| Max Drawdown | -38.2% | -57.5% |
| Volatility | 22.6% | 20.5% |
| Beta | 0.96 | 1.00 |
| Win Rate vs OMX30 | 68% | -- |
| Negative Years | 6 of 25 (24%) | 9 of 25 (36%) |
The +6.8% excess vs OMX30 reflects genuine alpha. High-yield blue chips captured 134.2% of OMX30 gains (up capture) but only 51.3% of losses (down capture). When the local market fell, this portfolio held up much better. The Sharpe ratio (0.342) dwarfs the OMX30's (0.047), confirming far superior risk-adjusted returns.
Sweden's strength is crisis protection.
The OMX30 was brutal from 2000 to 2002, losing -38% in one year alone. The blue chip portfolio cut those losses sharply.
| Year | STO Blue Chips | OMX30 | Excess |
|---|---|---|---|
| 2001 | +13.0% | -20.1% | +33.1% |
| 2002 | -17.5% | -38.2% | +20.7% |
| 2007 | +5.1% | -9.1% | +14.2% |
| 2009 | +51.5% | +38.9% | +12.6% |
| 2016 | +26.0% | +9.5% | +16.5% |
| 2018 | +8.8% | -11.0% | +19.8% |
| 2022 | -7.4% | -15.1% | +7.7% |
2001 stands out: when the OMX30 dropped 20%, the high-yield blue chips gained 13%. A 33 percentage point swing. 2018 was similar: the OMX30 fell 11% while the portfolio gained 9%.
Full annual performance
| Year | STO Blue Chips | OMX30 | Excess |
|---|---|---|---|
| 2000 | -29.4% | -14.0% | -15.4% |
| 2001 | +13.0% | -20.1% | +33.1% |
| 2002 | -17.5% | -38.2% | +20.7% |
| 2003 | +41.2% | +25.2% | +16.0% |
| 2004 | +20.1% | +16.0% | +4.1% |
| 2005 | +47.3% | +28.8% | +18.5% |
| 2006 | +18.2% | +20.8% | -2.6% |
| 2007 | +5.1% | -9.1% | +14.2% |
| 2008 | -38.2% | -34.5% | -3.8% |
| 2009 | +51.5% | +38.9% | +12.6% |
| 2010 | +33.3% | +22.1% | +11.2% |
| 2011 | -12.7% | -15.1% | +2.4% |
| 2012 | +9.8% | +13.1% | -3.3% |
| 2013 | +22.9% | +17.2% | +5.7% |
| 2014 | +25.7% | +10.5% | +15.2% |
| 2015 | -4.7% | -4.7% | +0.0% |
| 2016 | +26.0% | +9.5% | +16.5% |
| 2017 | +0.4% | +3.5% | -3.1% |
| 2018 | +8.8% | -11.0% | +19.8% |
| 2019 | +26.0% | +28.6% | -2.7% |
| 2020 | +0.2% | +4.8% | -4.6% |
| 2021 | +36.7% | +28.9% | +7.8% |
| 2022 | -7.4% | -15.1% | +7.7% |
| 2023 | +9.4% | +15.4% | -6.0% |
| 2024 | +18.0% | +4.8% | +13.2% |
Win rate: 68%. The portfolio beat the OMX30 in 17 of 25 years. The underperformance periods (2000, 2006, 2012, 2019-20, 2023) are mostly years when the Swedish market was in a growth or recovery rally. The dividend-yield selection lags when momentum-driven stocks dominate.
Limitations
Currency risk. Returns are in SEK. From a USD investor's perspective, the Swedish Krona's depreciation vs the dollar reduces the USD-equivalent returns. The SEK lost roughly 20-25% against the dollar over this period, which means USD-denominated returns are lower than local SEK returns.
Small blue-chip universe. Sweden has fewer mega-cap stocks than the US. The top 30 by market cap is a reasonable universe, but sector concentration (industrials, financials) is higher than in a 500-stock index.
Moderate volatility. 22.6% annualized is higher than the US Dogs (11.9%). The strategy outperforms the local market, but individual years are volatile.
Note on S&P 500 comparison. For cross-market consistency with our global comparison, STO returns +2.1% vs SPY (the S&P 500 returned 7.64% CAGR over the same period, far outpacing the OMX30's 2.95%). The OMX30 comparison is the relevant local benchmark.
Takeaway
High-yield blue chips on Sweden's Stockholm Exchange delivered 9.7% CAGR and +6.8% excess over the OMX Stockholm 30 from 2000 to 2025. A 68% win rate and down capture of 51.3% confirm this is a consistent local outperformer, not a one-decade anomaly. The strategy beat the OMX30 in 17 of 25 years, with the largest gains coming when the Swedish market sold off.
For the US results, see the flagship Dogs of the Dow post. For how this strategy performed across all global markets, see the global comparison.
Data: Ceta Research (FMP financial data warehouse), 2000-2025. Full methodology: METHODOLOGY.md
Past performance does not guarantee future results. This is educational content, not investment advice.


