
Dividend Sustainability on Swiss Stocks: 8.72% CAGR Over 25 Years
The dividend sustainability screen on SIX stocks returned 8.72% CAGR over 25 years with 6.98% annual excess over the SMI. 84% win rate vs local benchmark from Switzerland's world-class quality companies.

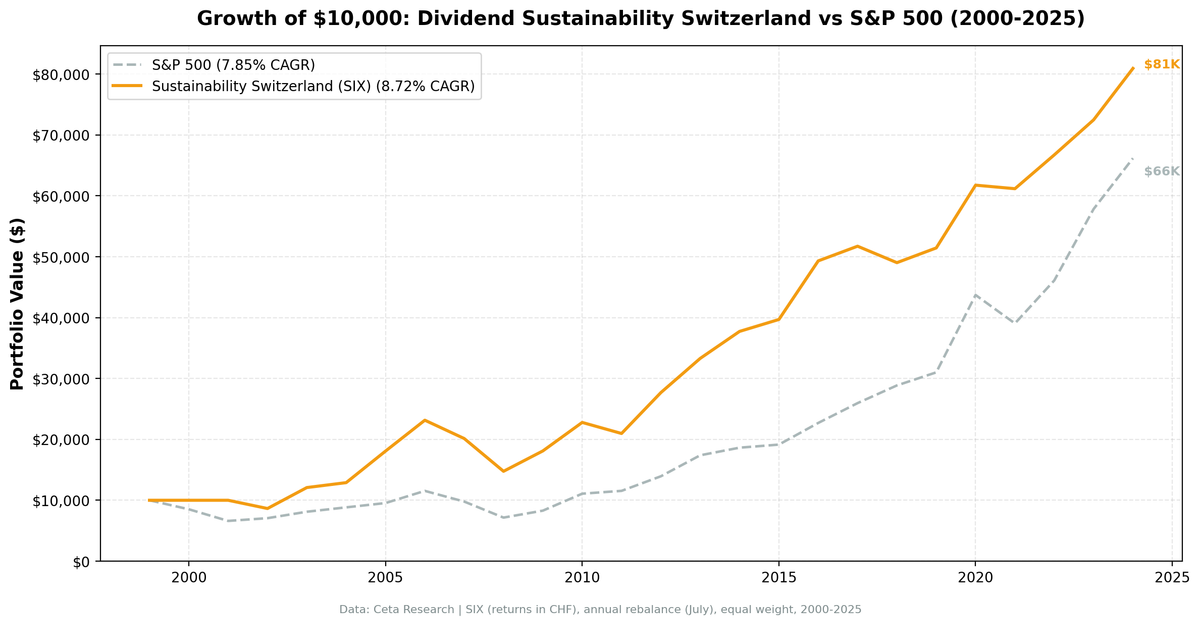
Switzerland's sustainability screen returned 8.72% CAGR over 25 years, beating the SMI by 6.98% annually. The strategy turned $10,000 into roughly $81,000. Where Switzerland shines is the quality of companies that pass the filter: an average sustainability score of 8.3/10, steady compounding, and a -36.25% max drawdown that, while still meaningful, reflects a single rough stretch rather than chronic underperformance. Against a local benchmark that only managed 1.74% CAGR, the sustainability screen added substantial value.
Contents
- Method
- The Screen (SQL)
- What We Found
- 25 years of data. 6.98% annual excess over SMI. High quality, small portfolio.
- Year-by-year returns
- 2005-2006: the peak years
- 2007-2008: the deep drawdown
- 2016: the strong rebound year
- Limitations
- Takeaway
- Part of a Series
- References
- Run This Screen Yourself
Data: FMP financial data warehouse, 2000-2025. Updated May 2026.
Method
We applied the same 5-component sustainability score used in our US dividend sustainability study. Five dimensions scored 0-2 each (payout ratio, debt/equity, FCF coverage, ROE, Piotroski F-Score), total 0-10. Minimum score 7, yield above 2%, top 30 by score, equal weight, annual July rebalance. See the US blog for full methodology and score breakdown.
Universe: SIX (Swiss Exchange), market cap > 500M CHF (~$568M USD) Period: 2000-2025 (25 years) Benchmark: SMI (Swiss Market Index, CHF) Execution: Next-day close (market-on-close after signal)
The Screen (SQL)
WITH latest_ratios AS (
    SELECT r.symbol, r.dividendPayoutRatio, r.debtToEquityRatio,
           r.dividendYield, r.date,
        ROW_NUMBER() OVER (PARTITION BY r.symbol ORDER BY r.date DESC) AS rn
    FROM financial_ratios r
    JOIN profile p ON r.symbol = p.symbol
    WHERE r.period = 'FY'
      AND r.dividendPayoutRatio > 0
      AND r.dividendYield IS NOT NULL
      AND p.exchange IN ('SIX')
),
latest_cf AS (
    SELECT c.symbol, c.freeCashFlow, c.commonDividendsPaid, c.date,
        ROW_NUMBER() OVER (PARTITION BY c.symbol ORDER BY c.date DESC) AS rn
    FROM cash_flow_statement c
    JOIN profile p ON c.symbol = p.symbol
    WHERE c.period = 'FY'
      AND c.commonDividendsPaid < 0
      AND p.exchange IN ('SIX')
),
latest_metrics AS (
    SELECT k.symbol, k.returnOnEquity, k.marketCap, k.date,
        ROW_NUMBER() OVER (PARTITION BY k.symbol ORDER BY k.date DESC) AS rn
    FROM key_metrics k
    JOIN profile p ON k.symbol = p.symbol
    WHERE k.period = 'FY'
      AND k.marketCap IS NOT NULL
      AND p.exchange IN ('SIX')
),
latest_scores AS (
    SELECT symbol, piotroskiScore FROM scores
),
scored AS (
    SELECT r.symbol, r.date,
        ROUND(r.dividendPayoutRatio * 100, 1) AS payout_pct,
        ROUND(r.debtToEquityRatio, 2) AS debt_equity,
        ROUND(c.freeCashFlow / NULLIF(ABS(c.commonDividendsPaid), 0), 2) AS fcf_coverage,
        ROUND(k.returnOnEquity * 100, 1) AS roe_pct,
        s.piotroskiScore AS piotroski,
        ROUND(r.dividendYield * 100, 2) AS yield_pct,
        ROUND(k.marketCap / 1e9, 1) AS mktcap_bn,
        CASE WHEN r.dividendPayoutRatio < 0.5 THEN 2
             WHEN r.dividendPayoutRatio < 0.8 THEN 1 ELSE 0 END AS c_payout,
        CASE WHEN r.debtToEquityRatio >= 0 AND r.debtToEquityRatio < 0.5 THEN 2
             WHEN r.debtToEquityRatio >= 0 AND r.debtToEquityRatio < 1.5 THEN 1
             ELSE 0 END AS c_debt,
        CASE WHEN c.freeCashFlow > 0 AND c.commonDividendsPaid < 0
                  AND c.freeCashFlow / ABS(c.commonDividendsPaid) > 2 THEN 2
             WHEN c.freeCashFlow > 0 AND c.commonDividendsPaid < 0
                  AND c.freeCashFlow / ABS(c.commonDividendsPaid) > 1 THEN 1
             ELSE 0 END AS c_fcf,
        CASE WHEN k.returnOnEquity > 0.15 THEN 2
             WHEN k.returnOnEquity > 0.08 THEN 1 ELSE 0 END AS c_roe,
        CASE WHEN s.piotroskiScore >= 7 THEN 2
             WHEN s.piotroskiScore >= 5 THEN 1 ELSE 0 END AS c_piotroski
    FROM latest_ratios r
    JOIN latest_cf c ON r.symbol = c.symbol AND c.rn = 1
    JOIN latest_metrics k ON r.symbol = k.symbol AND k.rn = 1
    LEFT JOIN latest_scores s ON r.symbol = s.symbol
    WHERE r.rn = 1
      AND r.dividendYield > 0.02
      AND k.marketCap > 500e6
)
SELECT symbol, date, payout_pct, debt_equity, fcf_coverage, roe_pct, piotroski,
       yield_pct, mktcap_bn,
       c_payout + c_debt + c_fcf + c_roe + COALESCE(c_piotroski, 0) AS sustainability_score,
       c_payout, c_debt, c_fcf, c_roe, COALESCE(c_piotroski, 0) AS c_piotroski
FROM scored
WHERE c_payout + c_debt + c_fcf + c_roe + COALESCE(c_piotroski, 0) >= 7
ORDER BY sustainability_score DESC, yield_pct DESC
LIMIT 30
[Run this query on Ceta Research][SUSTAINABILITY_SWITZERLAND_QUERY_URL]
What We Found

25 years of data. 6.98% annual excess over SMI. High quality, small portfolio.
| Metric | Sustainability (Switzerland) | SMI |
|---|---|---|
| CAGR | 8.72% | 1.74% |
| Volatility | 16.88% | - |
| Max Drawdown | -36.25% | - |
| Sharpe Ratio | 0.487 | - |
| Sortino Ratio | 1.174 | - |
| Win Rate (annual) | 84% | - |
| Up Capture | 154.8% | - |
| Down Capture | 34.1% | - |
| Beta | 0.946 | - |
| Alpha | 7.05% | - |
| Avg Stocks per Period | 15.0 | - |
| Cash Periods | 2 of 25 | - |
| Avg Sustainability Score | 8.3/10 | - |
The SMI returned just 1.74% CAGR over this period, making the sustainability screen's 7.05% alpha and 84% win rate vs the local benchmark the real headline. Up capture of 154.8% means the strategy more than 1.5x'd the SMI's gains in up years, while 34.1% down capture provided meaningful downside cushion.
The smallest average portfolio in the series at 15.0 stocks. SIX has a limited universe of large-cap companies that meet the 500M CHF threshold and score 7+. This concentration is both a strength (very high quality) and a risk (less diversification).
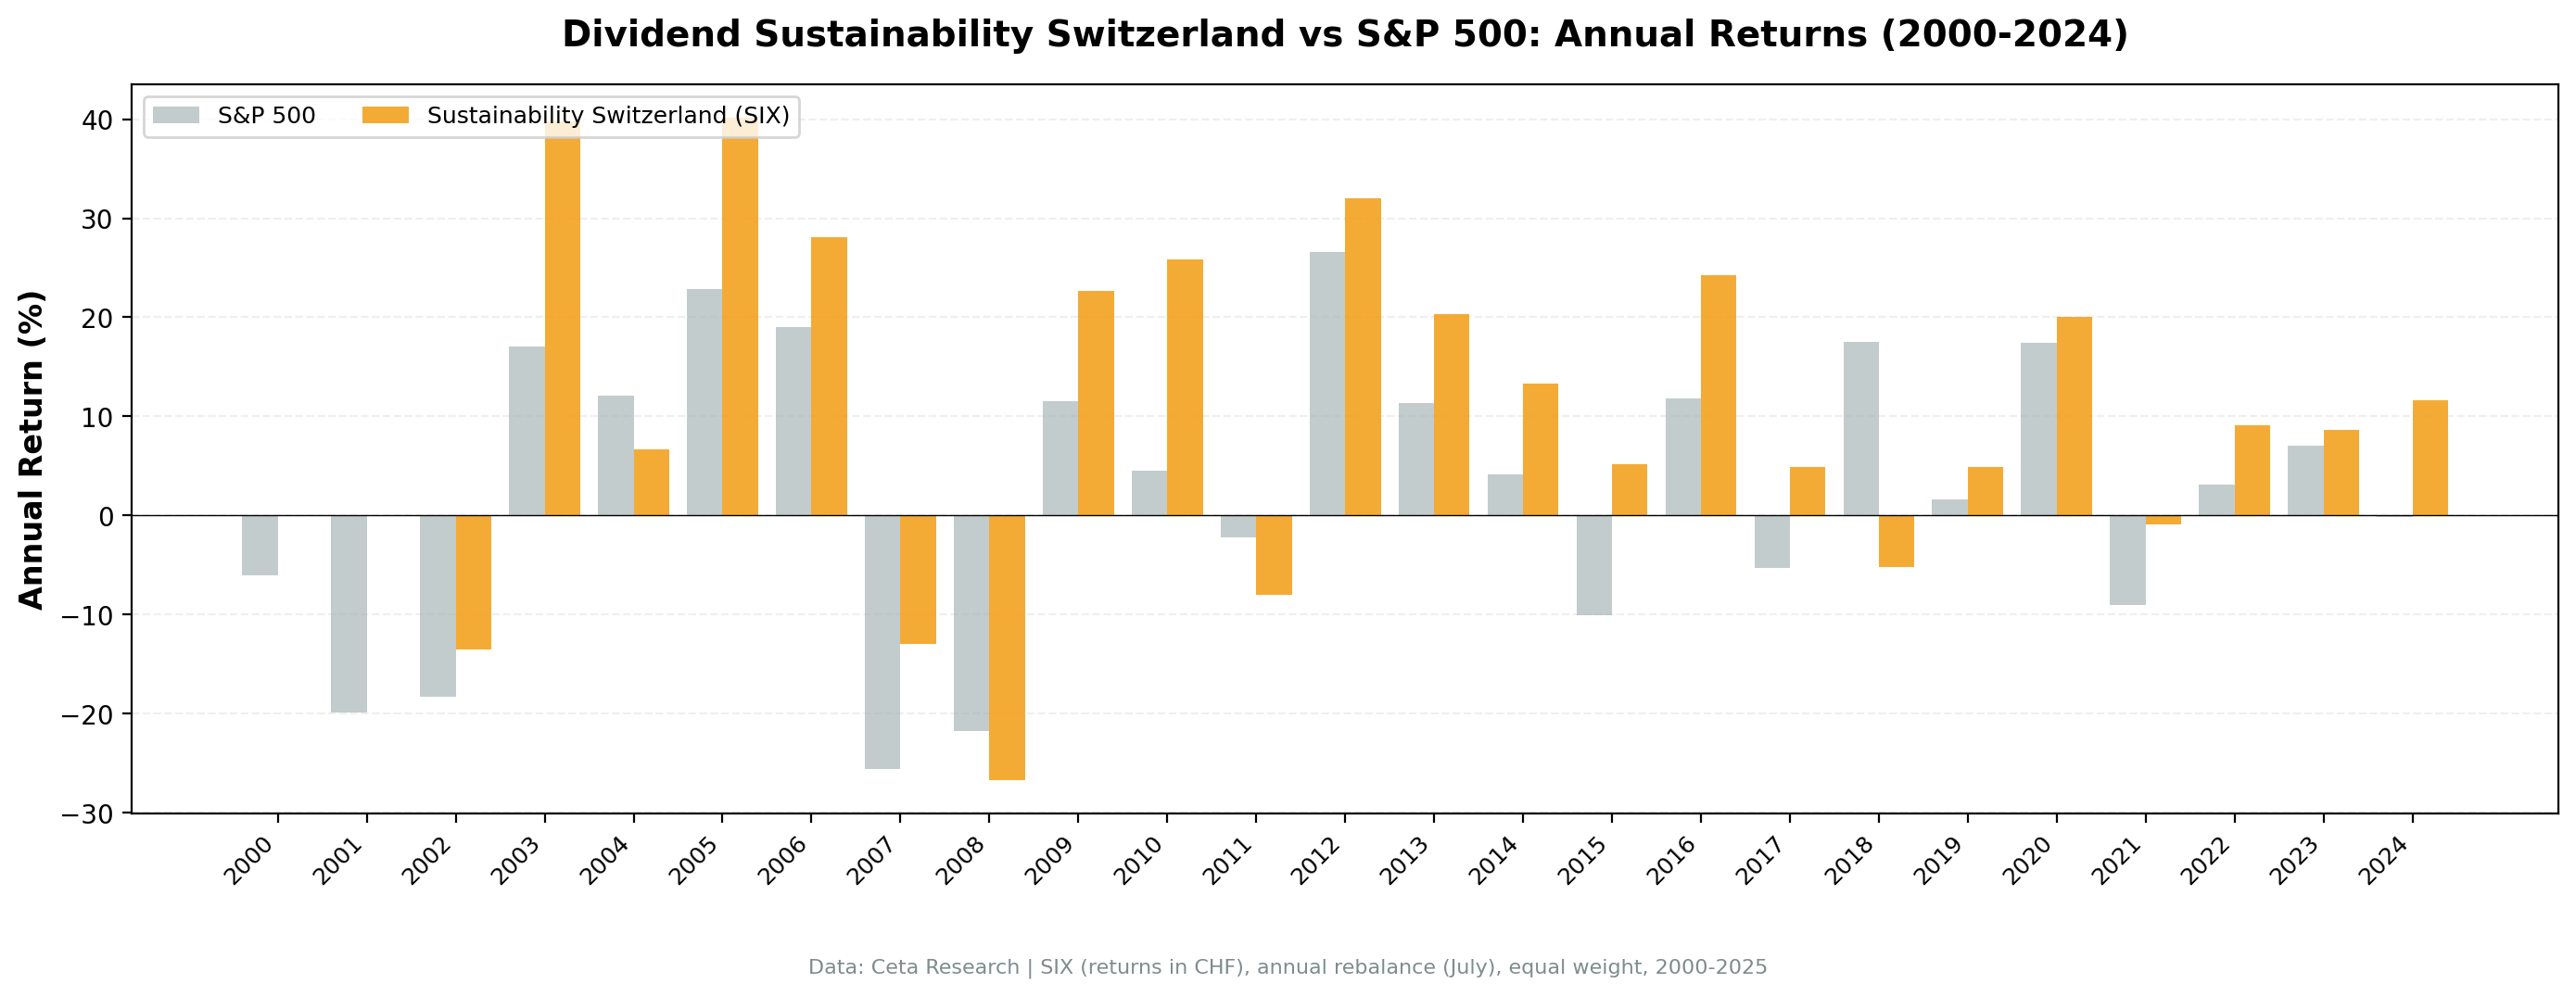
Year-by-year returns
| Year | Sustainability | SMI | Excess |
|---|---|---|---|
| 2000 | 0.0% (cash) | - | 0.0% |
| 2001 | 0.0% (cash) | - | 0.0% |
| 2002 | -13.5% | -18.3% | +4.8% |
| 2003 | +39.8% | +17.1% | +22.8% |
| 2004 | +6.7% | +12.1% | -5.4% |
| 2005 | +40.2% | +22.9% | +17.3% |
| 2006 | +28.1% | +19.1% | +9.0% |
| 2007 | -13.0% | -25.6% | +12.6% |
| 2008 | -26.7% | -21.8% | -5.0% |
| 2009 | +22.7% | +11.6% | +11.1% |
| 2010 | +25.8% | +4.5% | +21.3% |
| 2011 | -8.0% | -2.2% | -5.8% |
| 2012 | +32.0% | +26.6% | +5.5% |
| 2013 | +20.3% | +11.3% | +9.0% |
| 2014 | +13.3% | +4.1% | +9.2% |
| 2015 | +5.2% | -10.1% | +15.3% |
| 2016 | +24.2% | +11.8% | +12.4% |
| 2017 | +4.9% | -5.3% | +10.2% |
| 2018 | -5.2% | +17.5% | -22.7% |
| 2019 | +4.9% | +1.7% | +3.3% |
| 2020 | +20.0% | +17.5% | +2.6% |
| 2021 | -0.9% | -9.1% | +8.1% |
| 2022 | +9.1% | +3.1% | +6.0% |
| 2023 | +8.6% | +7.1% | +1.6% |
| 2024 | +11.7% | -0.2% | +11.8% |
2005-2006: the peak years
+40.2% and +28.1%. Swiss pharmaceuticals and industrials were booming. Companies in precision instruments, specialty chemicals, and food production scored high across all five dimensions. Low Swiss interest rates boosted dividend attractiveness, and the sustainability filter captured the highest-quality payers.
2007-2008: the deep drawdown
-13.0% followed by -26.7%. The 2008 leg drives the -36.25% max drawdown. Swiss banks (which typically carry high leverage) were filtered out by the D/E component, but the financial crisis hit even quality industrials hard. The small portfolio (15.0 stocks average) amplified the damage. The screen still beat the SMI in 2007 by a wide margin (+12.6% excess) but gave back ground in 2008.
2016: the strong rebound year
+24.2%, one of the strategy's best post-GFC years. Swiss exporters benefited from a weaker franc after the SNB abandoned its EUR/CHF floor. Companies with strong fundamentals and disciplined payouts captured the recovery in European demand.
Limitations
- Small portfolio. 15.0 stocks on average is the lowest in the series. SIX simply doesn't have enough qualifying companies to fill 30 slots, which increases single-stock risk.
- Deep max drawdown. -36.25% is still meaningful. The 2007-2008 stretch exposed the concentration problem in a small market.
- Win rate vs SMI is 84%. Against the local benchmark, the strategy wins in most years. The absolute return doesn't obscure how consistently the screen outperformed the SMI.
Takeaway
Switzerland's sustainability screen produced 8.72% CAGR with 6.98% excess over the SMI across 25 years. The strategy works because Swiss companies that score 7+/10 are genuinely world-class: low debt, strong cash flows, high ROE, disciplined payouts. Against a local benchmark that returned only 1.74% CAGR, the screen's 7.05% alpha and 84% win rate are a strong result. The constraint is the small universe. With only 15 stocks on average, the portfolio is more concentrated than on larger exchanges. The -36.25% max drawdown reflects that concentration. If you want Swiss quality dividend exposure with a systematic framework, this delivers. Just expect a bumpier ride than Germany and concentration risk that comes with a shallow investable universe.
Part of a Series
This analysis is part of our dividend sustainability global exchange comparison: - Dividend Sustainability Score: US Stocks - 10.73% CAGR, full methodology - [Dividend Sustainability on Indian Stocks (NSE)][INDIA_BLOG_URL] - 15.86% CAGR, the standout - [Dividend Sustainability on German Stocks (XETRA)][GERMANY_BLOG_URL] - 12.27% CAGR, best Sharpe (0.652) - [Dividend Sustainability on Swedish Stocks (STO)][SWEDEN_BLOG_URL] - 10.21% CAGR - [Dividend Sustainability: 13-Exchange Global Comparison][COMPARISON_BLOG_URL] - full comparison table
References
- DeAngelo, H., DeAngelo, L. & Skinner, D. (1992). "Dividends and Losses." Journal of Finance, 47(5), 1837-1863.
- Piotroski, J. (2000). "Value Investing: The Use of Historical Financial Statement Information to Separate Winners from Losers." Journal of Accounting Research, 38, 1-41.
- Benartzi, S., Michaely, R. & Thaler, R. (1997). "Do Changes in Dividends Signal the Future or the Past?" Journal of Finance, 52(3), 1007-1034.
Run This Screen Yourself
Via web UI: [Run the sustainability screen on Ceta Research][SUSTAINABILITY_SWITZERLAND_QUERY_URL]. The query is pre-loaded. Hit "Run" and see what passes today.
Get your API key at cetaresearch.com. The full backtest code (Python + DuckDB) is on GitHub.
Data: Ceta Research, FMP financial data warehouse. Universe: SIX, market cap > 500M CHF. Annual rebalance (July), equal weight top 30 by sustainability score, 2000-2025.
Past performance does not guarantee future results. This is educational content, not investment advice.


