
Dividend Sustainability on Indian Stocks (NSE): 15.86% CAGR Over 25 Years
The dividend sustainability screen on NSE stocks returned 15.86% CAGR over 25 years with 3.80% annual excess over the Sensex. Down capture of -19.3% means the strategy gained on average during market declines.

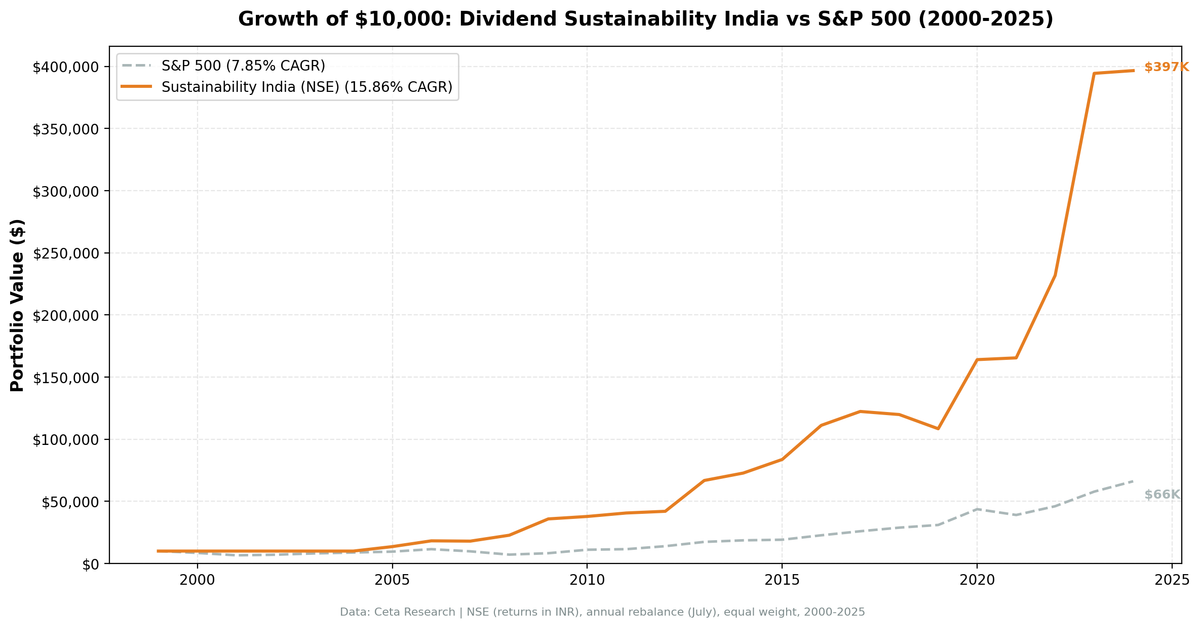
India produced the highest returns of any exchange we tested with the dividend sustainability screen. 15.86% CAGR from 2000 to 2025, turning ₹10,000 into roughly ₹3.97 lakh. That's 3.80% annual excess over the Sensex, with a max drawdown of just -11.4%. The strategy also posted positive returns in 2008 (+26.4%) while the Sensex returned 7.3%.
Contents
- Method
- The Screen (SQL)
- What We Found
- 25 years of data. 3.80% annual excess over the Sensex.
- Year-by-year returns
- 2008: a year of genuine protection
- 2005-2006: first two invested years
- 2020-2023: four strong years
- Limitations
- Takeaway
- Part of a Series
- References
- Run This Screen Yourself
Data: FMP financial data warehouse, 2000–2025. Updated May 2026.
Method
We applied the same 5-component sustainability score used in our US dividend sustainability study. Five dimensions scored 0-2 each (payout ratio, debt/equity, FCF coverage, ROE, Piotroski F-Score), total 0-10. Minimum score 7, yield above 2%, top 30 by score, equal weight, annual July rebalance. See the US blog for full methodology and score breakdown.
Universe: NSE (National Stock Exchange), market cap > 20B INR (~$240M USD) Period: 2000-2025 (25 years) Benchmark: Sensex (BSE Sensex, INR) Execution: Next-day close (market-on-close after signal)
The Screen (SQL)
WITH latest_ratios AS (
    SELECT r.symbol, r.dividendPayoutRatio, r.debtToEquityRatio,
           r.dividendYield, r.date,
        ROW_NUMBER() OVER (PARTITION BY r.symbol ORDER BY r.date DESC) AS rn
    FROM financial_ratios r
    JOIN profile p ON r.symbol = p.symbol
    WHERE r.period = 'FY'
      AND r.dividendPayoutRatio > 0
      AND r.dividendYield IS NOT NULL
      AND p.exchange IN ('NSE')
),
latest_cf AS (
    SELECT c.symbol, c.freeCashFlow, c.commonDividendsPaid, c.date,
        ROW_NUMBER() OVER (PARTITION BY c.symbol ORDER BY c.date DESC) AS rn
    FROM cash_flow_statement c
    JOIN profile p ON c.symbol = p.symbol
    WHERE c.period = 'FY'
      AND c.commonDividendsPaid < 0
      AND p.exchange IN ('NSE')
),
latest_metrics AS (
    SELECT k.symbol, k.returnOnEquity, k.marketCap, k.date,
        ROW_NUMBER() OVER (PARTITION BY k.symbol ORDER BY k.date DESC) AS rn
    FROM key_metrics k
    JOIN profile p ON k.symbol = p.symbol
    WHERE k.period = 'FY'
      AND k.marketCap IS NOT NULL
      AND p.exchange IN ('NSE')
),
latest_scores AS (
    SELECT symbol, piotroskiScore FROM scores
),
scored AS (
    SELECT r.symbol, r.date,
        ROUND(r.dividendPayoutRatio * 100, 1) AS payout_pct,
        ROUND(r.debtToEquityRatio, 2) AS debt_equity,
        ROUND(c.freeCashFlow / NULLIF(ABS(c.commonDividendsPaid), 0), 2) AS fcf_coverage,
        ROUND(k.returnOnEquity * 100, 1) AS roe_pct,
        s.piotroskiScore AS piotroski,
        ROUND(r.dividendYield * 100, 2) AS yield_pct,
        ROUND(k.marketCap / 1e9, 1) AS mktcap_bn,
        CASE WHEN r.dividendPayoutRatio < 0.5 THEN 2
             WHEN r.dividendPayoutRatio < 0.8 THEN 1 ELSE 0 END AS c_payout,
        CASE WHEN r.debtToEquityRatio >= 0 AND r.debtToEquityRatio < 0.5 THEN 2
             WHEN r.debtToEquityRatio >= 0 AND r.debtToEquityRatio < 1.5 THEN 1
             ELSE 0 END AS c_debt,
        CASE WHEN c.freeCashFlow > 0 AND c.commonDividendsPaid < 0
                  AND c.freeCashFlow / ABS(c.commonDividendsPaid) > 2 THEN 2
             WHEN c.freeCashFlow > 0 AND c.commonDividendsPaid < 0
                  AND c.freeCashFlow / ABS(c.commonDividendsPaid) > 1 THEN 1
             ELSE 0 END AS c_fcf,
        CASE WHEN k.returnOnEquity > 0.15 THEN 2
             WHEN k.returnOnEquity > 0.08 THEN 1 ELSE 0 END AS c_roe,
        CASE WHEN s.piotroskiScore >= 7 THEN 2
             WHEN s.piotroskiScore >= 5 THEN 1 ELSE 0 END AS c_piotroski
    FROM latest_ratios r
    JOIN latest_cf c ON r.symbol = c.symbol AND c.rn = 1
    JOIN latest_metrics k ON r.symbol = k.symbol AND k.rn = 1
    LEFT JOIN latest_scores s ON r.symbol = s.symbol
    WHERE r.rn = 1
      AND r.dividendYield > 0.02
      AND k.marketCap > 20e9
)
SELECT symbol, date, payout_pct, debt_equity, fcf_coverage, roe_pct, piotroski,
       yield_pct, mktcap_bn,
       c_payout + c_debt + c_fcf + c_roe + COALESCE(c_piotroski, 0) AS sustainability_score,
       c_payout, c_debt, c_fcf, c_roe, COALESCE(c_piotroski, 0) AS c_piotroski
FROM scored
WHERE c_payout + c_debt + c_fcf + c_roe + COALESCE(c_piotroski, 0) >= 7
ORDER BY sustainability_score DESC, yield_pct DESC
LIMIT 30
Run this query on Ceta Research
What We Found

25 years of data. 3.80% annual excess over the Sensex.
| Metric | Sustainability (India) | Sensex |
|---|---|---|
| CAGR | 15.86% | 12.06% |
| Total Return | 3,866% | 1,622% |
| Volatility | 23.12% | - |
| Max Drawdown | -11.36% | - |
| Sharpe Ratio | 0.405 | - |
| Sortino Ratio | 1.795 | - |
| Win Rate (annual) | 56% | - |
| Up Capture | 107.6% | - |
| Down Capture | -19.3% | - |
| Beta | 0.601 | - |
| Alpha | 6.02% | - |
| Avg Stocks per Period | 23.9 | - |
| Cash Periods | 5 of 25 | - |
| Avg Sustainability Score | 8.3/10 | - |
₹10,000 invested in 2000 grew to roughly ₹3.97 lakh. The strategy had 5 cash years (2000-2004) when fewer than 10 Indian stocks qualified on NSE, then compounded aggressively once the universe matured.
The down capture is -19.3%, meaning the strategy gained on average when the Sensex fell. A beta of 0.601 reflects below-market sensitivity, while 6.02% alpha shows the sustainability filter added consistent value above what the Sensex delivered. The Sortino ratio (1.795) reflects strong downside protection relative to the returns generated. The -11.36% max drawdown is the shallowest across all 13 exchanges in the study.
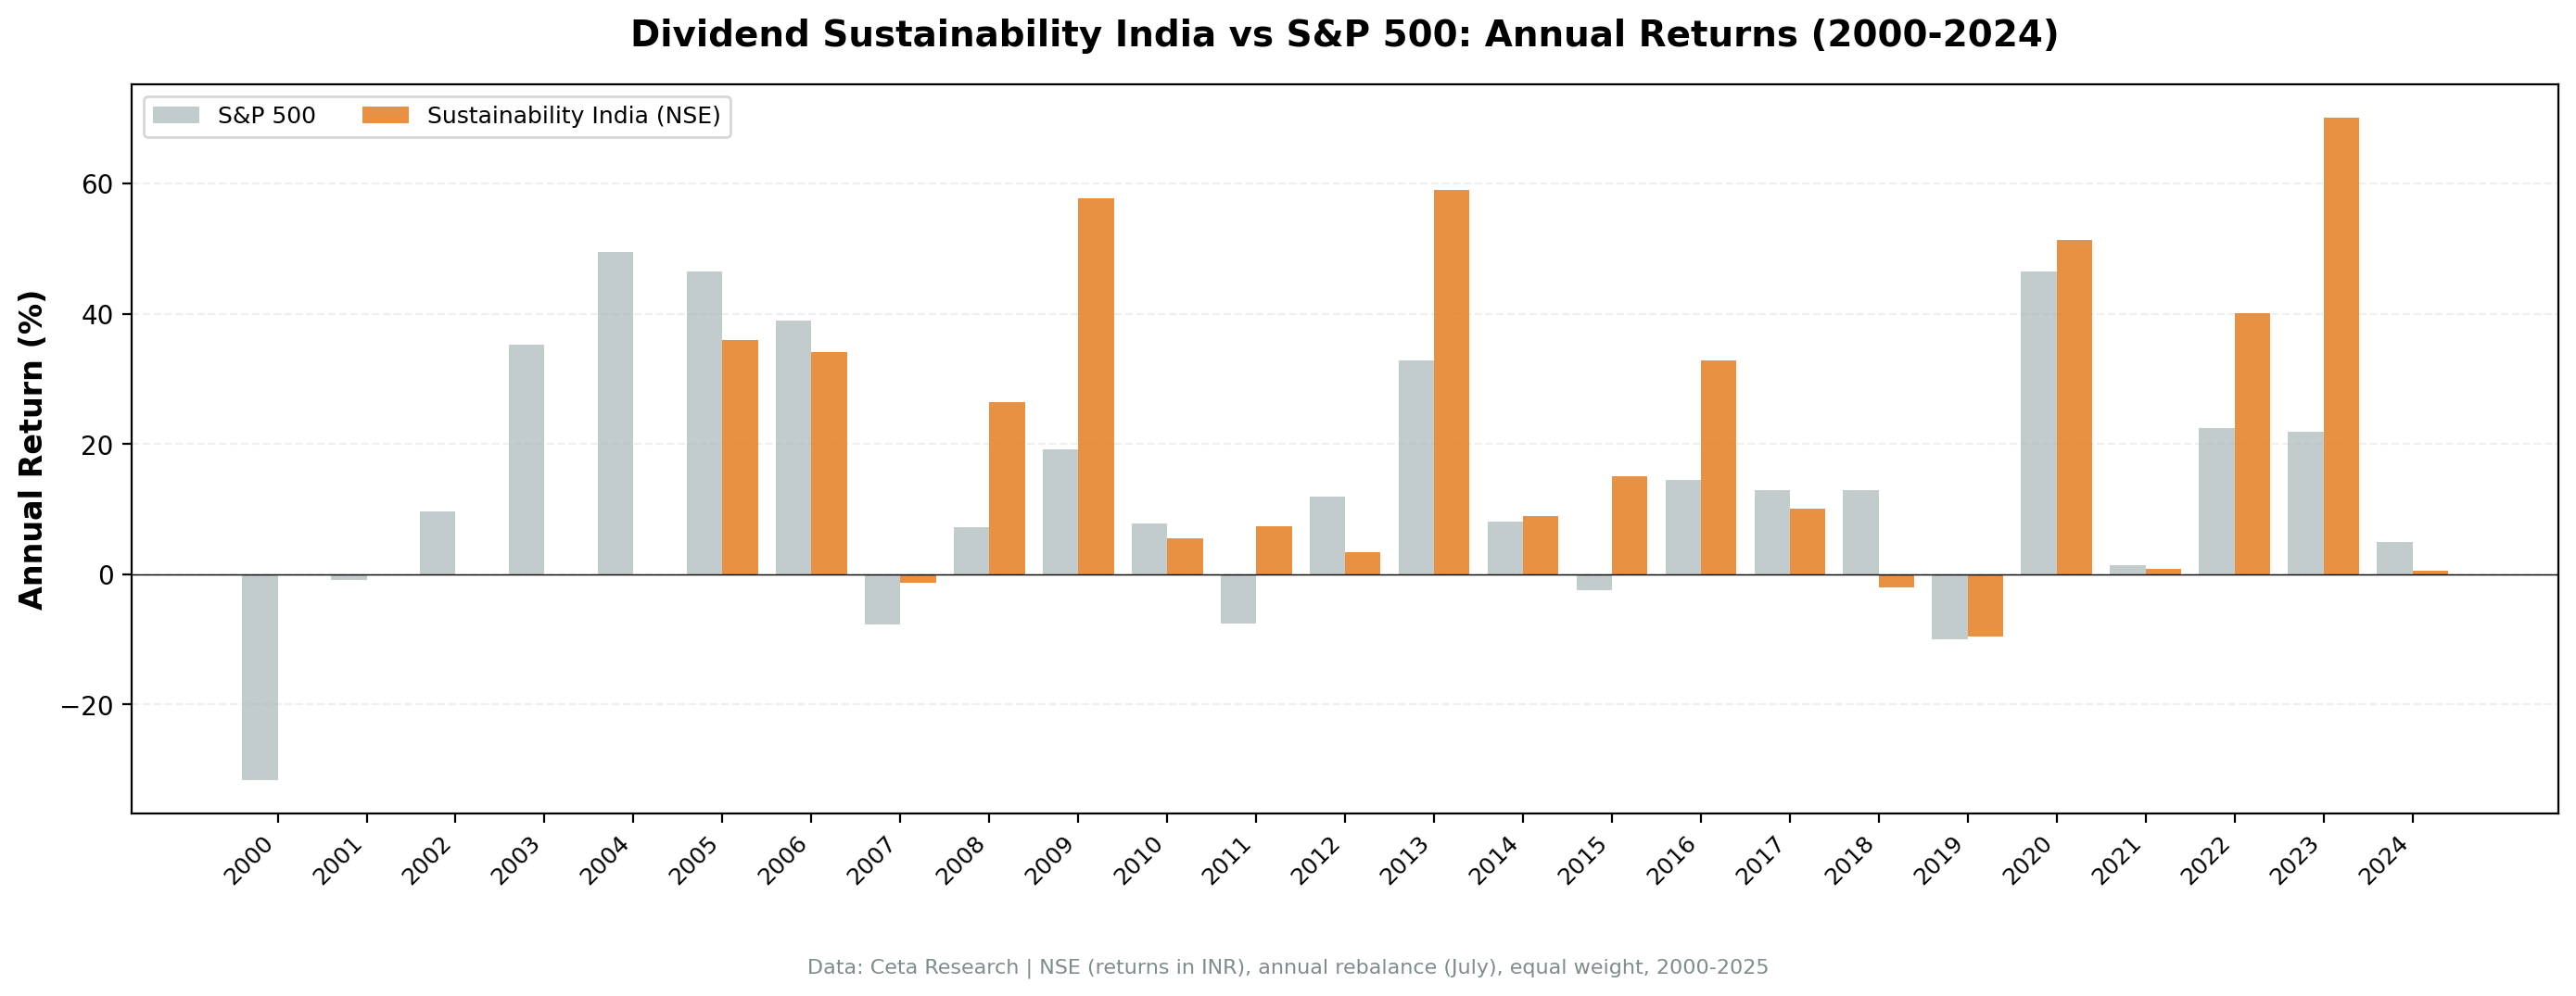
Year-by-year returns
| Year | Sustainability | Sensex | Excess |
|---|---|---|---|
| 2000 | 0.0% (cash) | -31.6% | +31.6% |
| 2001 | 0.0% (cash) | -0.8% | +0.8% |
| 2002 | 0.0% (cash) | +9.6% | -9.6% |
| 2003 | 0.0% (cash) | +35.2% | -35.2% |
| 2004 | 0.0% (cash) | +49.4% | -49.4% |
| 2005 | +35.9% | +46.5% | -10.6% |
| 2006 | +34.2% | +38.9% | -4.7% |
| 2007 | -1.3% | -7.7% | +6.4% |
| 2008 | +26.4% | +7.3% | +19.2% |
| 2009 | +57.7% | +19.1% | +38.6% |
| 2010 | +5.5% | +7.8% | -2.2% |
| 2011 | +7.4% | -7.5% | +14.9% |
| 2012 | +3.3% | +11.9% | -8.5% |
| 2013 | +59.1% | +32.8% | +26.3% |
| 2014 | +8.9% | +8.1% | +0.8% |
| 2015 | +15.1% | -2.4% | +17.4% |
| 2016 | +32.8% | +14.5% | +18.3% |
| 2017 | +10.1% | +12.9% | -2.9% |
| 2018 | -2.0% | +12.9% | -14.9% |
| 2019 | -9.5% | -10.0% | +0.4% |
| 2020 | +51.3% | +46.4% | +4.9% |
| 2021 | +0.9% | +1.4% | -0.6% |
| 2022 | +40.1% | +22.5% | +17.6% |
| 2023 | +70.1% | +21.8% | +48.3% |
| 2024 | +0.6% | +5.0% | -4.4% |
2008: a year of genuine protection
The Sensex returned just 7.3% in 2008 (in local currency terms). Indian NSE sustainability stocks returned +26.4%. That's 19.2% of excess in a single year. Indian companies scoring 7+ on the sustainability composite carried low debt, generated cash, and maintained strong ROE through the global financial crisis. While global banks imploded, India's dividend payers (dominated by IT services, pharma, and consumer staples) held firm.
2005-2006: first two invested years
The NSE universe didn't reach the 10-stock minimum until 2005 (BSE was included in earlier runs, which pulled in more stocks sooner). The first two invested years returned +35.9% and +34.2%. Both slightly lagged the broader Sensex, but the strategy was finding its footing in a narrower, higher-quality universe. The alpha came later once more NSE companies matured.
2020-2023: four strong years
+51.3%, +0.9%, +40.1%, +70.1%. Three of these four years exceeded 40%. The post-COVID recovery was exceptionally kind to Indian quality stocks. Low leverage, strong cash generation, and improving fundamentals were exactly what the market rewarded. 2023 stands out: +70.1% vs +21.8% for the Sensex, a 48-point gap.
Limitations
- 5 cash years at the start. NSE coverage before 2005 was thin. The strategy sat in cash from 2000-2004, which flatters early risk metrics but also means the effective invested backtest is 20 years.
- Currency risk not modeled. Returns are in local currency (INR). USD-based investors would see different results depending on INR/USD movements.
- Higher volatility. 24.1% annualized. The returns justify it, but the ride is rougher than developed markets.
- NSE only. The backtest uses NSE exclusively. Including BSE adds coverage (especially pre-2005) but introduces ~38% duplicate listings, inflating stock counts without adding independent positions. NSE-only is the cleaner, more conservative test.
Takeaway
India holds up well for the dividend sustainability screen when tested on NSE alone. 15.86% CAGR, 6.02% alpha over the Sensex, and negative down capture (-19.3%). When benchmarked against the local index, the sustainability filter consistently added value above what India's own market delivered. The strategy's max drawdown was -11.4%, the shallowest across all 13 exchanges in the study. For investors willing to accept emerging market volatility and currency exposure, NSE sustainability stocks offer strong risk-adjusted returns with genuine downside protection.
Part of a Series
This analysis is part of our dividend sustainability global exchange comparison: - Dividend Sustainability Score: US Stocks - 10.73% CAGR, full methodology - [Dividend Sustainability on German Stocks (XETRA)][GERMANY_BLOG_URL] - 12.27% CAGR, best Sharpe (0.652) - [Dividend Sustainability on Canadian Stocks (TSX)][CANADA_BLOG_URL] - 9.96% CAGR, +6.00% vs TSX Composite - [Dividend Sustainability on UK Stocks (LSE)][UK_BLOG_URL] - 9.38% CAGR, -19.21% max drawdown - [Dividend Sustainability: 13-Exchange Global Comparison][COMPARISON_BLOG_URL] - full comparison table
References
- DeAngelo, H., DeAngelo, L. & Skinner, D. (1992). "Dividends and Losses." Journal of Finance, 47(5), 1837-1863.
- Piotroski, J. (2000). "Value Investing: The Use of Historical Financial Statement Information to Separate Winners from Losers." Journal of Accounting Research, 38, 1-41.
- Benartzi, S., Michaely, R. & Thaler, R. (1997). "Do Changes in Dividends Signal the Future or the Past?" Journal of Finance, 52(3), 1007-1034.
Run This Screen Yourself
Via web UI: Run the sustainability screen on Ceta Research. The query is pre-loaded. Hit "Run" and see what passes today.
Get your API key at cetaresearch.com. The full backtest code (Python + DuckDB) is on GitHub.
Data: Ceta Research, FMP financial data warehouse. Universe: NSE, market cap > 20B INR. Annual rebalance (July), equal weight top 30 by sustainability score, 2000-2025.
Past performance does not guarantee future results. This is educational content, not investment advice.


