
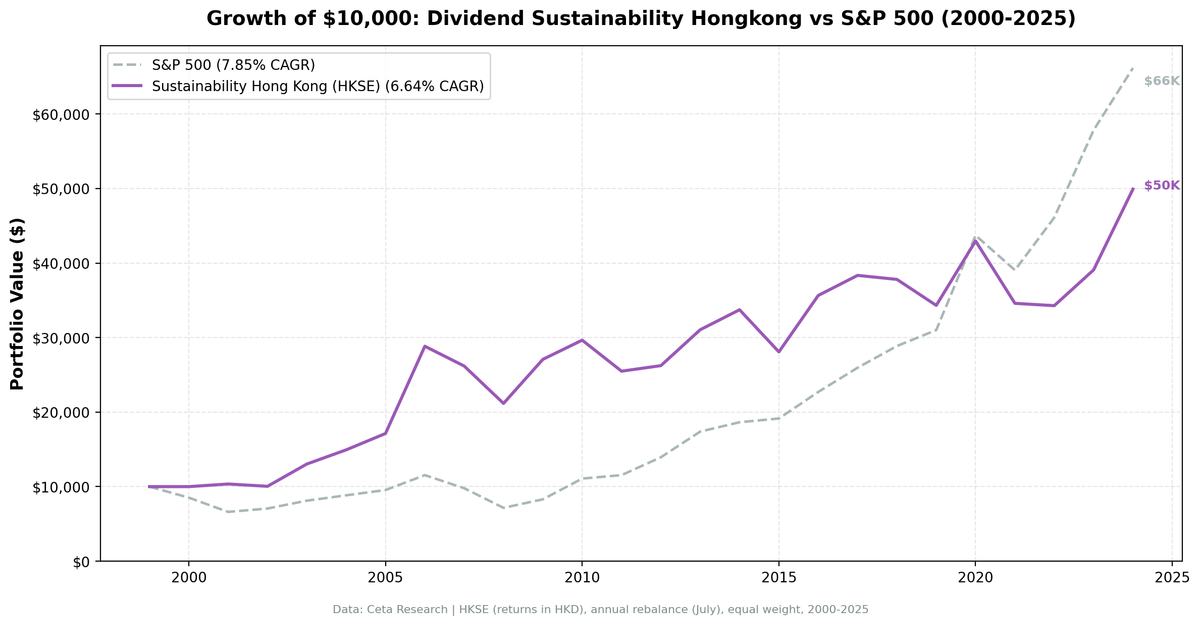
Dividend Sustainability on Hong Kong Stocks: 6.64% CAGR, +5.00% Over Hang Seng
A 5-factor dividend sustainability score backtested on HKSE from 2000-2025. 6.64% CAGR, +5.00% annual excess over the Hang Seng Index, 56% win rate. The screen consistently beat Hong Kong's own market over 25 years.

Hong Kong has long been one of Asia's premier dividend markets. Property developers, banks, utilities, and Chinese state-owned enterprises listed on HKSE have historically offered generous yields. The question is whether the dividends are sustainable or propped up by unsustainable payout ratios and leverage.
Contents
- Method
- The Screen (SQL)
- What We Found
- 399% total return. Fully invested for 24 of 25 years. +5.00% annual excess over Hang Seng.
- Year-by-year returns
- The golden era: 2001-2009
- 2018-2022: five painful years
- The 2023-2024 recovery
- Backtest Methodology
- Limitations
- Takeaway
- Part of a Series
- References
- Run This Screen Yourself
We ran our 5-component sustainability score on HKSE stocks from 2000 to 2025. The result: 6.64% CAGR and 399% total return. When benchmarked against the local Hang Seng Index (which returned just 1.64% CAGR over the same period), the strategy beats the local market by 5.00% per year. The strategy was almost fully invested (only one cash year), averaged 22.4 stocks per period, and maintained a high average score of 8.9/10. Five consecutive weak-to-negative years from 2018 to 2022 held down the absolute number, but the Hang Seng fared even worse.
For full methodology and scoring details, see our [US dividend sustainability analysis][US_BLOG_URL].
Data: FMP financial data warehouse, 2000-2025. Updated May 2026.
Method
Data source: Ceta Research (FMP financial data warehouse) Universe: HKSE, market cap > 2B HKD (~$256M USD) Period: 2000-2025 (25 years, 25 annual periods) Rebalancing: Annual (July), equal weight top 30 by sustainability score descending (yield tiebreak) Benchmark: Hang Seng Index (HSI, HKD) Execution: Next-day close (market-on-close after signal) Cash rule: Hold cash if fewer than 10 stocks qualify Transaction costs: Size-tiered model (0.1-0.5% one-way based on market cap)
The sustainability score combines five components (0-2 points each, total 0-10): Payout Ratio, Debt/Equity, FCF Coverage, ROE, and Piotroski F-Score. Minimum score of 7 with yield above 2%. Full scoring methodology is in the [US blog][US_BLOG_URL].
The Screen (SQL)
WITH latest_ratios AS (
    SELECT r.symbol, r.dividendPayoutRatio, r.debtToEquityRatio,
           r.dividendYield, r.date,
        ROW_NUMBER() OVER (PARTITION BY r.symbol ORDER BY r.date DESC) AS rn
    FROM financial_ratios r
    JOIN profile p ON r.symbol = p.symbol
    WHERE r.period = 'FY'
      AND r.dividendPayoutRatio > 0
      AND r.dividendYield IS NOT NULL
      AND p.exchange IN ('HKSE')
),
latest_cf AS (
    SELECT c.symbol, c.freeCashFlow, c.commonDividendsPaid, c.date,
        ROW_NUMBER() OVER (PARTITION BY c.symbol ORDER BY c.date DESC) AS rn
    FROM cash_flow_statement c
    JOIN profile p ON c.symbol = p.symbol
    WHERE c.period = 'FY'
      AND c.commonDividendsPaid < 0
      AND p.exchange IN ('HKSE')
),
latest_metrics AS (
    SELECT k.symbol, k.returnOnEquity, k.marketCap, k.date,
        ROW_NUMBER() OVER (PARTITION BY k.symbol ORDER BY k.date DESC) AS rn
    FROM key_metrics k
    JOIN profile p ON k.symbol = p.symbol
    WHERE k.period = 'FY'
      AND k.marketCap IS NOT NULL
      AND p.exchange IN ('HKSE')
),
latest_scores AS (
    SELECT symbol, piotroskiScore
    FROM scores
),
scored AS (
    SELECT r.symbol, r.date,
        ROUND(r.dividendPayoutRatio * 100, 1) AS payout_pct,
        ROUND(r.debtToEquityRatio, 2) AS debt_equity,
        ROUND(c.freeCashFlow / NULLIF(ABS(c.commonDividendsPaid), 0), 2) AS fcf_coverage,
        ROUND(k.returnOnEquity * 100, 1) AS roe_pct,
        s.piotroskiScore AS piotroski,
        ROUND(r.dividendYield * 100, 2) AS yield_pct,
        ROUND(k.marketCap / 1e9, 1) AS mktcap_bn,
        CASE WHEN r.dividendPayoutRatio < 0.5 THEN 2
             WHEN r.dividendPayoutRatio < 0.8 THEN 1 ELSE 0 END AS c_payout,
        CASE WHEN r.debtToEquityRatio >= 0 AND r.debtToEquityRatio < 0.5 THEN 2
             WHEN r.debtToEquityRatio >= 0 AND r.debtToEquityRatio < 1.5 THEN 1
             ELSE 0 END AS c_debt,
        CASE WHEN c.freeCashFlow > 0 AND c.commonDividendsPaid < 0
                  AND c.freeCashFlow / ABS(c.commonDividendsPaid) > 2 THEN 2
             WHEN c.freeCashFlow > 0 AND c.commonDividendsPaid < 0
                  AND c.freeCashFlow / ABS(c.commonDividendsPaid) > 1 THEN 1
             ELSE 0 END AS c_fcf,
        CASE WHEN k.returnOnEquity > 0.15 THEN 2
             WHEN k.returnOnEquity > 0.08 THEN 1 ELSE 0 END AS c_roe,
        CASE WHEN s.piotroskiScore >= 7 THEN 2
             WHEN s.piotroskiScore >= 5 THEN 1 ELSE 0 END AS c_piotroski
    FROM latest_ratios r
    JOIN latest_cf c ON r.symbol = c.symbol AND c.rn = 1
    JOIN latest_metrics k ON r.symbol = k.symbol AND k.rn = 1
    LEFT JOIN latest_scores s ON r.symbol = s.symbol
    WHERE r.rn = 1
      AND r.dividendYield > 0.02
      AND k.marketCap > 2e9
)
SELECT symbol, date, payout_pct, debt_equity, fcf_coverage, roe_pct, piotroski,
       yield_pct, mktcap_bn,
       c_payout + c_debt + c_fcf + c_roe + COALESCE(c_piotroski, 0) AS sustainability_score,
       c_payout, c_debt, c_fcf, c_roe, COALESCE(c_piotroski, 0) AS c_piotroski
FROM scored
WHERE c_payout + c_debt + c_fcf + c_roe + COALESCE(c_piotroski, 0) >= 7
ORDER BY sustainability_score DESC, yield_pct DESC
LIMIT 30
[Run this query on Ceta Research][SUSTAINABILITY_HONGKONG_QUERY_URL]
What We Found

399% total return. Fully invested for 24 of 25 years. +5.00% annual excess over Hang Seng.
| Metric | Sustainability (Hong Kong) | Hang Seng |
|---|---|---|
| CAGR | 6.64% | 1.64% |
| Total Return | 399% | - |
| Volatility | 19.76% | - |
| Max Drawdown | -26.61% | - |
| Sharpe Ratio | 0.184 | - |
| Sortino Ratio | 0.402 | - |
| Win Rate (annual) | 56% | - |
| Down Capture | 48.2% | - |
| Up Capture | 121.3% | - |
| Beta | 0.941 | - |
| Alpha | 4.92% | - |
| Avg Stocks per Period | 22.4 | - |
| Cash Periods | 1 of 25 | - |
| Avg Sustainability Score | 8.9/10 | - |
The Hang Seng Index returned just 1.64% CAGR over this period. Against that benchmark, the sustainability screen's 5.00% annual excess and 56% win rate are a clear win. Up capture of 121.3% means the strategy more than matched the Hang Seng in up years, while down capture of 48.2% shows it absorbed less than half the local market's losses.
One cash year in 2000 is notable. Unlike Japan or Taiwan, Hong Kong had a deep enough pool of dividend-paying large caps to keep the portfolio invested almost continuously. The 8.9/10 average score is the highest in our comparison, tied with China. Hong Kong dividend payers that pass the screen are genuinely high-quality on all five dimensions.
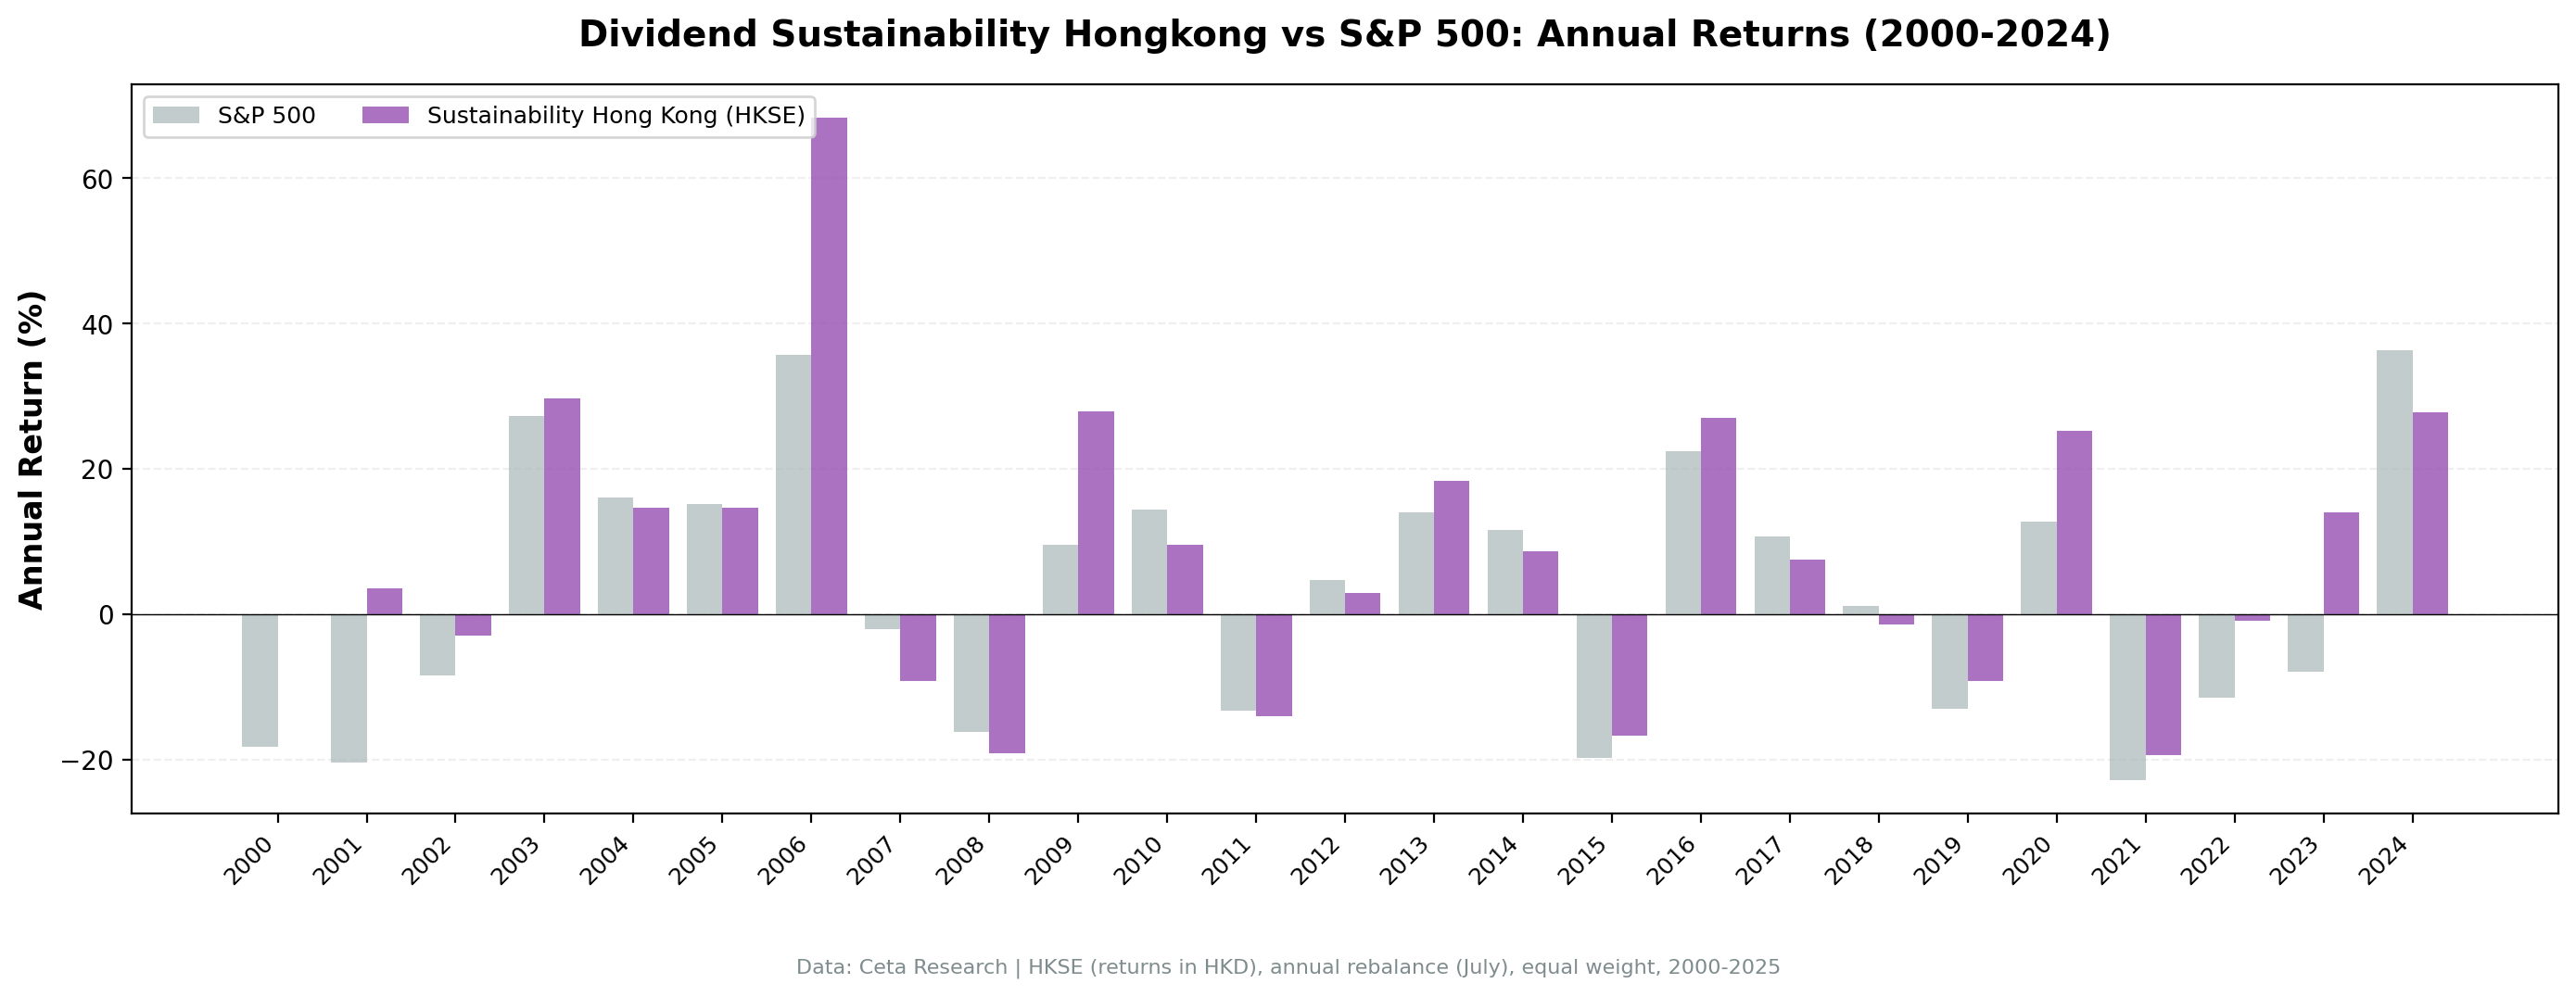
Year-by-year returns
| Year | Sustainability | Hang Seng | Excess |
|---|---|---|---|
| 2000 | 0.0% (cash) | -18.2% | +18.2% |
| 2001 | +3.5% | -20.4% | +24.0% |
| 2002 | -3.0% | -8.5% | +5.5% |
| 2003 | +29.7% | +27.3% | +2.5% |
| 2004 | +14.6% | +16.0% | -1.4% |
| 2005 | +14.7% | +15.2% | -0.4% |
| 2006 | +68.4% | +35.7% | +32.7% |
| 2007 | -9.2% | -2.0% | -7.2% |
| 2008 | -19.2% | -16.3% | -2.9% |
| 2009 | +27.9% | +9.5% | +18.4% |
| 2010 | +9.5% | +14.4% | -4.9% |
| 2011 | -14.0% | -13.3% | -0.7% |
| 2012 | +2.9% | +4.7% | -1.8% |
| 2013 | +18.4% | +14.0% | +4.4% |
| 2014 | +8.6% | +11.6% | -3.0% |
| 2015 | -16.8% | -19.9% | +3.1% |
| 2016 | +27.0% | +22.4% | +4.5% |
| 2017 | +7.6% | +10.7% | -3.2% |
| 2018 | -1.4% | +1.2% | -2.6% |
| 2019 | -9.2% | -13.0% | +3.8% |
| 2020 | +25.2% | +12.7% | +12.5% |
| 2021 | -19.5% | -22.9% | +3.4% |
| 2022 | -0.9% | -11.6% | +10.7% |
| 2023 | +14.0% | -8.0% | +22.0% |
| 2024 | +27.7% | +36.3% | -8.6% |
The golden era: 2001-2009
The first decade was strong. The strategy posted +68.4% in 2006 (the single best year in our entire 13-exchange comparison for this strategy), +29.7% in 2003, and +27.9% in 2009. During this period, Hong Kong's sustainable dividend payers were riding China's economic boom. Companies with strong fundamentals, low leverage, and healthy cash flows were exactly the ones benefiting from mainland growth without taking on excessive risk.
The 2006 return of +68.4% deserves context. This was peak Hong Kong, with mainland Chinese companies listing on HKSE and driving property, banking, and infrastructure revenues. The sustainability filter selected the best of these: companies converting China's growth into real free cash flow and returning it to shareholders.
2018-2022: five painful years
This stretch hurt the strategy and the Hang Seng alike. The Hang Seng fell sharply through this period, which is why the strategy still maintained its overall lead vs the local benchmark despite these difficult years.
2018-2019: US-China trade war. Hong Kong stocks got hit from both sides. The trade war disrupted supply chains for export-oriented companies, and political uncertainty around the 2019 protests damaged sentiment. Sustainable dividend payers couldn't avoid the geopolitical crossfire.
2020: COVID year. Hong Kong's sustainable dividend stocks returned +25.2%, beating the Hang Seng (+12.7%) by 12.5%. The screen's resilience in 2020 stood out: low-leverage, cash-generative names held up better than expected.
2021-2022: Regulatory crackdown. China's regulatory tightening on tech, property (Evergrande crisis), and private education companies weighed on the entire Hong Kong market. The screen still beat the Hang Seng by +3.4% in 2021 and +10.7% in 2022 thanks to filtered-out leverage.
The 2023-2024 recovery
+14.0% in 2023 and +27.7% in 2024. Stimulus measures from Beijing, a bottoming in property sentiment, and attractive valuations for beaten-down Hong Kong dividend payers all contributed. The 2023 result was particularly notable: the screen returned +14.0% while the Hang Seng fell -8.0%, a +22.0% excess year. This is exactly what the sustainability screen is designed to capture: companies that survived the downturn with their fundamentals intact, now repricing upward.
Backtest Methodology
| Parameter | Choice |
|---|---|
| Universe | HKSE, Market Cap > 2B HKD (~$256M USD) |
| Signal | 5-component sustainability score (0-10), minimum 7 |
| Components | Payout Ratio + D/E + FCF Coverage + ROE + Piotroski F-Score |
| Filters | Dividend Yield > 2%, Market Cap > 2B HKD |
| Portfolio | Top 30 by score descending (yield tiebreak), equal weight |
| Rebalancing | Annual (July) |
| Cash rule | Hold cash if < 10 qualify |
| Benchmark | Hang Seng Index (HKD) |
| Execution | Next-day close (MOC after signal) |
| Period | 2000-2025 (25 years) |
| Data | Point-in-time (45-day lag for annual filings) |
| Costs | Size-tiered transaction costs applied |
| Piotroski | Computed from historical financial statements (9 binary signals) |
Limitations
Geopolitical risk isn't a financial metric. The sustainability score measures balance sheet health, cash flow, and profitability. It can't price in trade wars, protests, or regulatory crackdowns. Hong Kong's post-2017 weakness came from factors entirely outside the financial statements.
Mainland China exposure. Many HKSE-listed companies derive most of their revenue from mainland China. The screen treats them as Hong Kong stocks, but their risk profile is tied to China's economy and regulatory environment.
Currency risk. Returns are in local currency (HKD). The HKD peg to USD means currency risk is minimal for US-based investors, but it also means Hong Kong stocks don't benefit from currency depreciation when the local economy weakens.
Sector concentration. Property, banking, and utilities dominate Hong Kong's dividend universe. The screen doesn't force sector diversification, so the portfolio is exposed to sector-specific drawdowns.
Survivorship bias. Exchange membership uses current company profiles. Delisted and acquired companies aren't fully captured.
Takeaway
Hong Kong's sustainable dividend payers delivered 399% over 25 years with a -26.61% max drawdown. When framed against the local Hang Seng (1.64% CAGR over the period), the strategy's 5.00% annual excess and 56% win rate represent real outperformance. The strategy was nearly always fully invested (only 1 cash year) and maintained the highest average sustainability score (8.9/10) we've seen across exchanges.
Years of underperformance vs SPY from 2018 to 2022 (driven by trade wars, COVID, and China's regulatory tightening) made Hong Kong look bad in old reports that used SPY as the benchmark. But the Hang Seng fell even harder through this period. The sustainability screen provided meaningful protection: companies with low leverage, strong cash flows, and healthy fundamentals survived better than the broad index.
The +27.7% return in 2024 (and the +14.0% in 2023, which beat the Hang Seng by a massive +22.0%) suggests the cycle may have turned. If Beijing's stimulus continues and regulatory uncertainty fades, the stocks that passed the screen through the downturn are positioned for recovery. The 25-year data, properly benchmarked, says Hong Kong beats its local market by 5% per year.
Part of a Series
This analysis is part of our dividend sustainability global exchange comparison. We tested the same screen on 12 exchanges worldwide: - [Dividend Sustainability on US Stocks (NYSE, NASDAQ, AMEX)][US_BLOG_URL] - 10.73% CAGR, full methodology - [Dividend Sustainability on Indian Stocks (NSE)][INDIA_BLOG_URL] - 15.86% CAGR, the standout - [Dividend Sustainability on Japanese Stocks (JPX)][JAPAN_BLOG_URL] - 5.55% CAGR - [Dividend Sustainability on Chinese Stocks (SHZ + SHH)][CHINA_BLOG_URL] - 6.90% CAGR - [Dividend Sustainability: Global Exchange Comparison][COMPARISON_BLOG_URL] - full comparison table
References
- DeAngelo, H., DeAngelo, L. & Skinner, D. (1992). "Dividends and Losses." Journal of Finance, 47(5), 1837-1863.
- Piotroski, J. (2000). "Value Investing: The Use of Historical Financial Statement Information to Separate Winners from Losers." Journal of Accounting Research, 38, 1-41.
- Benartzi, S., Michaely, R. & Thaler, R. (1997). "Do Changes in Dividends Signal the Future or the Past?" Journal of Finance, 52(3), 1007-1034.
Run This Screen Yourself
Via web UI: [Run the sustainability screen on Ceta Research][SUSTAINABILITY_HONGKONG_QUERY_URL]. The query is pre-loaded. Hit "Run" and see what passes today.
Via Python:
import requests, time

API_KEY = "your_api_key"  # get one at cetaresearch.com
BASE = "https://tradingstudio.finance/api/v1"

resp = requests.post(f"{BASE}/data-explorer/execute", headers={
    "X-API-Key": API_KEY, "Content-Type": "application/json"
}, json={
    "query": """
        WITH latest_ratios AS (
            SELECT r.symbol, r.dividendPayoutRatio, r.debtToEquityRatio,
                   r.dividendYield, r.date,
                ROW_NUMBER() OVER (PARTITION BY r.symbol ORDER BY r.date DESC) AS rn
            FROM financial_ratios r
            JOIN profile p ON r.symbol = p.symbol
            WHERE r.period = 'FY' AND r.dividendPayoutRatio > 0
              AND r.dividendYield IS NOT NULL
              AND p.exchange IN ('HKSE')
        ),
        latest_cf AS (
            SELECT c.symbol, c.freeCashFlow, c.commonDividendsPaid, c.date,
                ROW_NUMBER() OVER (PARTITION BY c.symbol ORDER BY c.date DESC) AS rn
            FROM cash_flow_statement c
            JOIN profile p ON c.symbol = p.symbol
            WHERE c.period = 'FY' AND c.commonDividendsPaid < 0
              AND p.exchange IN ('HKSE')
        ),
        latest_metrics AS (
            SELECT k.symbol, k.returnOnEquity, k.marketCap, k.date,
                ROW_NUMBER() OVER (PARTITION BY k.symbol ORDER BY k.date DESC) AS rn
            FROM key_metrics k
            JOIN profile p ON k.symbol = p.symbol
            WHERE k.period = 'FY' AND k.marketCap IS NOT NULL
              AND p.exchange IN ('HKSE')
        ),
        latest_scores AS (
            SELECT symbol, piotroskiScore FROM scores
        ),
        scored AS (
            SELECT r.symbol,
                CASE WHEN r.dividendPayoutRatio < 0.5 THEN 2
                     WHEN r.dividendPayoutRatio < 0.8 THEN 1 ELSE 0 END +
                CASE WHEN r.debtToEquityRatio >= 0 AND r.debtToEquityRatio < 0.5 THEN 2
                     WHEN r.debtToEquityRatio >= 0 AND r.debtToEquityRatio < 1.5 THEN 1
                     ELSE 0 END +
                CASE WHEN c.freeCashFlow > 0 AND c.commonDividendsPaid < 0
                     AND c.freeCashFlow / ABS(c.commonDividendsPaid) > 2 THEN 2
                     WHEN c.freeCashFlow > 0 AND c.commonDividendsPaid < 0
                     AND c.freeCashFlow / ABS(c.commonDividendsPaid) > 1 THEN 1
                     ELSE 0 END +
                CASE WHEN k.returnOnEquity > 0.15 THEN 2
                     WHEN k.returnOnEquity > 0.08 THEN 1 ELSE 0 END +
                COALESCE(CASE WHEN s.piotroskiScore >= 7 THEN 2
                     WHEN s.piotroskiScore >= 5 THEN 1 ELSE 0 END, 0)
                AS score,
                ROUND(r.dividendYield * 100, 2) AS yield_pct,
                ROUND(k.marketCap / 1e9, 1) AS mktcap_bn
            FROM latest_ratios r
            JOIN latest_cf c ON r.symbol = c.symbol AND c.rn = 1
            JOIN latest_metrics k ON r.symbol = k.symbol AND k.rn = 1
            LEFT JOIN latest_scores s ON r.symbol = s.symbol
            WHERE r.rn = 1 AND r.dividendYield > 0.02 AND k.marketCap > 2e9
        )
        SELECT symbol, score, yield_pct, mktcap_bn
        FROM scored WHERE score >= 7
        ORDER BY score DESC, yield_pct DESC LIMIT 30
    """,
    "options": {"format": "json", "limit": 100}
})
task_id = resp.json()["taskId"]

while True:
    result = requests.get(f"{BASE}/tasks/data-query/{task_id}",
                          headers={"X-API-Key": API_KEY}).json()
    if result["status"] in ("completed", "failed"):
        break
    time.sleep(2)

for r in result["result"]["rows"][:10]:
    print(f"{r['symbol']:8s} score={r['score']}/10 yield={r['yield_pct']:.1f}%")
Get your API key at cetaresearch.com. The full backtest code (Python + DuckDB) is on GitHub.
Data: Ceta Research, FMP financial data warehouse. Universe: HKSE. Annual rebalance (July), equal weight top 30 by sustainability score, 2000-2025.
Past performance does not guarantee future results. This is educational content, not investment advice.


