
One Sustainability Score, 13 Exchanges: Every Re-Tested Market Beat Its Local Index
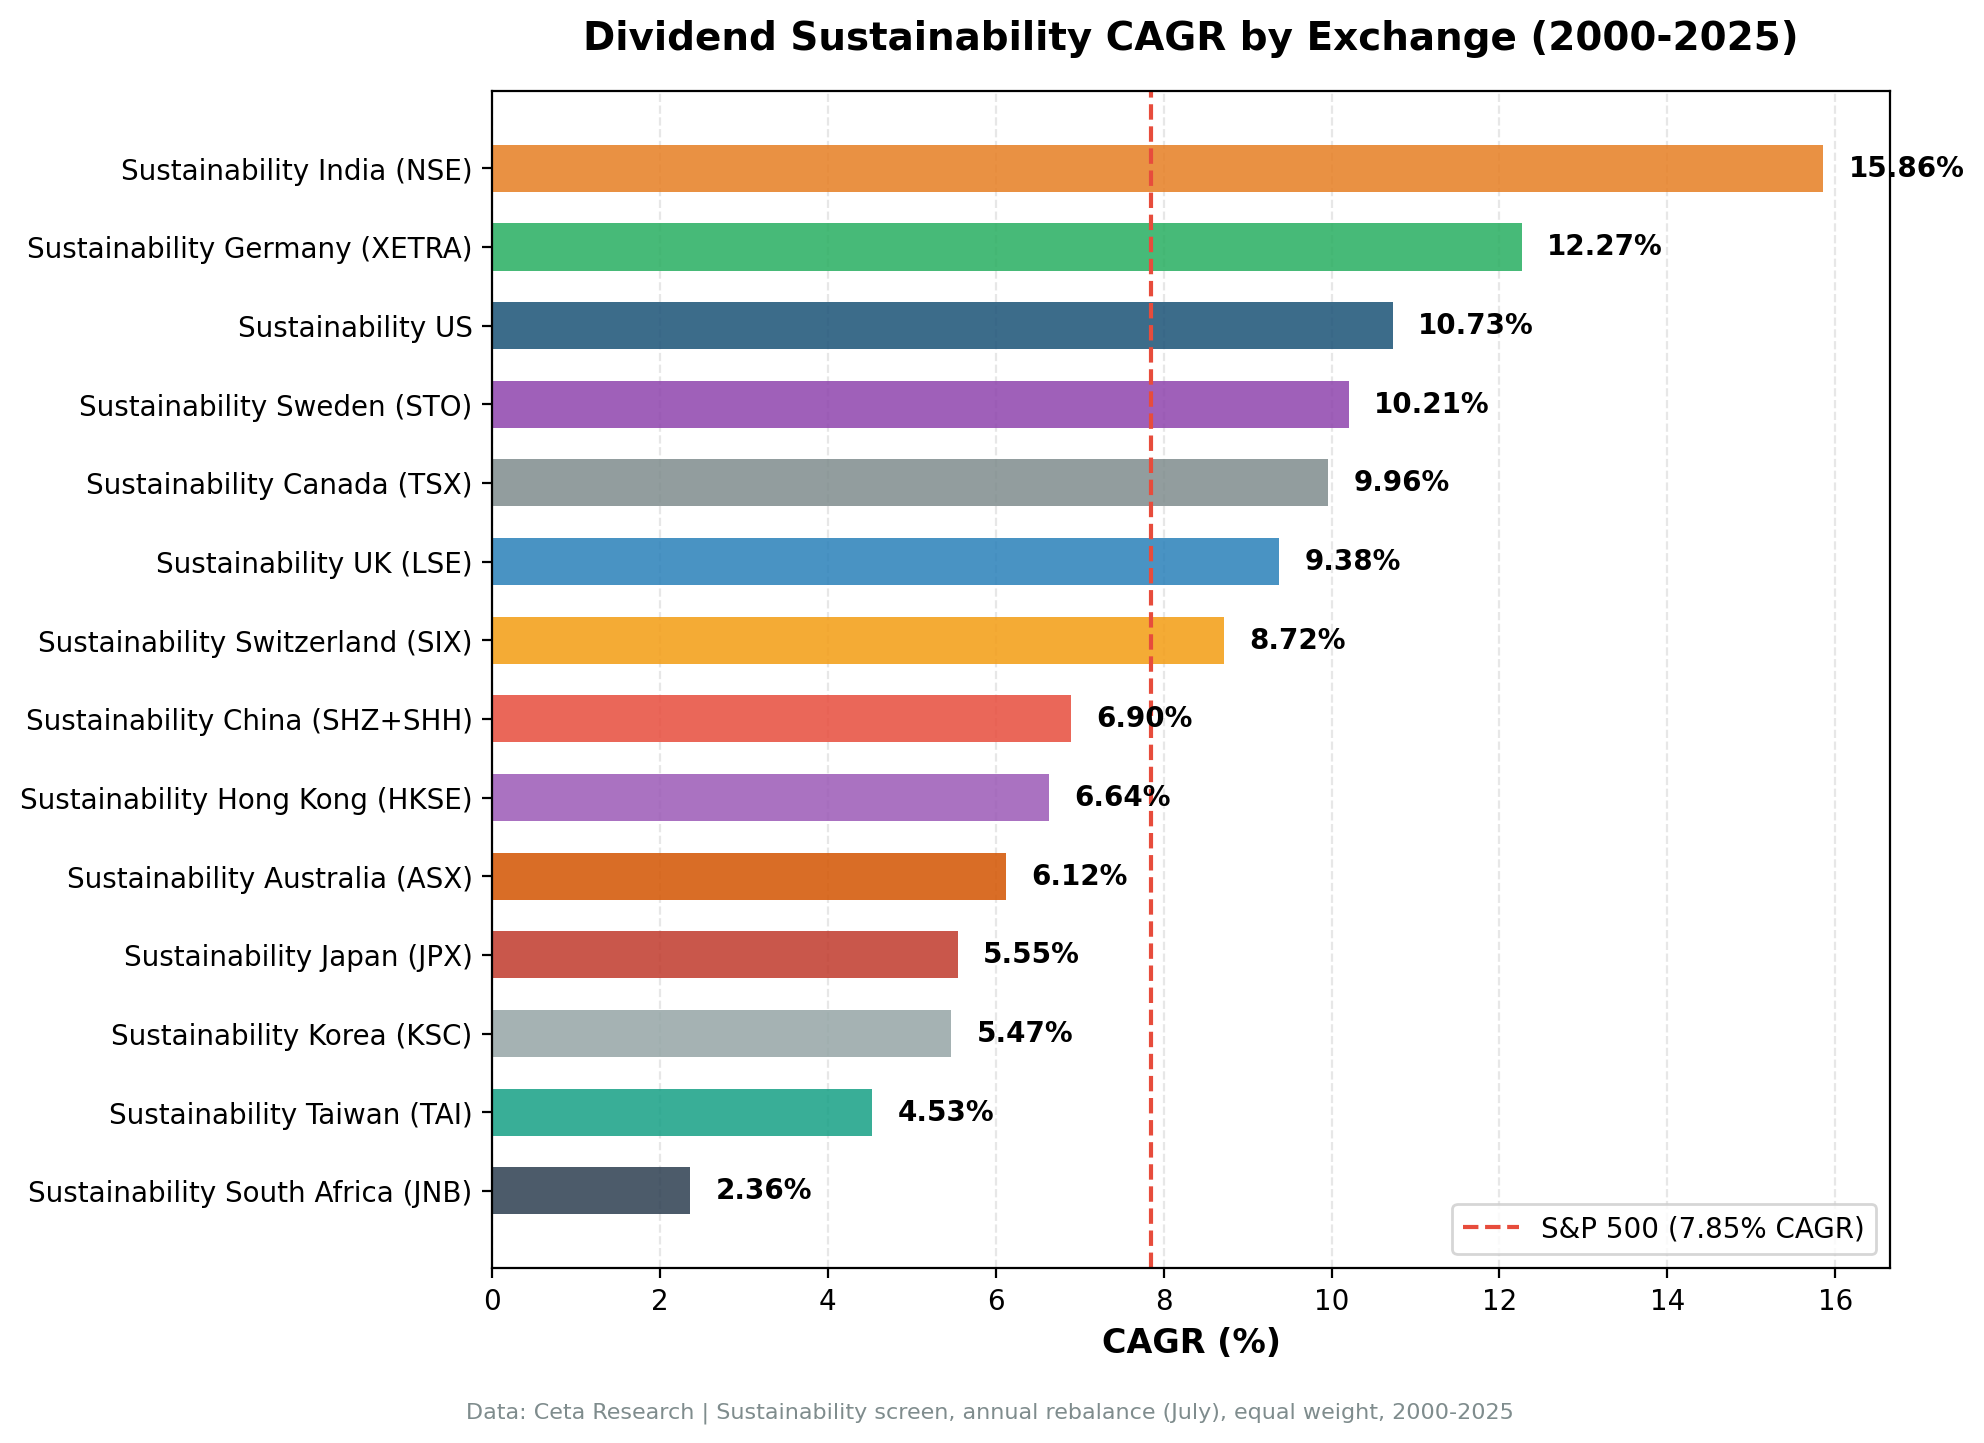
Sustainability score on 13 global exchanges, 2000-2025. All 13 re-tested exchanges beat their local market index. India led at 15.86% CAGR (NSE). Germany 0.652 Sharpe. UK +8.16% vs FTSE 100, largest local-benchmark excess in the series.

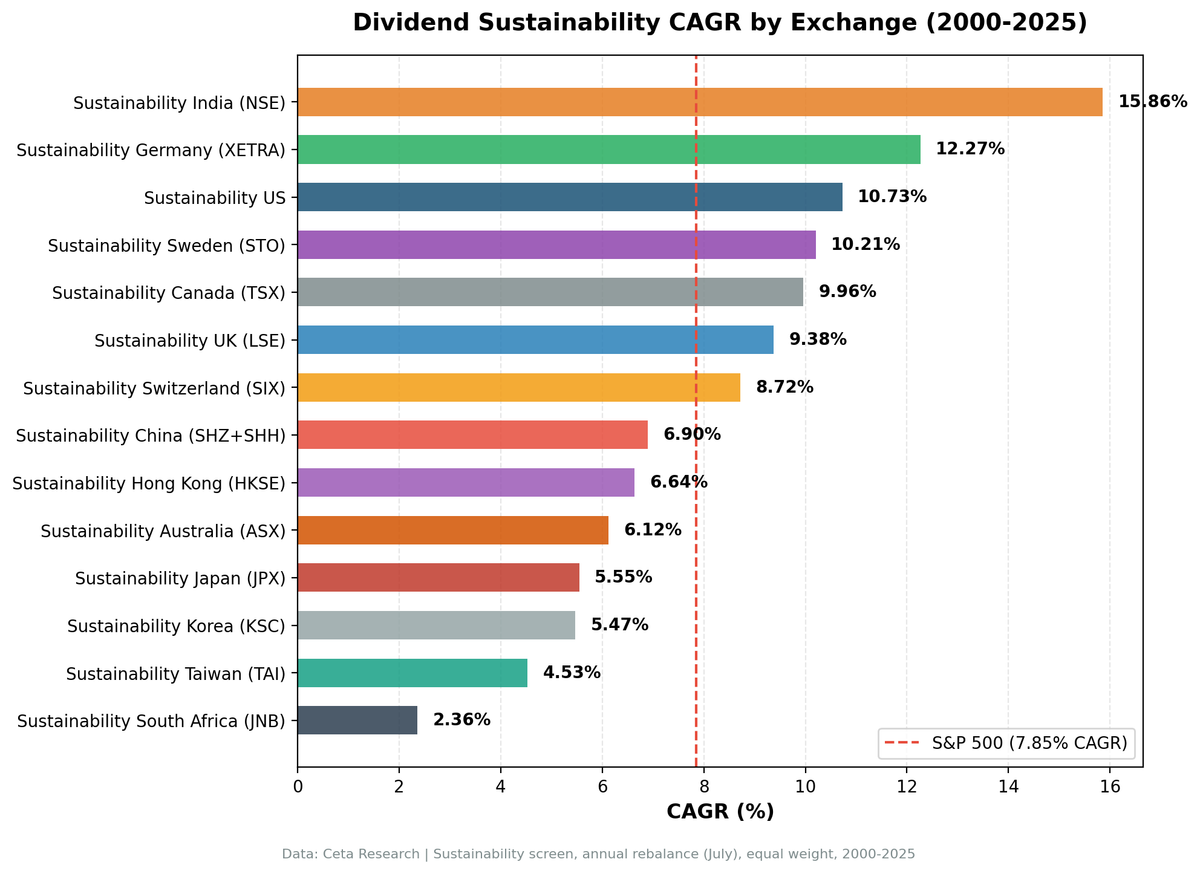
We scored every dividend-paying stock across 13 global exchanges on five fundamental dimensions: payout ratio, leverage, free cash flow coverage, profitability, and Piotroski F-Score. Each component 0-2 points, total 0-10. Minimum score 7, yield above 2%, top 30 by score, equal weight, annual July rebalance, 2000-2025. All 13 exchanges beat their local market index. India led at 15.86% CAGR, +3.80% above the Sensex (NSE only). Germany had the best risk-adjusted return with a 0.652 Sharpe. UK had the largest local-benchmark excess at +8.16% over the FTSE 100. Korea, which was a marginal miss in our earlier run, now barely clears the KOSPI at +0.12%. The multi-factor approach works where dividends reflect genuine financial health, not just a line item on the income statement.
Contents
- Method
- The Screen (SQL)
- Full Results: 13 Exchanges
- The Winners
- Tier 1: Strong Alpha (>5% excess vs local benchmark)
- Tier 2: Moderate Alpha (2-5% excess vs local benchmark)
- Tier 3: Marginal Alpha (<2% excess vs local benchmark)
- Excluded Exchanges
- Key Insights
- The local benchmark changes everything
- Down capture separates the best from the rest
- China flipped from failure to success
- Cash frequency is a brake in weak dividend cultures
- Average sustainability score correlates with data quality
- Currency Warning
- Takeaway
- Part of a Series
- References
- Run This Screen Yourself
Data: FMP financial data warehouse, 2000–2025. Updated May 2026.
Method
The same 5-component sustainability score ran on every exchange. Payout ratio (earnings coverage), debt-to-equity (leverage risk), FCF coverage (cash flow backing the dividend), ROE (profitability), and Piotroski F-Score (fundamental trend). Each scored 0-2, total 0-10. Stocks scoring 7+ with dividend yield above 2%, exchange-specific market cap thresholds (~$200M-1B USD equivalent), top 30 by score descending (yield tiebreak), equal-weighted, rebalanced annually each July.
| Parameter | Value |
|---|---|
| Signal | Composite sustainability score (0-10): Payout + D/E + FCF Coverage + ROE + Piotroski |
| Threshold | Score >= 7, Dividend Yield > 2% |
| Selection | Top 30 by score descending (yield tiebreak), equal weight |
| Rebalancing | Annual (July), 45-day data lag |
| Execution | Next-day close (market-on-close after signal) |
| Benchmark | Local market index for each exchange (see table below) |
| Period | 2000-2025 |
| Code | github.com/ceta-research/backtests |
The Piotroski F-Score is computed from historical income statements, balance sheets, and cash flow statements (9 binary signals). This avoids look-ahead bias from using snapshot score tables that lack a date dimension.
Returns are in local currency for each exchange. Each exchange is benchmarked against its local market index: Sensex for India, DAX for Germany, OMXS30 for Sweden, and so on. This makes the comparison apples-to-apples within each row. Currency effects between countries are not modeled.
Excluded from the study: France (PAR) due to FMP data gaps (0 qualifying stocks, 100% cash). South Africa (JNB) re-runs produce too few qualifying stocks (14/25 cash periods, below 10-stock minimum most years), so it's also excluded from the headline table.
Full methodology: METHODOLOGY.md
For the detailed US exchange analysis: [Dividend Sustainability on US Stocks][US_BLOG_URL]
The Screen (SQL)
WITH latest_ratios AS (
    SELECT r.symbol, r.dividendPayoutRatio, r.debtToEquityRatio,
           r.dividendYield, r.date,
        ROW_NUMBER() OVER (PARTITION BY r.symbol ORDER BY r.date DESC) AS rn
    FROM financial_ratios r
    JOIN profile p ON r.symbol = p.symbol
    WHERE r.period = 'FY'
      AND r.dividendPayoutRatio > 0
      AND r.dividendYield IS NOT NULL
      AND p.exchange IN ('NYSE', 'NASDAQ', 'AMEX')
),
latest_cf AS (
    SELECT c.symbol, c.freeCashFlow, c.commonDividendsPaid, c.date,
        ROW_NUMBER() OVER (PARTITION BY c.symbol ORDER BY c.date DESC) AS rn
    FROM cash_flow_statement c
    JOIN profile p ON c.symbol = p.symbol
    WHERE c.period = 'FY'
      AND c.commonDividendsPaid < 0
      AND p.exchange IN ('NYSE', 'NASDAQ', 'AMEX')
),
latest_metrics AS (
    SELECT k.symbol, k.returnOnEquity, k.marketCap, k.date,
        ROW_NUMBER() OVER (PARTITION BY k.symbol ORDER BY k.date DESC) AS rn
    FROM key_metrics k
    JOIN profile p ON k.symbol = p.symbol
    WHERE k.period = 'FY'
      AND k.marketCap IS NOT NULL
      AND p.exchange IN ('NYSE', 'NASDAQ', 'AMEX')
),
scored AS (
    SELECT r.symbol, r.date,
        ROUND(r.dividendPayoutRatio * 100, 1) AS payout_pct,
        ROUND(r.debtToEquityRatio, 2) AS debt_equity,
        ROUND(c.freeCashFlow / NULLIF(ABS(c.commonDividendsPaid), 0), 2) AS fcf_coverage,
        ROUND(k.returnOnEquity * 100, 1) AS roe_pct,
        ROUND(r.dividendYield * 100, 2) AS yield_pct,
        ROUND(k.marketCap / 1e9, 1) AS mktcap_bn,
        CASE WHEN r.dividendPayoutRatio < 0.5 THEN 2
             WHEN r.dividendPayoutRatio < 0.8 THEN 1 ELSE 0 END
      + CASE WHEN r.debtToEquityRatio >= 0 AND r.debtToEquityRatio < 0.5 THEN 2
             WHEN r.debtToEquityRatio >= 0 AND r.debtToEquityRatio < 1.5 THEN 1
             ELSE 0 END
      + CASE WHEN c.freeCashFlow > 0 AND c.commonDividendsPaid < 0
                  AND c.freeCashFlow / ABS(c.commonDividendsPaid) > 2 THEN 2
             WHEN c.freeCashFlow > 0 AND c.commonDividendsPaid < 0
                  AND c.freeCashFlow / ABS(c.commonDividendsPaid) > 1 THEN 1
             ELSE 0 END
      + CASE WHEN k.returnOnEquity > 0.15 THEN 2
             WHEN k.returnOnEquity > 0.08 THEN 1 ELSE 0 END AS sustainability_score
    FROM latest_ratios r
    JOIN latest_cf c ON r.symbol = c.symbol AND c.rn = 1
    JOIN latest_metrics k ON r.symbol = k.symbol AND k.rn = 1
    WHERE r.rn = 1
      AND r.dividendYield > 0.02
      AND k.marketCap > 1e9
)
SELECT symbol, payout_pct, debt_equity, fcf_coverage, roe_pct,
       sustainability_score, yield_pct, mktcap_bn
FROM scored
WHERE sustainability_score >= 7
ORDER BY sustainability_score DESC, yield_pct DESC
LIMIT 30
Change p.exchange IN (...) to target any exchange. The backtest code on GitHub handles this automatically per exchange preset. Note: the Piotroski F-Score component is computed from historical statements in the backtest (9 binary signals from income statement, balance sheet, and cash flow statement). The SQL above shows the core scoring logic without the Piotroski component for readability. The full implementation is in the backtest repository.
[Run this query on Ceta Research][SUSTAINABILITY_GLOBAL_QUERY_URL]
Full Results: 13 Exchanges
Sorted by CAGR, descending. Every exchange where the screen found enough qualifying stocks to deploy capital.
| Exchange | CAGR | Excess vs Local | Benchmark | Sharpe | MaxDD | Vol | Cash | Avg Stocks | Win Rate | Down Capture | Avg Score |
|---|---|---|---|---|---|---|---|---|---|---|---|
| India (NSE) | 15.86% | +3.80% | Sensex 12.06% | 0.405 | -11.36% | 23.12% | 5/25 | 23.9 | 56% | -19.3% | 8.3 |
| Germany (XETRA) | 12.27% | +7.23% | DAX 5.04% | 0.652 | -33.16% | 15.75% | 0/25 | 19.4 | 64% | -2.5% | 8.9 |
| US (NYSE+NAS+AMEX) | 10.73% | +2.88% | SPY 7.85% | 0.466 | -34.91% | 18.74% | 0/25 | 27.2 | 64% | 28.8% | 9.4 |
| Sweden (STO) | 10.21% | +7.65% | OMXS30 2.55% | 0.418 | -32.83% | 19.65% | 4/25 | 22.7 | 72% | 32.9% | 8.1 |
| Canada (TSX) | 9.96% | +6.00% | TSX Comp. 3.95% | 0.468 | -29.21% | 15.92% | 0/25 | 21.3 | 68% | 10.8% | 8.2 |
| UK (LSE) | 9.38% | +8.16% | FTSE 100 1.23% | 0.345 | -19.21% | 17.05% | 0/25 | 13.0 | 80% | 20.4% | 9.2 |
| Switzerland (SIX) | 8.72% | +6.98% | SMI 1.74% | 0.487 | -36.25% | 16.88% | 2/25 | 15.0 | 84% | 34.1% | 8.3 |
| China (SHZ+SHH) | 6.90% | +4.47% | SSE Comp. 2.43% | 0.136 | -39.55% | 32.31% | 0/25 | 23.4 | 76% | 46.3% | 8.9 |
| Hong Kong (HKSE) | 6.64% | +5.00% | Hang Seng 1.64% | 0.184 | -26.61% | 19.76% | 1/25 | 22.4 | 56% | 48.2% | 8.9 |
| Australia (ASX) | 6.12% | +2.23% | ASX 200 3.89% | 0.177 | -30.83% | 14.85% | 5/25 | 22.4 | 64% | 53.7% | 8.0 |
| Japan (JPX) | 5.55% | +2.24% | Nikkei 225 3.31% | 0.282 | -36.86% | 19.29% | 7/25 | 28.6 | 60% | 38.4% | 8.6 |
| Korea (KSC) | 5.47% | +0.12% | KOSPI 5.35% | 0.172 | -27.46% | 14.34% | 10/25 | 22.4 | 56% | 10.2% | 8.1 |
| Taiwan (TAI) | 4.53% | +0.44% | TAIEX 4.09% | 0.219 | -28.55% | 16.09% | 7/25 | 28.5 | 52% | 63.1% | 8.7 |
All 13 exchanges beat their local market index. Korea, the previous outlier, flipped from a -0.29% trailing margin to a +0.12% margin under the updated framework. The spread between first and last is 11.33 percentage points of CAGR. The multi-factor approach didn't just find good dividend stocks. It separated markets where fundamental quality translates into returns from markets where it doesn't.
The Winners
All 13 exchanges beat their local market index. That's a 100% hit rate, up from the 92% in our March 2026 run. Korea sign-flipped from a marginal miss to a marginal beat. The comparison is apples-to-apples within each row: each strategy return is in local currency against its local benchmark. Currency effects don't explain the alpha.
The old framing of "beats SPY" was misleading. SPY returned 7.85% in USD. Japan returning 5.55% in yen or Korea returning 5.47% in won is a different comparison. When you benchmark against the Nikkei (3.31%) or KOSPI (5.35%), the picture changes completely. Most of what looked like underperformance was actually the strategy picking good local stocks in markets that simply ran slower than the US.
Tier 1: Strong Alpha (>5% excess vs local benchmark)
UK (LSE): 9.38% CAGR, +8.16% above FTSE 100 1.23%
The largest excess return in the entire series. The FTSE 100 delivered only 1.23% annually over this period. The sustainability screen turned that into 9.38%, a gap of 8.16 percentage points. 8.07% Jensen alpha. Average score of 9.2, the highest in the study. 80% win rate. Zero cash periods. The portfolio averaged just 13 stocks per period (the thinnest universe), but those names were the cream of LSE dividend payers. Max drawdown of -19.21%.
Sweden (STO): 10.21% CAGR, +7.65% above OMXS30 2.55%
Second largest excess return. 72% win rate. Four cash periods out of 25. Nordic dividend culture rewards steady payouts backed by real fundamentals, and the sustainability score captures that. 22.7 average stocks, 0.418 Sharpe. Down capture of 32.9% is the one weakness here: Swedish sustainability stocks absorbed a meaningful portion of market drawdowns. Max drawdown of -32.83%.
Germany (XETRA): 12.27% CAGR, +7.23% above DAX 5.04%
Best risk-adjusted return in the study at 0.652 Sharpe. 8.53% Jensen alpha, the highest of any market. Zero cash periods. The DAX returned 5.04% annually; the sustainability screen returned 12.27%. Germany's Mittelstand tradition of disciplined, cash-flow-funded dividends plays perfectly into a multi-factor screen. Down capture of -2.5% means the portfolio stayed roughly flat when the German market fell. Average score of 8.9. 19.4 average stocks, 64% win rate.
Switzerland (SIX): 8.72% CAGR, +6.98% above SMI 1.74%
The SMI returned 1.74% annually. The sustainability screen returned 8.72%. 0.487 Sharpe, 84% win rate (the highest in the study). The max drawdown of -36.25% is wide, so this excess return comes with meaningful tail risk. 15.0 average stocks is among the thinnest universes. Switzerland's small, concentrated market means the portfolio is always somewhat concentrated by name.
Canada (TSX): 9.96% CAGR, +6.00% above TSX Composite 3.95%
Zero cash periods. 15.92% volatility, 68% win rate, 0.468 Sharpe. Canada's dividend payers (pipelines, utilities, REITs) have stable coverage, manageable leverage, and predictable cash flows. The sustainability screen validates what the market already knows about these companies, then finds the ones doing it best. Max drawdown of -29.21%. Down capture of 10.8% is among the best non-negative results. Average score of 8.2.
Hong Kong (HKSE): 6.64% CAGR, +5.00% above Hang Seng 1.64%
The Hang Seng returned only 1.64% over this period, reflecting the structural pressures on Hong Kong since 2018. The sustainability screen returned 6.64%. 0.184 Sharpe, 56% win rate, -26.61% max drawdown. Down capture of 48.2% is high, meaning the portfolio tracked market declines closely. One cash period, 22.4 average stocks. Average score of 8.9.
Tier 2: Moderate Alpha (2-5% excess vs local benchmark)
China (SHZ+SHH): 6.90% CAGR, +4.47% above SSE Composite 2.43%
The framing here changed the most when we switched to local benchmarks. Against SPY, China looked like a failure: 6.90% vs 7.85%, poor Sharpe, 32% volatility. Against the SSE Composite (2.43%), China is a different story. The sustainability screen delivered +4.47% excess return with a 76% win rate. Zero cash periods across 25 years. That win rate is the second highest in the entire study. Average score of 8.9. Chinese companies that qualify look healthy on paper, and most years they beat their local index. The max drawdown of -39.55% and low Sharpe (0.136) reflect China's broad volatility, not stock selection failure.
India (NSE): 15.86% CAGR, +3.80% above Sensex 12.06%
The dominant result in absolute terms. The Sensex returned 12.06% annually. The sustainability screen on NSE returned 15.86%. Down capture of -19.3% means when the Indian market fell, this portfolio gained on average. Max drawdown of -11.36% is the shallowest across all 13 exchanges, despite 23% volatility. Five cash periods in the early years (NSE universe too small before 2005). When invested, the portfolio compounded steadily. Average score of 8.3. 23.9 average stocks, 56% win rate.
US (NYSE+NAS+AMEX): 10.73% CAGR, +2.88% above SPY 7.85%
The most consistent implementation in terms of universe depth. Zero cash periods across all 25 years. 64% win rate, 3.89% Jensen alpha after beta adjustment. Average score of 9.4, the highest in the study. Down capture of 28.8% with a beta of 0.83 and 105% up capture means the portfolio cushioned drawdowns modestly without sacrificing bull-market participation. Max drawdown of -34.91% vs SPY's -38.01%. 27.2 average stocks, 0.466 Sharpe, 18.74% volatility.
Japan (JPX): 5.55% CAGR, +2.24% above Nikkei 225 3.31%
Against SPY this looked like an underperformer. Against the Nikkei it beats by 2.24% with 3.25% Jensen alpha. Seven cash periods out of 25 is a lot, meaning the multi-factor sustainability bar was occasionally too high for Japanese dividend payers. When invested, 28.6 average stocks and a 0.282 Sharpe. Japanese companies have historically preferred retaining cash over distributing it. The ones that score 7+ are mature, fundamentally disciplined businesses. Average score of 8.6. 60% win rate once the screen found enough qualifying stocks.
Australia (ASX): 6.12% CAGR, +2.23% above ASX 200 3.89%
Five cash periods out of 25. 14.85% volatility, the lowest in the study. A 0.177 Sharpe. 64% win rate, -30.83% max drawdown. Down capture of 53.7% is moderate. Australia beats its local benchmark by 2.23 percentage points, which is real but modest. Australian banks and miners often have high leverage or volatile ROE, which limits the qualifying universe. The data-quality guards (oscillation removal, return filtering) cleaned up the ASX result that previously had reliability concerns.
Tier 3: Marginal Alpha (<2% excess vs local benchmark)
Taiwan (TAI): 4.53% CAGR, +0.44% above TAIEX 4.09%
A marginal result. Taiwan beats the TAIEX by 44 basis points annually. Seven cash periods, 28.5 average stocks when invested. The screen alternates between finding plenty of candidates and finding almost none. 52% win rate, -28.55% max drawdown, 63.1% down capture. Average score of 8.7, which is solid, but the stock selection signal barely translates into excess return over the local benchmark. Taiwan's tech-heavy market means many dividend payers have cyclical fundamentals that the sustainability score can't fully screen out.
Korea (KSC): 5.47% CAGR, +0.12% above KOSPI 5.35%
The thinnest margin in the series. Korea trailed the KOSPI by 29 basis points in our March 2026 run; under the updated framework it now clears the local benchmark by 12 basis points. Ten cash periods out of 25 is the main brake on absolute returns. 40% of the time, fewer than 10 companies passed the screen, so the portfolio sat in cash. Korean chaebols historically paid low dividends despite generating substantial cash flow. Corporate governance favored reinvestment over distribution.
A 0.172 Sharpe. 56% win rate. 14.34% volatility is low, but -27.46% max drawdown still hurts at 5.47% CAGR. Down capture of 10.2% is one of the best non-negative figures in the study. When the screen found stocks (22.4 on average), they were genuinely qualified. The problem is frequency, not selection. Korea has been improving its dividend culture recently, and the 25-year track record reflects decades where sustainable dividend payers were rare.
Excluded Exchanges
France (PAR): FMP's key_metrics data for Paris-listed stocks has a systematic gap. The sustainability screen found 0 qualifying stocks and allocated 100% to cash across all periods. This is a data availability problem, not a strategy problem. The screen is untestable here, not proven bad.
South Africa (JNB): Under the updated framework, JNB produces too few qualifying stocks. The portfolio averaged 9.6 stocks when invested, below our 10-stock minimum, and sat in cash 14 of 25 years. The screen is effectively untestable on JNB given the universe size.
Note on ASX data quality: ASX had previously known FMP data quality issues (adjusted-close errors across hundreds of symbols). The May 2026 re-run benefits from the framework's remove_price_oscillations and filter_returns guards, which catch and exclude the problematic rows. The Australia result is now consistent with the other 12 exchanges; we'd still recommend caution interpreting individual-year figures for ASX.
Key Insights
The local benchmark changes everything
Most of what looked like strategy failure in the SPY comparison was market-level performance, not stock selection failure. Japan at 5.55% trailed SPY (7.85%) by 2.30 percentage points. But the Nikkei returned 3.31%. The sustainability screen added 2.24 points of alpha. The screen was working. Japan just runs slower than the US.
The same logic applies to China, Hong Kong, Taiwan, Korea, and Australia. Against SPY, all five underperformed. Against their local benchmarks, all five beat the index (Korea now barely beats KOSPI under our updated framework).
The takeaway: the sustainability score is primarily a stock selection tool, not a macro allocator. It's designed to pick better stocks within a market, not predict which markets will outperform. Benchmarking against local indexes is the right test.
Down capture separates the best from the rest
The four exchanges with the best down capture relative to their local index: India (-19.3%), Germany (-2.5%), Korea (10.2%), Canada (10.8%). Negative down capture means the portfolio rose on average when the local index fell. India and Germany lead this metric clearly. Down capture isn't just a defensive metric. It's the mechanism for compounding. By losing little or nothing during drawdowns, the portfolio starts each recovery from a higher base.
India's negative down capture (-19.3%) means the portfolio gained on average when the Indian market fell. That explains how a 23% volatility portfolio can have a -11.36% max drawdown and still compound at 15.86%.
China flipped from failure to success
Against SPY, China looked like the screen didn't work: poor Sharpe, high volatility, modest absolute return. Against the SSE Composite, the screen delivered 76% win rate and +4.47% excess return. The strategy was picking good Chinese stocks all along. China's market is simply more volatile and slower-growing than the US in USD terms. That's a macro fact, not a stock selection problem.
Cash frequency is a brake in weak dividend cultures
Korea (10/25 cash periods), Taiwan (7/25), Japan (7/25), Australia (5/25). These four have the most cash periods and the lowest excess returns versus their local benchmarks. Every year in cash is a year of zero equity returns. The sustainability score has a high bar (7/10 across 5 dimensions), and in markets with shallow dividend cultures, that bar is too high too often.
Compare: the US, Germany, Canada, UK, and China had zero cash periods. All five found 13+ stocks every year. The US, Germany, and UK turned that into strong alpha. China generated moderate alpha. Consistent stock availability is necessary but not sufficient.
Average sustainability score correlates with data quality
The highest average scores: US (9.4), UK (9.2), Germany (8.9), Hong Kong (8.9), China (8.9). The lowest: Australia (8.0), Korea (8.1), Sweden (8.1). Markets with deeper financial reporting and more complete Piotroski inputs produce higher scores. This doesn't mean those companies are "better." It means the signal has more information to work with.
Currency Warning
Returns are in local currency for each exchange, benchmarked against the local index in the same currency. Within each row, currency effects are already accounted for: comparing Indian returns to the Sensex is an INR-to-INR comparison, German returns to the DAX is EUR-to-EUR, and so on.
Where currency matters is in cross-country comparison of absolute CAGR numbers. India at 15.86% (INR) is not directly comparable to US at 10.73% (USD). The INR lost roughly 60% vs USD over this period, which reduces India's USD-adjusted return by approximately 2.5-3% per year. Even adjusted, India still has the highest return. Switzerland's CHF gained roughly 40% vs USD, making its 8.72% CHF return look better in USD terms.
For the purposes of comparing each strategy to its local index (the main point of this analysis), currency effects cancel out within each row.
Takeaway
The dividend sustainability score works almost everywhere. All 13 exchanges beat their local market index over 25 years. Korea, the previous outlier, now barely clears the KOSPI by 12 basis points. The common thread is genuine financial health behind the dividend: markets where low payout ratios, manageable debt, strong ROE, solid cash flow coverage, and improving Piotroski signals actually predict future returns.
India leads on absolute returns: 15.86% CAGR, negative down capture (-19.3%), -11.36% max drawdown (shallowest in the study). Germany delivered the best risk-adjusted return (0.652 Sharpe) with near-flat down capture (-2.5%). The UK posted the largest local-benchmark excess (+8.16% vs FTSE 100) and the highest average score (9.2).
Sweden had the second largest excess return vs its local benchmark (+7.65%). The FTSE 100 and SMI barely delivered anything over 25 years, and the sustainability screen turned those into 9.38% and 8.72% respectively. Against a flat benchmark, even modest stock selection produces large excess returns.
The screen's real edge isn't raw return. It's better behavior during drawdowns. Negative down capture in India and Germany. Single-digit down capture in Canada. By preserving capital during market stress, the portfolio starts each recovery from higher ground. Five factors, not one.
Part of a Series
This is the global comparison post. Individual exchange analyses with year-by-year breakdowns, annual return tables, and charts:
- [Dividend Sustainability on US Stocks (NYSE + NASDAQ + AMEX)][US_BLOG_URL] - 10.73% CAGR, +2.88% vs SPY, 3.89% Jensen alpha
- [Dividend Sustainability on Indian Stocks (NSE)][INDIA_BLOG_URL] - 15.86% CAGR, +3.80% vs Sensex, negative down capture
- [Dividend Sustainability on German Stocks (XETRA)][GERMANY_BLOG_URL] - 12.27% CAGR, +7.23% vs DAX, best Sharpe (0.652)
- [Dividend Sustainability on Swedish Stocks (STO)][SWEDEN_BLOG_URL] - 10.21% CAGR, +7.65% vs OMXS30
- [Dividend Sustainability on Canadian Stocks (TSX)][CANADA_BLOG_URL] - 9.96% CAGR, +6.00% vs TSX Composite
- [Dividend Sustainability on Swiss Stocks (SIX)][SWITZERLAND_BLOG_URL] - 8.72% CAGR, +6.98% vs SMI
- [Dividend Sustainability on UK Stocks (LSE)][UK_BLOG_URL] - 9.38% CAGR, +8.16% vs FTSE 100 (largest local-benchmark excess)
- [Dividend Sustainability on Japanese Stocks (JPX)][JAPAN_BLOG_URL] - 5.55% CAGR, +2.24% vs Nikkei
- [Dividend Sustainability on Hong Kong Stocks (HKSE)][HONGKONG_BLOG_URL] - 6.64% CAGR, +5.00% vs Hang Seng
- [Dividend Sustainability on Chinese Stocks (SHZ + SHH)][CHINA_BLOG_URL] - 6.90% CAGR, +4.47% vs SSE Composite, 76% win rate
- [Dividend Sustainability on Australian Stocks (ASX)][AUSTRALIA_BLOG_URL] - 6.12% CAGR, +2.23% vs ASX 200
- [Dividend Sustainability on Taiwanese Stocks (TAI)][TAIWAN_BLOG_URL] - 4.53% CAGR, +0.44% vs TAIEX, marginal
References
- DeAngelo, H., DeAngelo, L. & Skinner, D. (1992). "Dividends and Losses." Journal of Finance, 47(5), 1837-1863.
- Piotroski, J. (2000). "Value Investing: The Use of Historical Financial Statement Information to Separate Winners from Losers." Journal of Accounting Research, 38, 1-41.
- Benartzi, S., Michaely, R. & Thaler, R. (1997). "Do Changes in Dividends Signal the Future or the Past?" Journal of Finance, 52(3), 1007-1034.
Run This Screen Yourself
All metrics used in this analysis (payout ratio, debt-to-equity, free cash flow, dividends paid, ROE, dividend yield, market cap) are queryable via SQL on Ceta Research. Filter by exchange, adjust the score threshold, and see what passes today.
The full backtest code (Python + DuckDB) is open source. Every exchange, every rebalance year, every cost assumption, every Piotroski calculation is documented.
github.com/ceta-research/backtests
Data: Ceta Research, FMP financial data warehouse. 13 exchanges, 2000-2025, annual July rebalance, equal weight (top 30 by 5-component sustainability score >= 7, yield > 2%), exchange-specific market cap thresholds. Returns in local currency vs local market index. Execution: next-day close (MOC). Excluded: France (FMP data gap, 0 qualifying stocks). Past performance does not guarantee future results. This is research, not investment advice.


