
Dividend Sustainability on German Stocks: 12.27% CAGR Over 25 Years
The dividend sustainability screen on XETRA stocks returned 12.27% CAGR with a 0.652 Sharpe ratio and 7.23% annual excess over the DAX. Down capture of just -2.5% vs the local benchmark.

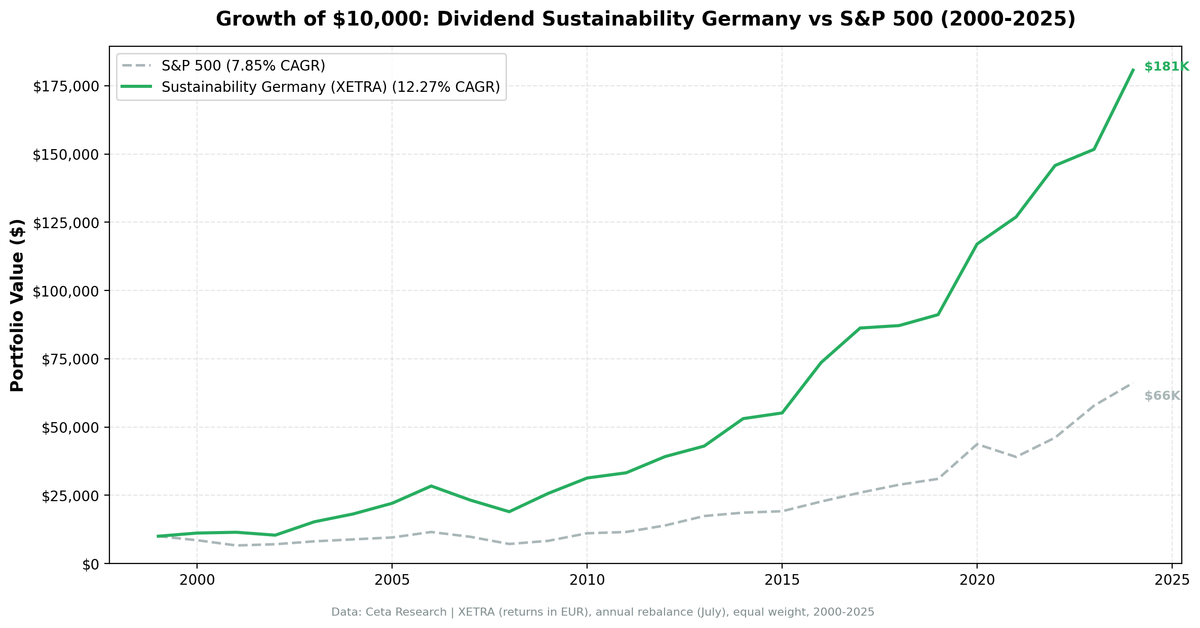
Germany delivered strong risk-adjusted returns with the dividend sustainability screen. 12.27% CAGR with a 0.652 Sharpe ratio, beating the local DAX by 7.23% annually. The strategy was fully invested all 25 years (zero cash periods), held an average of 19.4 stocks per period, and produced that excess with only 15.75% volatility.
Contents
- Method
- The Screen (SQL)
- What We Found
- 25 years of data. 7.23% annual excess over DAX. Best Sharpe in the global series (0.652).
- Year-by-year returns
- 2000-2003: dot-com protection, German style
- 2008: limited damage
- 2014-2017: European recovery
- Limitations
- Takeaway
- Part of a Series
- References
- Run This Screen Yourself
Data: FMP financial data warehouse, 2000–2025. Updated May 2026.
Method
We applied the same 5-component sustainability score used in our US dividend sustainability study. Five dimensions scored 0-2 each (payout ratio, debt/equity, FCF coverage, ROE, Piotroski F-Score), total 0-10. Minimum score 7, yield above 2%, top 30 by score, equal weight, annual July rebalance. See the US blog for full methodology and score breakdown.
Universe: XETRA, market cap > 500M EUR (~$545M USD) Period: 2000-2025 (25 years) Benchmark: DAX (Deutsche Aktienindex, EUR) Execution: Next-day close (market-on-close after signal)
The Screen (SQL)
WITH latest_ratios AS (
    SELECT r.symbol, r.dividendPayoutRatio, r.debtToEquityRatio,
           r.dividendYield, r.date,
        ROW_NUMBER() OVER (PARTITION BY r.symbol ORDER BY r.date DESC) AS rn
    FROM financial_ratios r
    JOIN profile p ON r.symbol = p.symbol
    WHERE r.period = 'FY'
      AND r.dividendPayoutRatio > 0
      AND r.dividendYield IS NOT NULL
      AND p.exchange IN ('XETRA')
),
latest_cf AS (
    SELECT c.symbol, c.freeCashFlow, c.commonDividendsPaid, c.date,
        ROW_NUMBER() OVER (PARTITION BY c.symbol ORDER BY c.date DESC) AS rn
    FROM cash_flow_statement c
    JOIN profile p ON c.symbol = p.symbol
    WHERE c.period = 'FY'
      AND c.commonDividendsPaid < 0
      AND p.exchange IN ('XETRA')
),
latest_metrics AS (
    SELECT k.symbol, k.returnOnEquity, k.marketCap, k.date,
        ROW_NUMBER() OVER (PARTITION BY k.symbol ORDER BY k.date DESC) AS rn
    FROM key_metrics k
    JOIN profile p ON k.symbol = p.symbol
    WHERE k.period = 'FY'
      AND k.marketCap IS NOT NULL
      AND p.exchange IN ('XETRA')
),
latest_scores AS (
    SELECT symbol, piotroskiScore FROM scores
),
scored AS (
    SELECT r.symbol, r.date,
        ROUND(r.dividendPayoutRatio * 100, 1) AS payout_pct,
        ROUND(r.debtToEquityRatio, 2) AS debt_equity,
        ROUND(c.freeCashFlow / NULLIF(ABS(c.commonDividendsPaid), 0), 2) AS fcf_coverage,
        ROUND(k.returnOnEquity * 100, 1) AS roe_pct,
        s.piotroskiScore AS piotroski,
        ROUND(r.dividendYield * 100, 2) AS yield_pct,
        ROUND(k.marketCap / 1e9, 1) AS mktcap_bn,
        CASE WHEN r.dividendPayoutRatio < 0.5 THEN 2
             WHEN r.dividendPayoutRatio < 0.8 THEN 1 ELSE 0 END AS c_payout,
        CASE WHEN r.debtToEquityRatio >= 0 AND r.debtToEquityRatio < 0.5 THEN 2
             WHEN r.debtToEquityRatio >= 0 AND r.debtToEquityRatio < 1.5 THEN 1
             ELSE 0 END AS c_debt,
        CASE WHEN c.freeCashFlow > 0 AND c.commonDividendsPaid < 0
                  AND c.freeCashFlow / ABS(c.commonDividendsPaid) > 2 THEN 2
             WHEN c.freeCashFlow > 0 AND c.commonDividendsPaid < 0
                  AND c.freeCashFlow / ABS(c.commonDividendsPaid) > 1 THEN 1
             ELSE 0 END AS c_fcf,
        CASE WHEN k.returnOnEquity > 0.15 THEN 2
             WHEN k.returnOnEquity > 0.08 THEN 1 ELSE 0 END AS c_roe,
        CASE WHEN s.piotroskiScore >= 7 THEN 2
             WHEN s.piotroskiScore >= 5 THEN 1 ELSE 0 END AS c_piotroski
    FROM latest_ratios r
    JOIN latest_cf c ON r.symbol = c.symbol AND c.rn = 1
    JOIN latest_metrics k ON r.symbol = k.symbol AND k.rn = 1
    LEFT JOIN latest_scores s ON r.symbol = s.symbol
    WHERE r.rn = 1
      AND r.dividendYield > 0.02
      AND k.marketCap > 500e6
)
SELECT symbol, date, payout_pct, debt_equity, fcf_coverage, roe_pct, piotroski,
       yield_pct, mktcap_bn,
       c_payout + c_debt + c_fcf + c_roe + COALESCE(c_piotroski, 0) AS sustainability_score,
       c_payout, c_debt, c_fcf, c_roe, COALESCE(c_piotroski, 0) AS c_piotroski
FROM scored
WHERE c_payout + c_debt + c_fcf + c_roe + COALESCE(c_piotroski, 0) >= 7
ORDER BY sustainability_score DESC, yield_pct DESC
LIMIT 30
[Run this query on Ceta Research][SUSTAINABILITY_GERMANY_QUERY_URL]
What We Found

25 years of data. 7.23% annual excess over DAX. Best Sharpe in the global series (0.652).
| Metric | Sustainability (Germany) | DAX |
|---|---|---|
| CAGR | 12.27% | 5.04% |
| Volatility | 15.75% | - |
| Max Drawdown | -33.16% | - |
| Sharpe Ratio | 0.652 | - |
| Sortino Ratio | 1.668 | - |
| Win Rate (annual) | 64% | - |
| Up Capture | 97.9% | - |
| Down Capture | -2.5% | - |
| Beta | 0.575 | - |
| Alpha | 8.53% | - |
| Avg Stocks per Period | 19.4 | - |
| Cash Periods | 0 of 25 | - |
| Avg Sustainability Score | 8.9/10 | - |
What makes Germany stand out is how those returns were earned relative to the local market. Volatility of 15.75% is modest for a developed-market equity strategy. Down capture of -2.5% means the strategy stayed roughly flat during the DAX's losing years on average. The Sharpe ratio of 0.652 is the highest of any exchange we tested.
Zero cash periods. The XETRA universe consistently produced enough qualifying stocks. German industrials (the Mittelstand companies) tend to carry low debt, generate strong cash flows, and maintain disciplined payout policies. These are exactly the traits the sustainability score rewards.
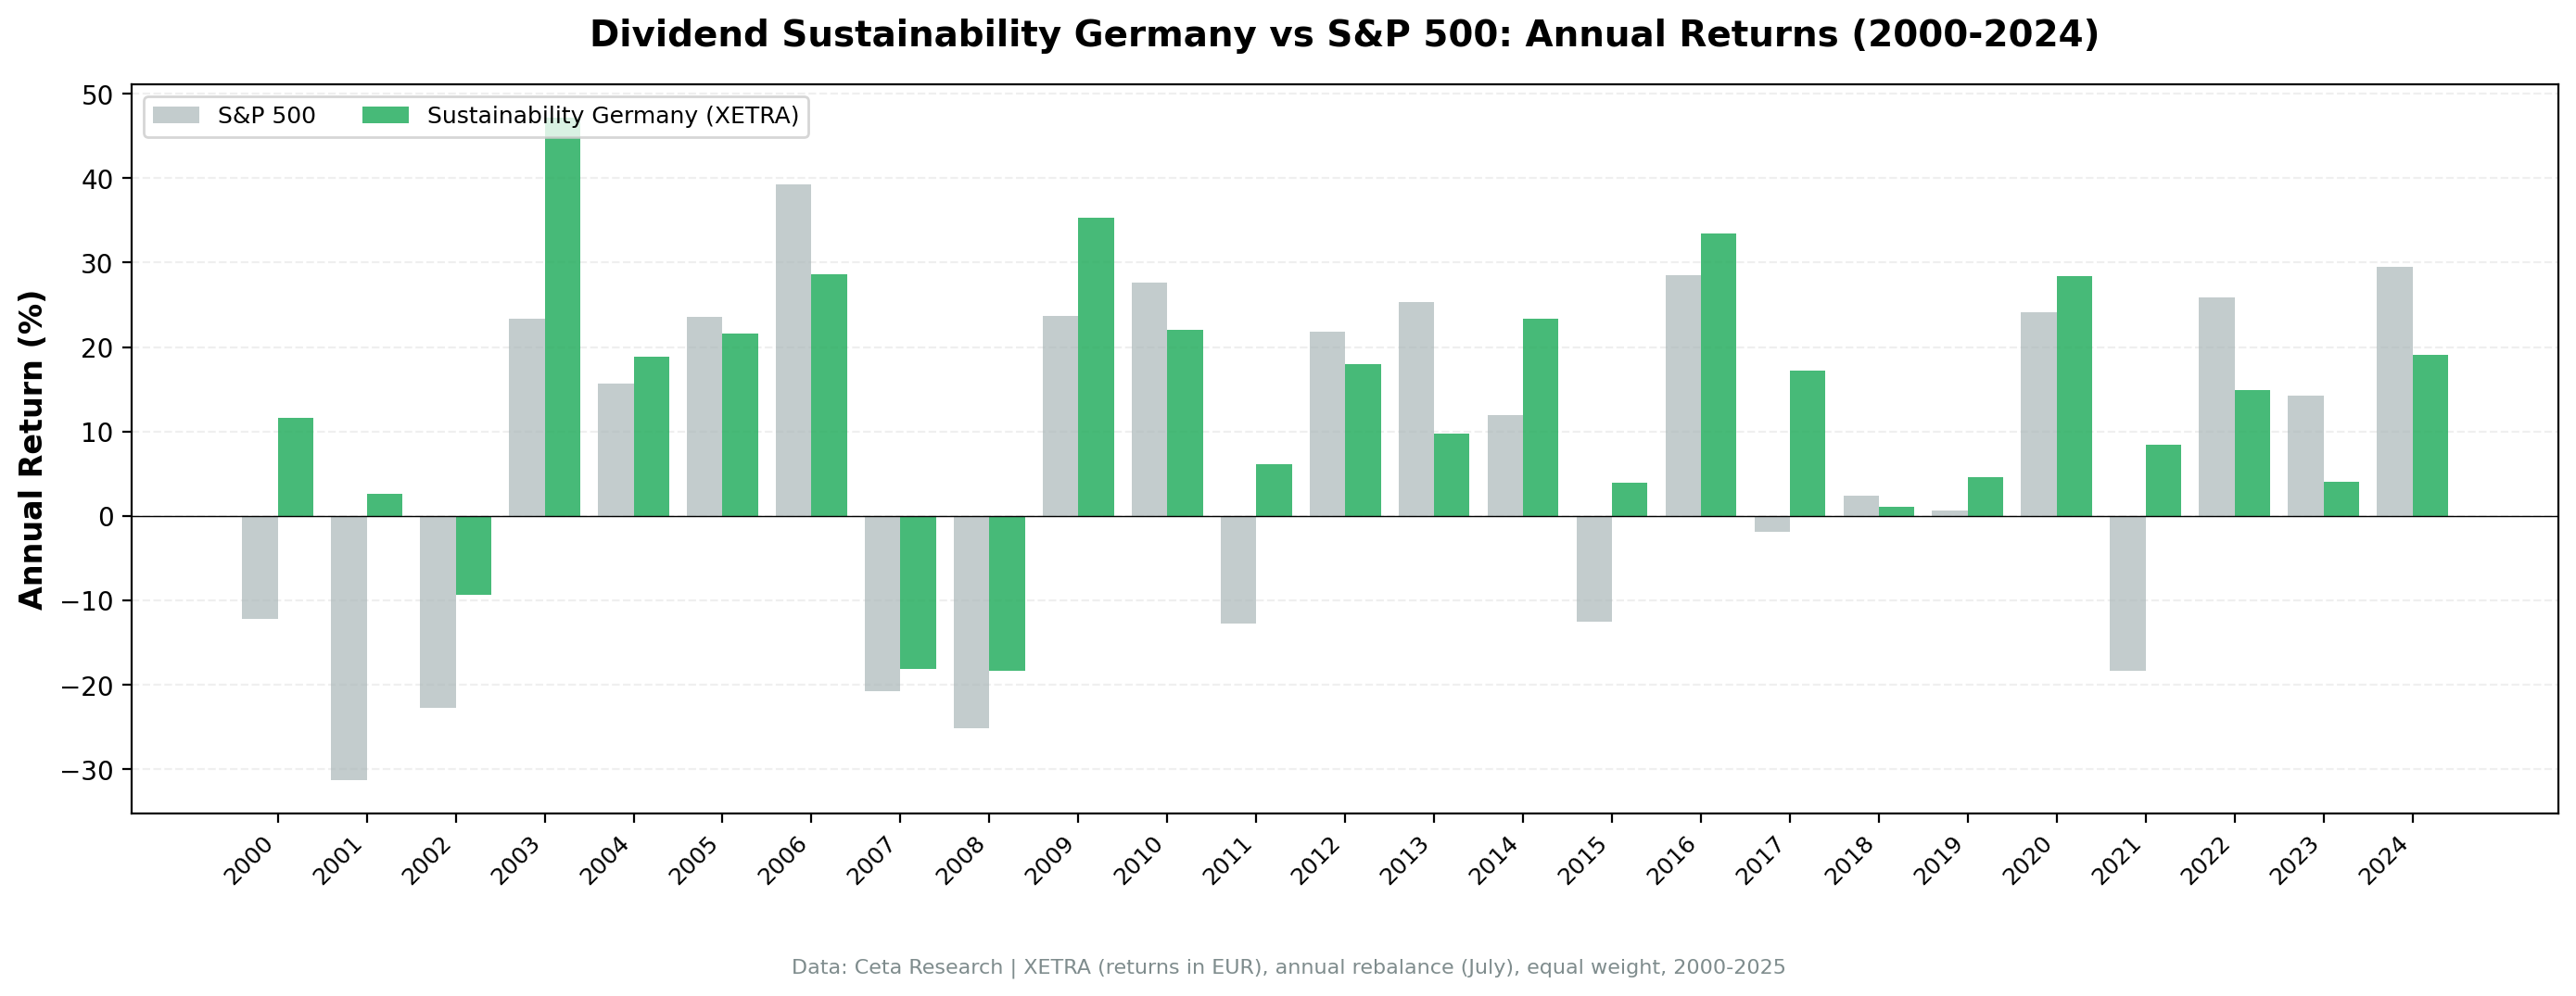
Year-by-year returns
| Year | Sustainability | DAX | Excess |
|---|---|---|---|
| 2000 | +11.6% | -12.2% | +23.8% |
| 2001 | +2.6% | -31.3% | +33.9% |
| 2002 | -9.3% | -22.8% | +13.5% |
| 2003 | +47.2% | +23.4% | +23.8% |
| 2004 | +18.9% | +15.6% | +3.3% |
| 2005 | +21.6% | +23.6% | -2.0% |
| 2006 | +28.6% | +39.3% | -10.7% |
| 2007 | -18.2% | -20.8% | +2.6% |
| 2008 | -18.3% | -25.2% | +6.8% |
| 2009 | +35.3% | +23.6% | +11.7% |
| 2010 | +22.0% | +27.6% | -5.6% |
| 2011 | +6.1% | -12.7% | +18.8% |
| 2012 | +17.9% | +21.8% | -3.9% |
| 2013 | +9.8% | +25.3% | -15.5% |
| 2014 | +23.4% | +12.0% | +11.4% |
| 2015 | +3.9% | -12.5% | +16.5% |
| 2016 | +33.5% | +28.5% | +5.0% |
| 2017 | +17.2% | -1.9% | +19.1% |
| 2018 | +1.0% | +2.4% | -1.3% |
| 2019 | +4.6% | +0.7% | +3.9% |
| 2020 | +28.4% | +24.1% | +4.3% |
| 2021 | +8.5% | -18.4% | +26.8% |
| 2022 | +14.9% | +25.9% | -11.0% |
| 2023 | +4.1% | +14.3% | -10.2% |
| 2024 | +19.1% | +29.5% | -10.4% |
2000-2003: dot-com protection, German style
+11.6% in 2000 while the DAX dropped 12.2%. German sustainability stocks weren't exposed to the tech bubble. The companies that scored 7+/10 were industrials and consumer staples with real earnings, low leverage, and strong cash generation. The pattern continued in 2001 and 2002 as the DAX shed 31.3% and 22.8% while the strategy stayed roughly flat or lost less. The 2003 recovery year produced +47.2% as quality names led the snap-back. These four years built a compounding advantage that persisted.
2008: limited damage
The strategy lost 18.3% vs the DAX's 25.2%. The sustainability screen's D/E filter excluded highly leveraged companies, and the FCF component kept cash-burning businesses out of the portfolio. The max drawdown of -33.2% reflects a deeper multi-year trough than the 2008 figure alone suggests.
2014-2017: European recovery
Four strong relative years: +23.4%, +3.9%, +33.5%, +17.2%. German companies benefited from ECB quantitative easing and the eurozone recovery. Sustainability stocks with low debt and strong ROE were well positioned. The 2015 return of +3.9% vs the DAX's -12.5% shows the screen's defensive character clearly, and 2017's +19.1% excess captures the snap-back when European fundamentals turned.
Limitations
- Concentrated market. XETRA has fewer large-cap stocks than US exchanges. The average of 19.4 stocks per period means the portfolio often can't fill all 30 slots, increasing concentration risk.
- Currency risk. Returns are in EUR. USD investors face EUR/USD conversion effects.
- Sector skew. German industrials and autos dominate the sustainable dividend universe. When these sectors sell off (as in 2007), the portfolio has limited diversification.
Takeaway
Germany is the risk-adjusted champion of the dividend sustainability screen. 12.27% CAGR, 0.652 Sharpe, -2.5% down capture vs DAX, and 7.23% annual excess. The XETRA universe is rich with the kind of companies this strategy loves: family-controlled industrials with conservative balance sheets, strong cash generation, and disciplined dividend policies. The strategy never went to cash in 25 years, and the average sustainability score of 8.9/10 is the second-highest of any exchange tested. If you want steady, risk-efficient compounding from dividend stocks, Germany's the place to look.
Part of a Series
This analysis is part of our dividend sustainability global exchange comparison: - Dividend Sustainability Score: US Stocks - 10.73% CAGR, full methodology - [Dividend Sustainability on Indian Stocks (NSE)][INDIA_BLOG_URL] - 15.86% CAGR, the standout - [Dividend Sustainability on Canadian Stocks (TSX)][CANADA_BLOG_URL] - 9.96% CAGR - [Dividend Sustainability on Swedish Stocks (STO)][SWEDEN_BLOG_URL] - 10.21% CAGR - [Dividend Sustainability: 13-Exchange Global Comparison][COMPARISON_BLOG_URL] - full comparison table
References
- DeAngelo, H., DeAngelo, L. & Skinner, D. (1992). "Dividends and Losses." Journal of Finance, 47(5), 1837-1863.
- Piotroski, J. (2000). "Value Investing: The Use of Historical Financial Statement Information to Separate Winners from Losers." Journal of Accounting Research, 38, 1-41.
- Benartzi, S., Michaely, R. & Thaler, R. (1997). "Do Changes in Dividends Signal the Future or the Past?" Journal of Finance, 52(3), 1007-1034.
Run This Screen Yourself
Via web UI: [Run the sustainability screen on Ceta Research][SUSTAINABILITY_GERMANY_QUERY_URL]. The query is pre-loaded. Hit "Run" and see what passes today.
Get your API key at cetaresearch.com. The full backtest code (Python + DuckDB) is on GitHub.
Data: Ceta Research, FMP financial data warehouse. Universe: XETRA, market cap > 500M EUR. Annual rebalance (July), equal weight top 30 by sustainability score, 2000-2025.
Past performance does not guarantee future results. This is educational content, not investment advice.


