
Dividend Sustainability on Canadian Stocks: 9.96% CAGR Over 25 Years
The dividend sustainability screen on TSX stocks returned 9.96% CAGR over 25 years with 6.00% annual excess over the TSX Composite. 68% win rate vs local benchmark, 10.75% down capture.

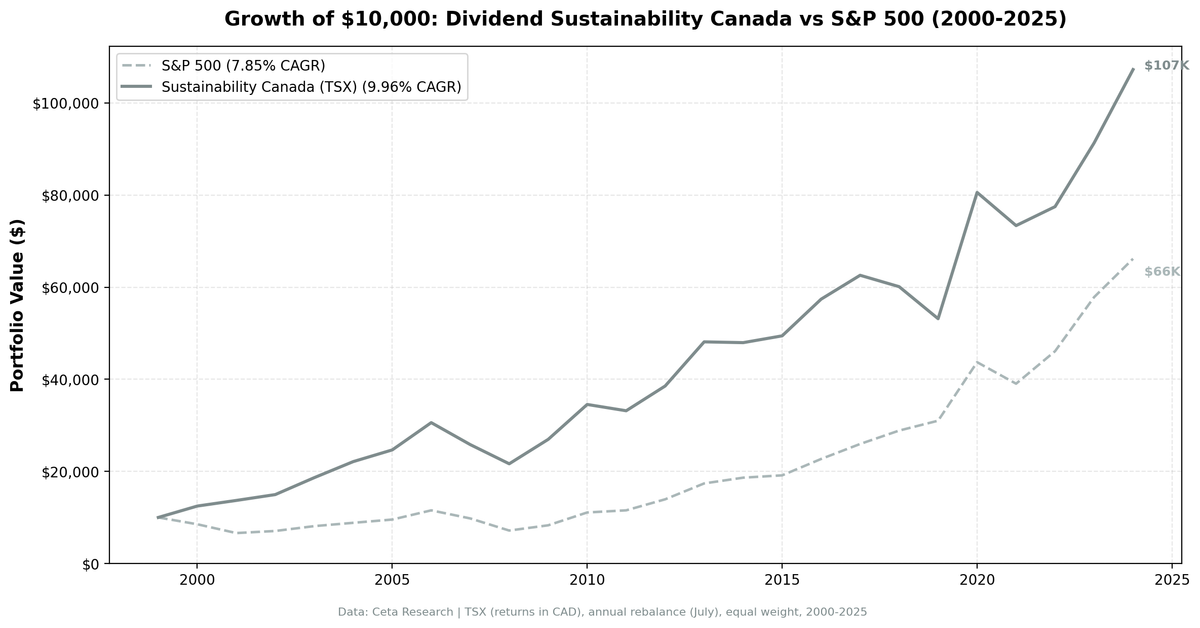
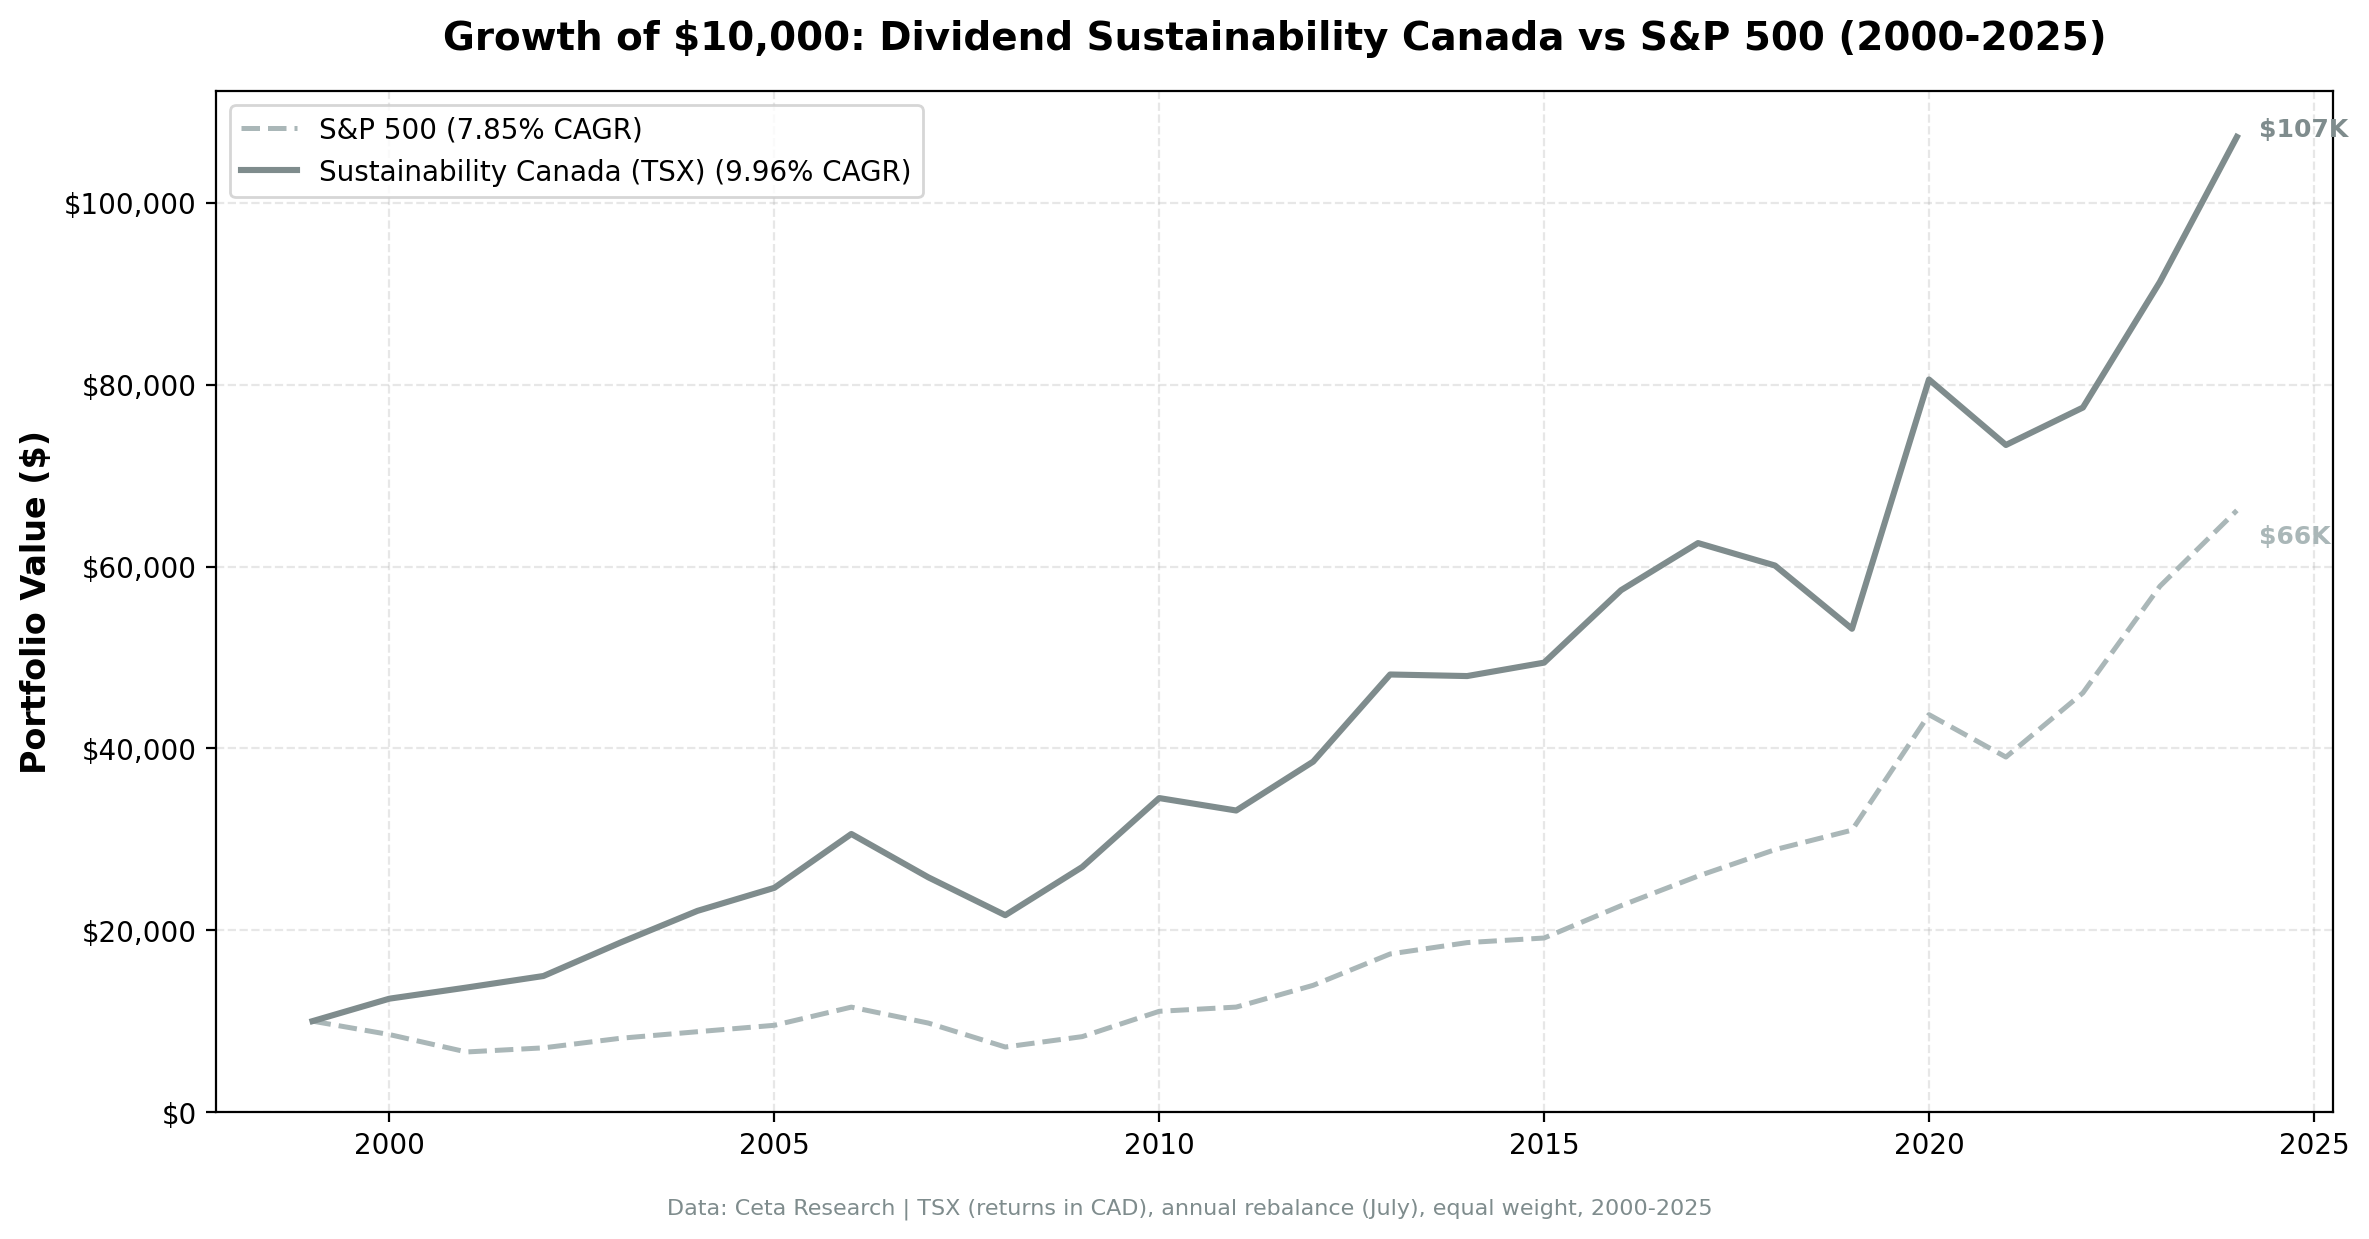
Canada's dividend sustainability screen returned 9.96% CAGR over 25 years, beating the TSX Composite by 6.00% annually. The strategy turned $10,000 into roughly $107,000 while consistently outperforming the local benchmark. Max drawdown was -29.21%, and up capture of 133.4% means the portfolio more than kept pace during TSX bull runs while maintaining meaningful downside protection.
Contents
- Method
- The Screen (SQL)
- What We Found
- 25 years of data. 6.00% annual excess over TSX Composite.
- Year-by-year returns
- 2000-2001: early protection
- 2008: solid downside protection
- 2020: the big snap-back
- Limitations
- Takeaway
- Part of a Series
- References
- Run This Screen Yourself
Data: FMP financial data warehouse, 2000-2025. Updated May 2026.
Method
We applied the same 5-component sustainability score used in our US dividend sustainability study. Five dimensions scored 0-2 each (payout ratio, debt/equity, FCF coverage, ROE, Piotroski F-Score), total 0-10. Minimum score 7, yield above 2%, top 30 by score, equal weight, annual July rebalance. See the US blog for full methodology and score breakdown.
Universe: TSX, market cap > 500M CAD (~$362M USD) Period: 2000-2025 (25 years) Benchmark: TSX Composite (S&P/TSX Composite Index, CAD) Execution: Next-day close (market-on-close after signal)
The Screen (SQL)
WITH latest_ratios AS (
    SELECT r.symbol, r.dividendPayoutRatio, r.debtToEquityRatio,
           r.dividendYield, r.date,
        ROW_NUMBER() OVER (PARTITION BY r.symbol ORDER BY r.date DESC) AS rn
    FROM financial_ratios r
    JOIN profile p ON r.symbol = p.symbol
    WHERE r.period = 'FY'
      AND r.dividendPayoutRatio > 0
      AND r.dividendYield IS NOT NULL
      AND p.exchange IN ('TSX')
),
latest_cf AS (
    SELECT c.symbol, c.freeCashFlow, c.commonDividendsPaid, c.date,
        ROW_NUMBER() OVER (PARTITION BY c.symbol ORDER BY c.date DESC) AS rn
    FROM cash_flow_statement c
    JOIN profile p ON c.symbol = p.symbol
    WHERE c.period = 'FY'
      AND c.commonDividendsPaid < 0
      AND p.exchange IN ('TSX')
),
latest_metrics AS (
    SELECT k.symbol, k.returnOnEquity, k.marketCap, k.date,
        ROW_NUMBER() OVER (PARTITION BY k.symbol ORDER BY k.date DESC) AS rn
    FROM key_metrics k
    JOIN profile p ON k.symbol = p.symbol
    WHERE k.period = 'FY'
      AND k.marketCap IS NOT NULL
      AND p.exchange IN ('TSX')
),
latest_scores AS (
    SELECT symbol, piotroskiScore FROM scores
),
scored AS (
    SELECT r.symbol, r.date,
        ROUND(r.dividendPayoutRatio * 100, 1) AS payout_pct,
        ROUND(r.debtToEquityRatio, 2) AS debt_equity,
        ROUND(c.freeCashFlow / NULLIF(ABS(c.commonDividendsPaid), 0), 2) AS fcf_coverage,
        ROUND(k.returnOnEquity * 100, 1) AS roe_pct,
        s.piotroskiScore AS piotroski,
        ROUND(r.dividendYield * 100, 2) AS yield_pct,
        ROUND(k.marketCap / 1e9, 1) AS mktcap_bn,
        CASE WHEN r.dividendPayoutRatio < 0.5 THEN 2
             WHEN r.dividendPayoutRatio < 0.8 THEN 1 ELSE 0 END AS c_payout,
        CASE WHEN r.debtToEquityRatio >= 0 AND r.debtToEquityRatio < 0.5 THEN 2
             WHEN r.debtToEquityRatio >= 0 AND r.debtToEquityRatio < 1.5 THEN 1
             ELSE 0 END AS c_debt,
        CASE WHEN c.freeCashFlow > 0 AND c.commonDividendsPaid < 0
                  AND c.freeCashFlow / ABS(c.commonDividendsPaid) > 2 THEN 2
             WHEN c.freeCashFlow > 0 AND c.commonDividendsPaid < 0
                  AND c.freeCashFlow / ABS(c.commonDividendsPaid) > 1 THEN 1
             ELSE 0 END AS c_fcf,
        CASE WHEN k.returnOnEquity > 0.15 THEN 2
             WHEN k.returnOnEquity > 0.08 THEN 1 ELSE 0 END AS c_roe,
        CASE WHEN s.piotroskiScore >= 7 THEN 2
             WHEN s.piotroskiScore >= 5 THEN 1 ELSE 0 END AS c_piotroski
    FROM latest_ratios r
    JOIN latest_cf c ON r.symbol = c.symbol AND c.rn = 1
    JOIN latest_metrics k ON r.symbol = k.symbol AND k.rn = 1
    LEFT JOIN latest_scores s ON r.symbol = s.symbol
    WHERE r.rn = 1
      AND r.dividendYield > 0.02
      AND k.marketCap > 500e6
)
SELECT symbol, date, payout_pct, debt_equity, fcf_coverage, roe_pct, piotroski,
       yield_pct, mktcap_bn,
       c_payout + c_debt + c_fcf + c_roe + COALESCE(c_piotroski, 0) AS sustainability_score,
       c_payout, c_debt, c_fcf, c_roe, COALESCE(c_piotroski, 0) AS c_piotroski
FROM scored
WHERE c_payout + c_debt + c_fcf + c_roe + COALESCE(c_piotroski, 0) >= 7
ORDER BY sustainability_score DESC, yield_pct DESC
LIMIT 30
[Run this query on Ceta Research][SUSTAINABILITY_CANADA_QUERY_URL]
What We Found
25 years of data. 6.00% annual excess over TSX Composite.
| Metric | Sustainability (Canada) | TSX Composite |
|---|---|---|
| CAGR | 9.96% | 3.95% |
| Volatility | 15.92% | - |
| Max Drawdown | -29.21% | - |
| Sharpe Ratio | 0.468 | - |
| Sortino Ratio | 1.127 | - |
| Win Rate (annual) | 68% | - |
| Up Capture | 133.4% | - |
| Down Capture | 10.75% | - |
| Beta | 0.731 | - |
| Alpha | 6.4% | - |
| Avg Stocks per Period | 21.3 | - |
| Cash Periods | 0 of 25 | - |
| Avg Sustainability Score | 8.2/10 | - |
The TSX Composite returned only 3.95% CAGR over this period, making the sustainability screen's 6.4% alpha and 68% win rate against the local benchmark a strong result. The Sortino ratio (1.127) shows solid downside-adjusted performance. Down capture of 10.75% means the portfolio absorbed barely a tenth of the TSX's losing-year returns.
Zero cash periods in 25 years. The TSX consistently produced enough qualifying stocks. An average sustainability score of 8.2/10 means the portfolio stayed firmly in the quality zone.
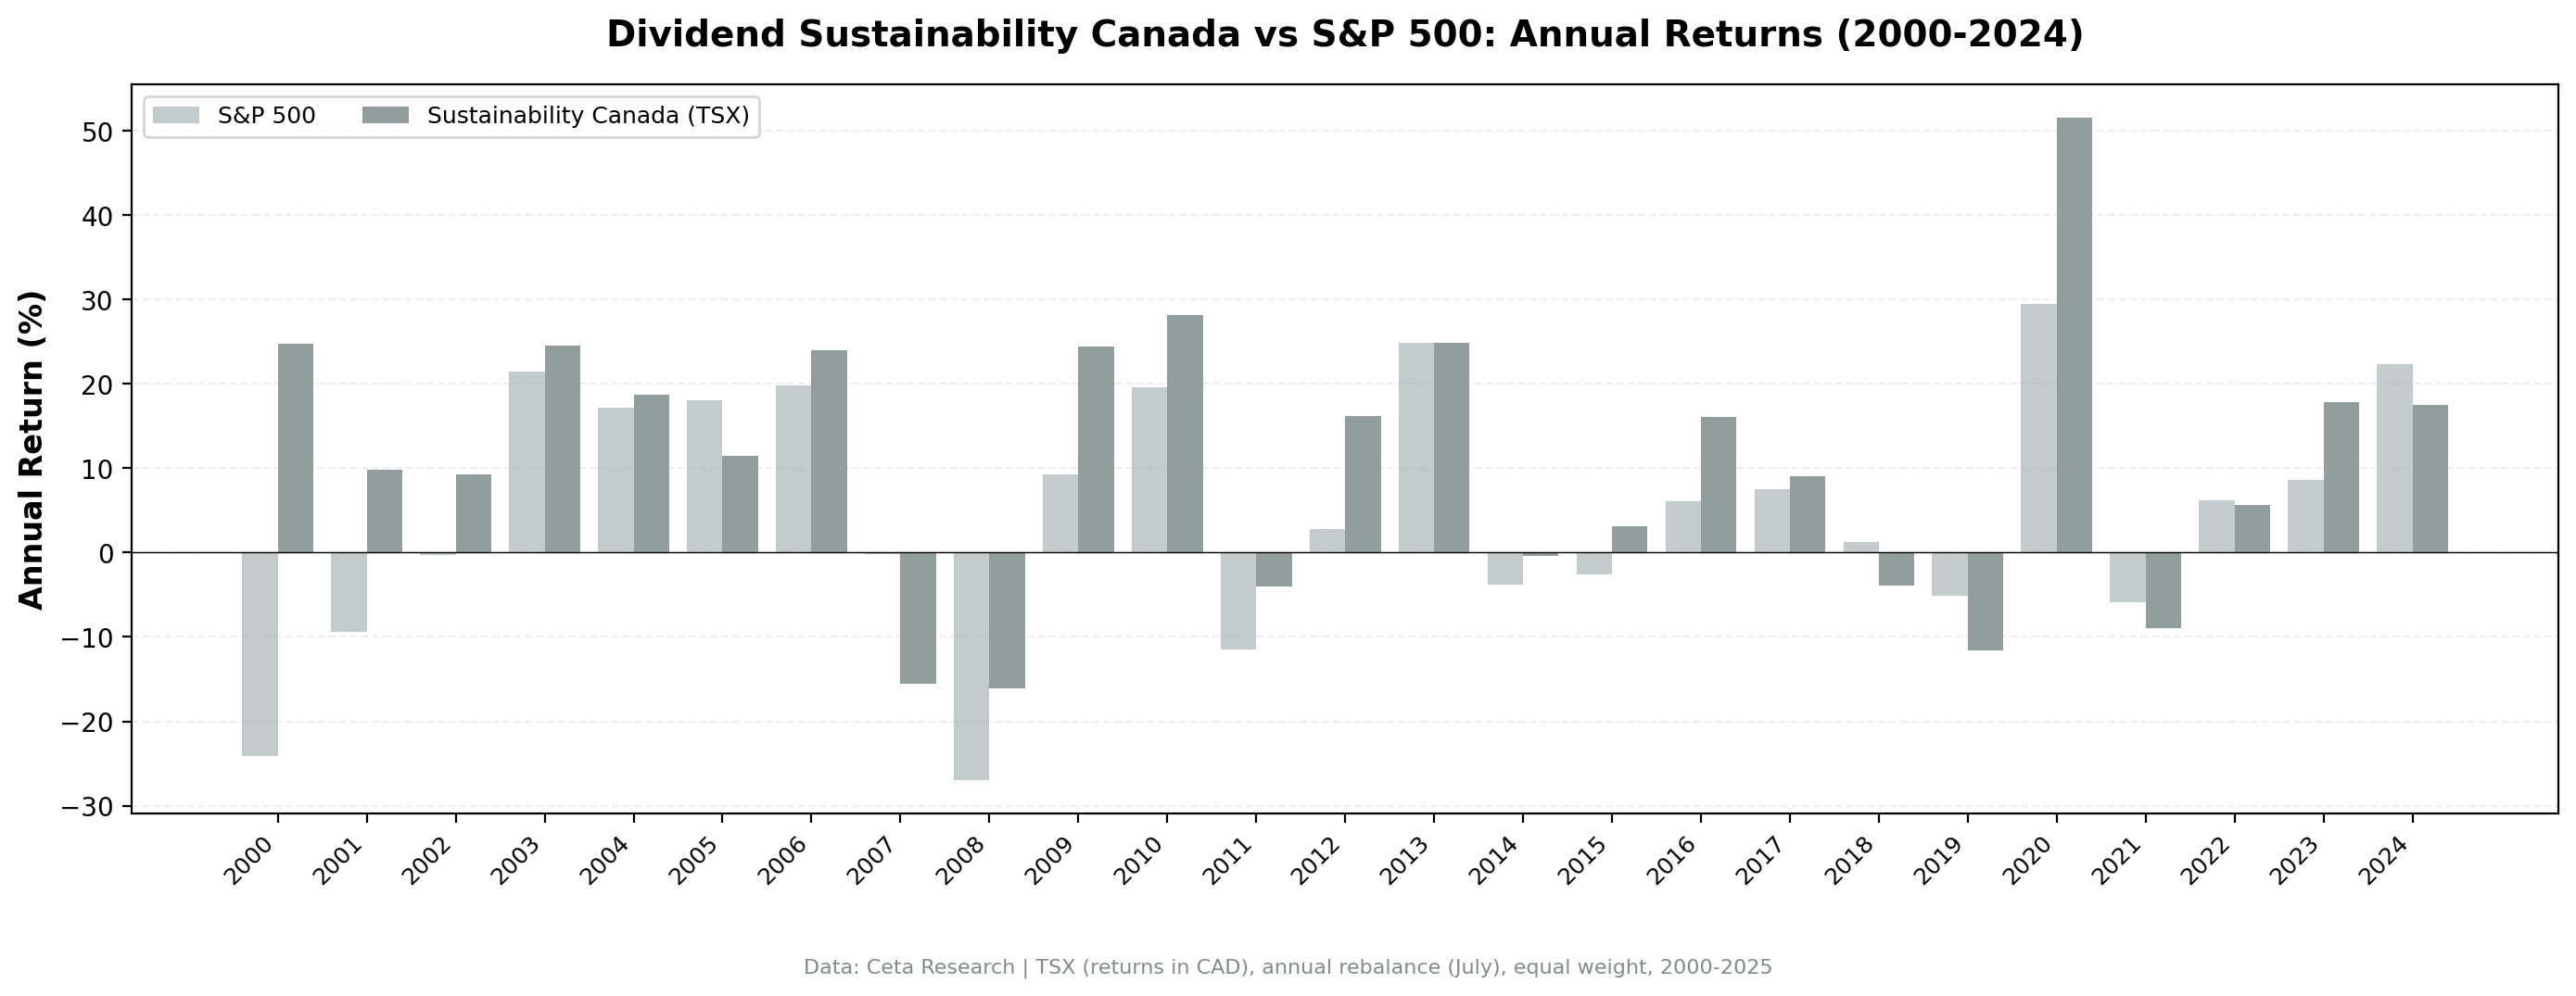
Year-by-year returns
| Year | Sustainability | TSX Composite | Excess |
|---|---|---|---|
| 2000 | +24.7% | -24.1% | +48.9% |
| 2001 | +9.8% | -9.4% | +19.1% |
| 2002 | +9.3% | -0.3% | +9.6% |
| 2003 | +24.6% | +21.4% | +3.2% |
| 2004 | +18.7% | +17.1% | +1.6% |
| 2005 | +11.5% | +18.0% | -6.6% |
| 2006 | +24.0% | +19.9% | +4.2% |
| 2007 | -15.6% | -0.2% | -15.4% |
| 2008 | -16.1% | -27.0% | +10.9% |
| 2009 | +24.5% | +9.3% | +15.2% |
| 2010 | +28.1% | +19.6% | +8.5% |
| 2011 | -4.0% | -11.5% | +7.5% |
| 2012 | +16.2% | +2.8% | +13.4% |
| 2013 | +24.9% | +24.9% | 0.0% |
| 2014 | -0.4% | -3.8% | +3.4% |
| 2015 | +3.1% | -2.6% | +5.7% |
| 2016 | +16.1% | +6.1% | +10.0% |
| 2017 | +9.0% | +7.5% | +1.5% |
| 2018 | -4.0% | +1.3% | -5.2% |
| 2019 | -11.6% | -5.1% | -6.4% |
| 2020 | +51.6% | +29.5% | +22.1% |
| 2021 | -8.9% | -5.9% | -3.0% |
| 2022 | +5.6% | +6.2% | -0.6% |
| 2023 | +17.8% | +8.7% | +9.2% |
| 2024 | +17.5% | +22.4% | -4.9% |
2000-2001: early protection
+24.7% and +9.8% in 2000-2001 while the TSX lost 24.1% and 9.4%. Canadian sustainability stocks were insulated from the tech bubble. The TSX's tilt toward resources, banks, and industrials, filtered further by the sustainability screen, created a portfolio with almost zero tech exposure.
2008: solid downside protection
-16.1% vs TSX -27.0% in 2008. The D/E component filtered out highly leveraged Canadian financials. The FCF component ensured dividend payments were backed by real cash. The Piotroski component caught deteriorating fundamentals early. The strategy absorbed less of the financial crisis than the broader market.
2020: the big snap-back
+51.6% vs TSX +29.5%. After two painful years (2018-2019 gave back -4.0% and -11.6%), the July 2020 rebalance loaded up on beaten-down Canadian quality names. Energy and materials companies with strong sustainability scores recovered aggressively from COVID lows.
Limitations
- Resource sector concentration. The TSX is heavy on energy, mining, and financials. The sustainability screen helps by filtering out overleveraged names, but sector concentration remains a structural risk.
- Currency risk. Returns are in CAD. USD investors face CAD/USD conversion effects, which can add or subtract several percentage points per year.
- Modest alpha. 6.4% alpha is solid but earned over a TSX period with very low returns (3.95% CAGR). The value here is in risk reduction (lower drawdowns, better Sortino) plus consistent excess.
Takeaway
Canada's sustainability screen won't blow you away with raw returns, but it does what a dividend strategy should: compound steadily with less downside. 9.96% CAGR, 6.4% alpha over the TSX Composite, 68% win rate vs the local benchmark, and a Sortino of 1.127. The strategy protected capital during both the dot-com bust and the financial crisis, stayed fully invested for 25 years, and generated meaningful total return. Against a TSX Composite that only managed 3.95% CAGR over the period, Canadian sustainability stocks are a genuine alpha generator.
Part of a Series
This analysis is part of our dividend sustainability global exchange comparison: - Dividend Sustainability Score: US Stocks - 10.73% CAGR, full methodology - [Dividend Sustainability on Indian Stocks (NSE)][INDIA_BLOG_URL] - 15.86% CAGR, the standout - [Dividend Sustainability on German Stocks (XETRA)][GERMANY_BLOG_URL] - 12.27% CAGR, best Sharpe (0.652) - [Dividend Sustainability on UK Stocks (LSE)][UK_BLOG_URL] - 9.38% CAGR - [Dividend Sustainability: 13-Exchange Global Comparison][COMPARISON_BLOG_URL] - full comparison table
References
- DeAngelo, H., DeAngelo, L. & Skinner, D. (1992). "Dividends and Losses." Journal of Finance, 47(5), 1837-1863.
- Piotroski, J. (2000). "Value Investing: The Use of Historical Financial Statement Information to Separate Winners from Losers." Journal of Accounting Research, 38, 1-41.
- Benartzi, S., Michaely, R. & Thaler, R. (1997). "Do Changes in Dividends Signal the Future or the Past?" Journal of Finance, 52(3), 1007-1034.
Run This Screen Yourself
Via web UI: [Run the sustainability screen on Ceta Research][SUSTAINABILITY_CANADA_QUERY_URL]. The query is pre-loaded. Hit "Run" and see what passes today.
Get your API key at cetaresearch.com. The full backtest code (Python + DuckDB) is on GitHub.
Data: Ceta Research, FMP financial data warehouse. Universe: TSX, market cap > 500M CAD. Annual rebalance (July), equal weight top 30 by sustainability score, 2000-2025.
Past performance does not guarantee future results. This is educational content, not investment advice.


