
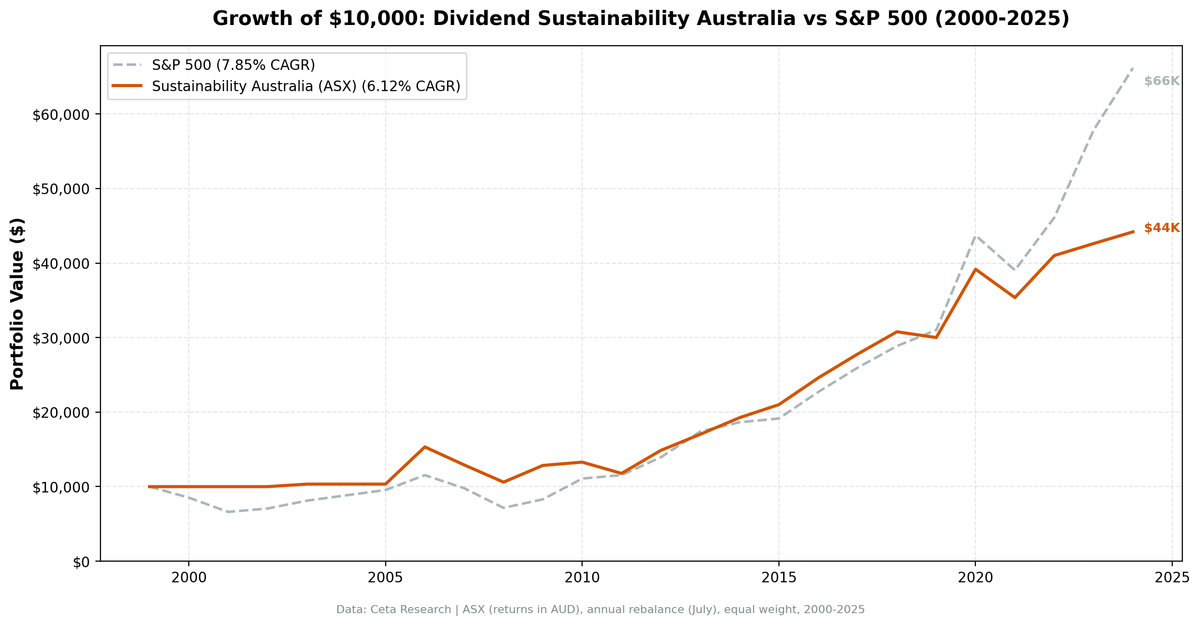
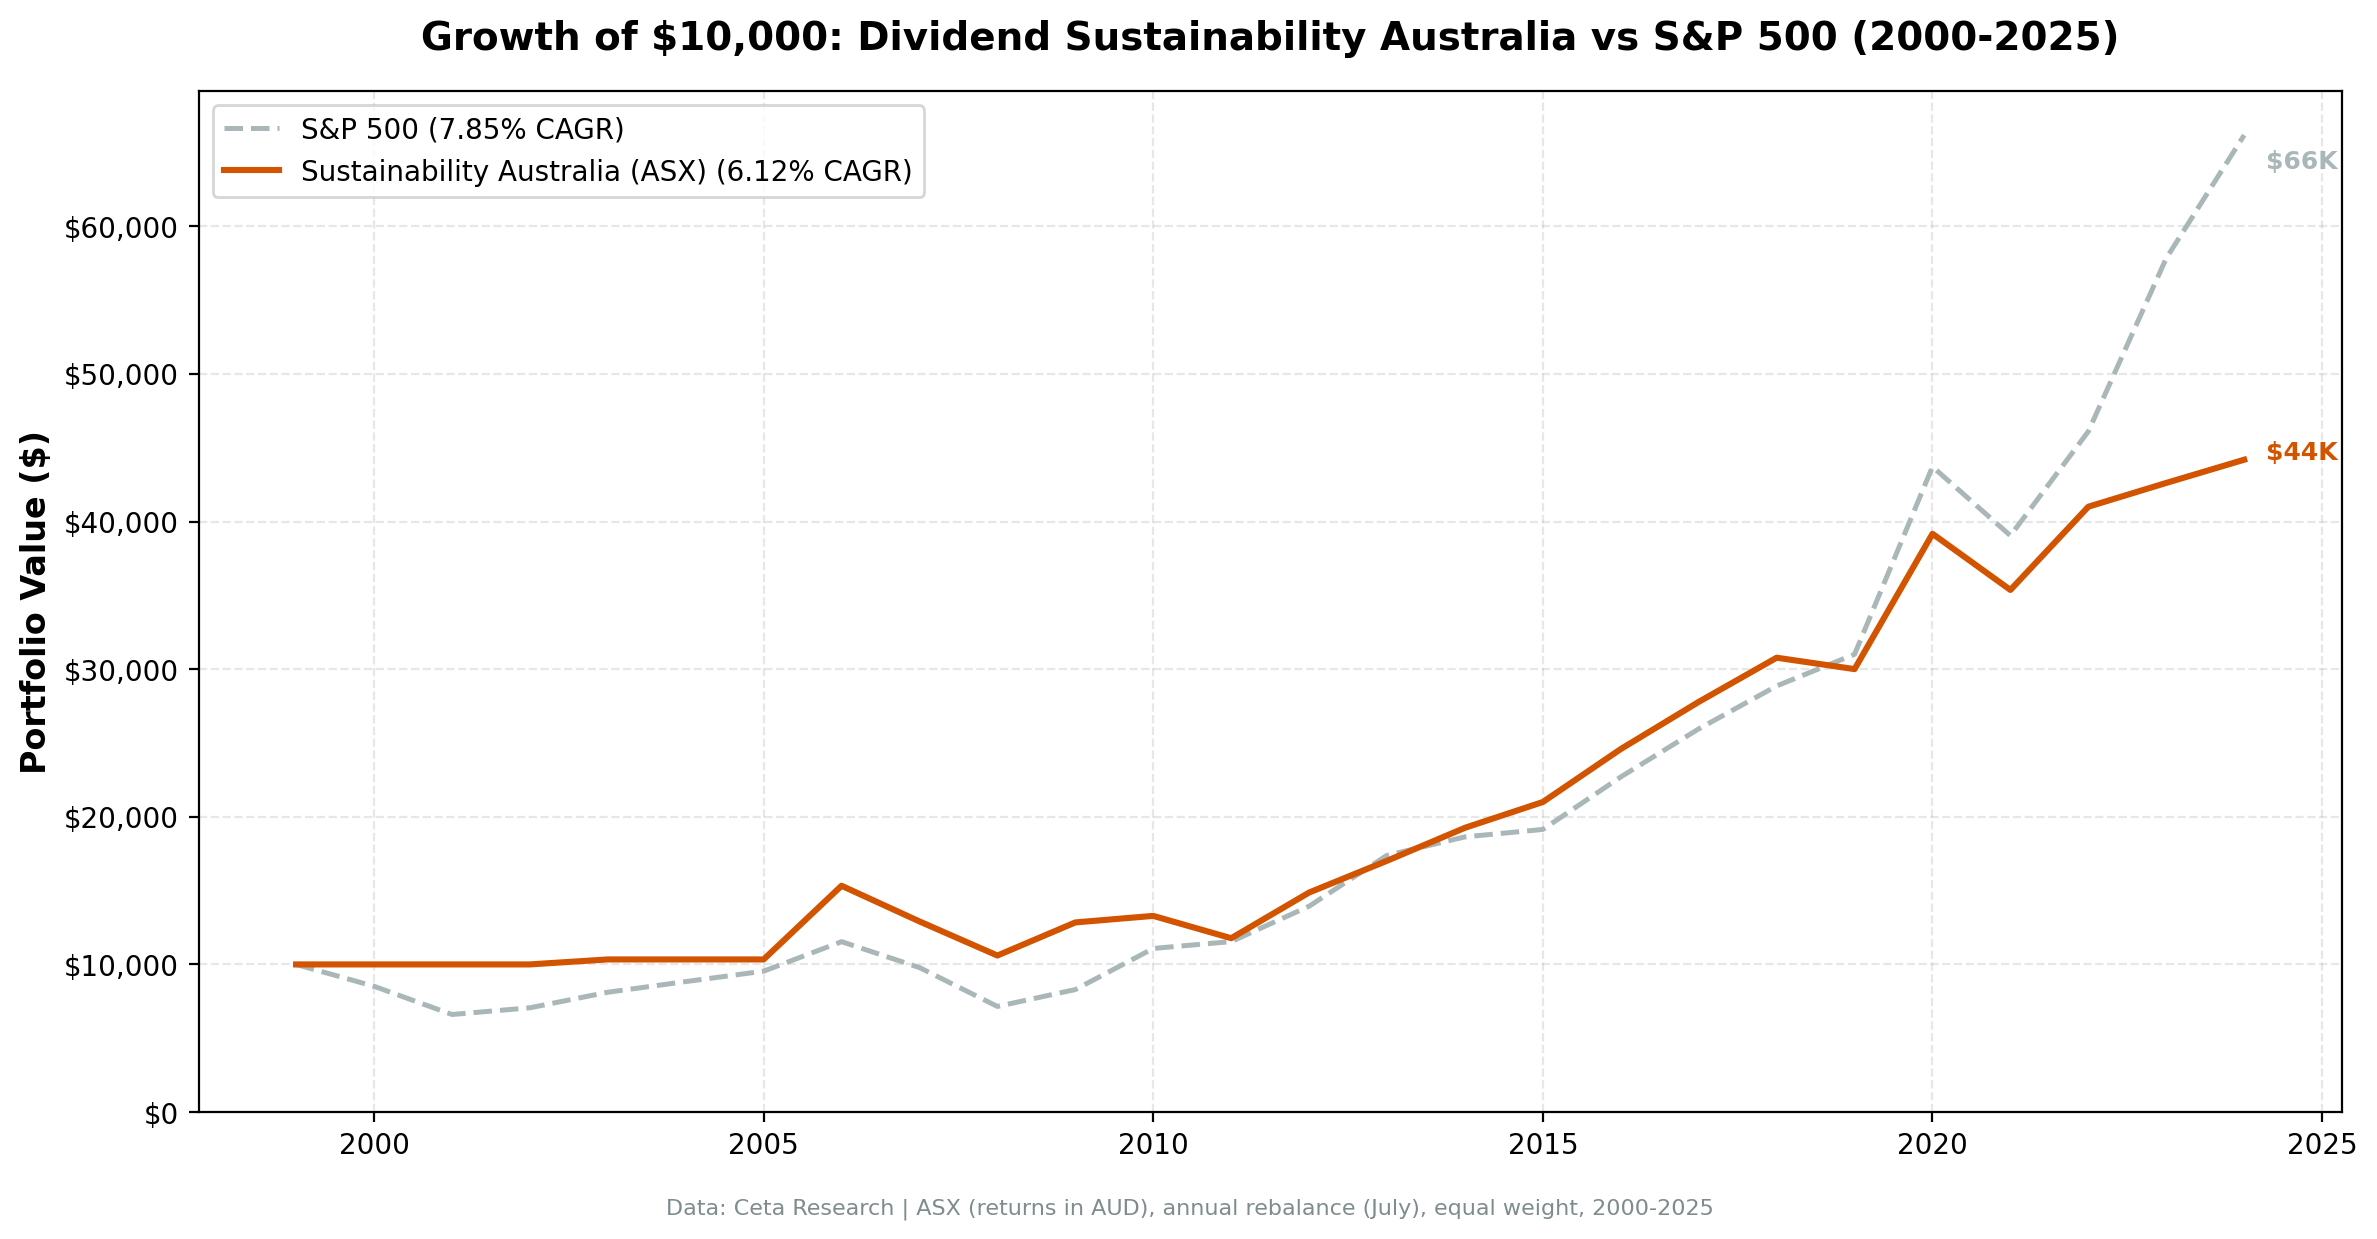
Dividend Sustainability on Australian Stocks: 6.12% CAGR, +2.23% Over ASX 200
A 5-factor dividend sustainability score backtested on ASX from 2000-2025. 6.12% CAGR, +2.23% annual excess over ASX 200, 64% win rate. Lowest volatility in our global comparison at 14.85%.

Australia has a unique dividend culture. Franking credits make dividends tax-effective, so Australian companies pay out more than their global peers. BHP, Commonwealth Bank, Woolworths, and Wesfarmers are household names that fund retirements through steady, tax-advantaged distributions.
Contents
- Method
- The Screen (SQL)
- What We Found
- 343% total return. Lowest volatility in our comparison. +2.23% annual excess over ASX 200.
- Year-by-year returns
- 2006: the big breakout year
- 2008: cushioning the GFC
- 2014-2015: defensive divergence
- 2020: COVID recovery, ASX style
- 2023-2024: lagging the index rally
- Backtest Methodology
- Limitations
- Takeaway
- Part of a Series
- References
- Run This Screen Yourself
We ran our 5-component sustainability score on ASX stocks from 2000 to 2025. The result: 6.12% CAGR with 343% total return. When benchmarked against the local ASX 200 (which returned 3.89% CAGR over the period), the strategy beats the local market by 2.23% per year with a 64% win rate. Volatility at 14.85% is the lowest in our 13-exchange comparison. Australian sustainable dividend payers delivered a smooth, steady compounding path that consistently topped the local benchmark.
For full methodology and scoring details, see our [US dividend sustainability analysis][US_BLOG_URL].
Data: FMP financial data warehouse, 2000–2025. Updated May 2026.
Method
Data source: Ceta Research (FMP financial data warehouse) Universe: ASX, market cap > 500M AUD (~$325M USD) Period: 2000-2025 (25 years, 25 annual periods) Rebalancing: Annual (July), equal weight top 30 by sustainability score descending (yield tiebreak) Benchmark: ASX 200 (S&P/ASX 200, AUD) Execution: Next-day close (market-on-close after signal) Cash rule: Hold cash if fewer than 10 stocks qualify Transaction costs: Size-tiered model (0.1-0.5% one-way based on market cap)
The sustainability score combines five components (0-2 points each, total 0-10): Payout Ratio, Debt/Equity, FCF Coverage, ROE, and Piotroski F-Score. Minimum score of 7 with yield above 2%. Full scoring methodology is in the [US blog][US_BLOG_URL].
The Screen (SQL)
WITH latest_ratios AS (
    SELECT r.symbol, r.dividendPayoutRatio, r.debtToEquityRatio,
           r.dividendYield, r.date,
        ROW_NUMBER() OVER (PARTITION BY r.symbol ORDER BY r.date DESC) AS rn
    FROM financial_ratios r
    JOIN profile p ON r.symbol = p.symbol
    WHERE r.period = 'FY'
      AND r.dividendPayoutRatio > 0
      AND r.dividendYield IS NOT NULL
      AND p.exchange IN ('ASX')
),
latest_cf AS (
    SELECT c.symbol, c.freeCashFlow, c.commonDividendsPaid, c.date,
        ROW_NUMBER() OVER (PARTITION BY c.symbol ORDER BY c.date DESC) AS rn
    FROM cash_flow_statement c
    JOIN profile p ON c.symbol = p.symbol
    WHERE c.period = 'FY'
      AND c.commonDividendsPaid < 0
      AND p.exchange IN ('ASX')
),
latest_metrics AS (
    SELECT k.symbol, k.returnOnEquity, k.marketCap, k.date,
        ROW_NUMBER() OVER (PARTITION BY k.symbol ORDER BY k.date DESC) AS rn
    FROM key_metrics k
    JOIN profile p ON k.symbol = p.symbol
    WHERE k.period = 'FY'
      AND k.marketCap IS NOT NULL
      AND p.exchange IN ('ASX')
),
latest_scores AS (
    SELECT symbol, piotroskiScore
    FROM scores
),
scored AS (
    SELECT r.symbol, r.date,
        ROUND(r.dividendPayoutRatio * 100, 1) AS payout_pct,
        ROUND(r.debtToEquityRatio, 2) AS debt_equity,
        ROUND(c.freeCashFlow / NULLIF(ABS(c.commonDividendsPaid), 0), 2) AS fcf_coverage,
        ROUND(k.returnOnEquity * 100, 1) AS roe_pct,
        s.piotroskiScore AS piotroski,
        ROUND(r.dividendYield * 100, 2) AS yield_pct,
        ROUND(k.marketCap / 1e9, 1) AS mktcap_bn,
        CASE WHEN r.dividendPayoutRatio < 0.5 THEN 2
             WHEN r.dividendPayoutRatio < 0.8 THEN 1 ELSE 0 END AS c_payout,
        CASE WHEN r.debtToEquityRatio >= 0 AND r.debtToEquityRatio < 0.5 THEN 2
             WHEN r.debtToEquityRatio >= 0 AND r.debtToEquityRatio < 1.5 THEN 1
             ELSE 0 END AS c_debt,
        CASE WHEN c.freeCashFlow > 0 AND c.commonDividendsPaid < 0
                  AND c.freeCashFlow / ABS(c.commonDividendsPaid) > 2 THEN 2
             WHEN c.freeCashFlow > 0 AND c.commonDividendsPaid < 0
                  AND c.freeCashFlow / ABS(c.commonDividendsPaid) > 1 THEN 1
             ELSE 0 END AS c_fcf,
        CASE WHEN k.returnOnEquity > 0.15 THEN 2
             WHEN k.returnOnEquity > 0.08 THEN 1 ELSE 0 END AS c_roe,
        CASE WHEN s.piotroskiScore >= 7 THEN 2
             WHEN s.piotroskiScore >= 5 THEN 1 ELSE 0 END AS c_piotroski
    FROM latest_ratios r
    JOIN latest_cf c ON r.symbol = c.symbol AND c.rn = 1
    JOIN latest_metrics k ON r.symbol = k.symbol AND k.rn = 1
    LEFT JOIN latest_scores s ON r.symbol = s.symbol
    WHERE r.rn = 1
      AND r.dividendYield > 0.02
      AND k.marketCap > 500e6
)
SELECT symbol, date, payout_pct, debt_equity, fcf_coverage, roe_pct, piotroski,
       yield_pct, mktcap_bn,
       c_payout + c_debt + c_fcf + c_roe + COALESCE(c_piotroski, 0) AS sustainability_score,
       c_payout, c_debt, c_fcf, c_roe, COALESCE(c_piotroski, 0) AS c_piotroski
FROM scored
WHERE c_payout + c_debt + c_fcf + c_roe + COALESCE(c_piotroski, 0) >= 7
ORDER BY sustainability_score DESC, yield_pct DESC
LIMIT 30
[Run this query on Ceta Research][SUSTAINABILITY_AUSTRALIA_QUERY_URL]
What We Found
343% total return. Lowest volatility in our comparison. +2.23% annual excess over ASX 200.
| Metric | Sustainability (Australia) | ASX 200 |
|---|---|---|
| CAGR | 6.12% | 3.89% |
| Volatility | 14.85% | - |
| Max Drawdown | -30.83% | - |
| Sharpe Ratio | 0.177 | - |
| Sortino Ratio | 0.398 | - |
| Win Rate (annual) | 64% | - |
| Down Capture | 53.7% | - |
| Up Capture | 108.8% | - |
| Beta | 0.85 | - |
| Alpha | 2.29% | - |
| Avg Stocks per Period | 22.4 | - |
| Cash Periods | 5 of 25 | - |
| Avg Sustainability Score | 8.0/10 | - |
The ASX 200 returned 3.89% CAGR over the period. Against that local benchmark, the sustainability screen's 2.23% annual excess and 64% win rate represent meaningful outperformance. The 14.85% volatility is the lowest in our 13-exchange comparison. Australian sustainable dividend payers are genuinely low-volatility.
Five cash years (2000-2002, plus 2004-2005) drag the absolute CAGR down. The screen couldn't find 10 qualifying ASX stocks in the early 2000s due to data coverage gaps rather than a structural market problem. The 20 invested years show solid performance vs the local benchmark. Up capture of 108.8% means the strategy slightly exceeded ASX 200 gains in up years, while 53.7% down capture shows moderate downside protection.
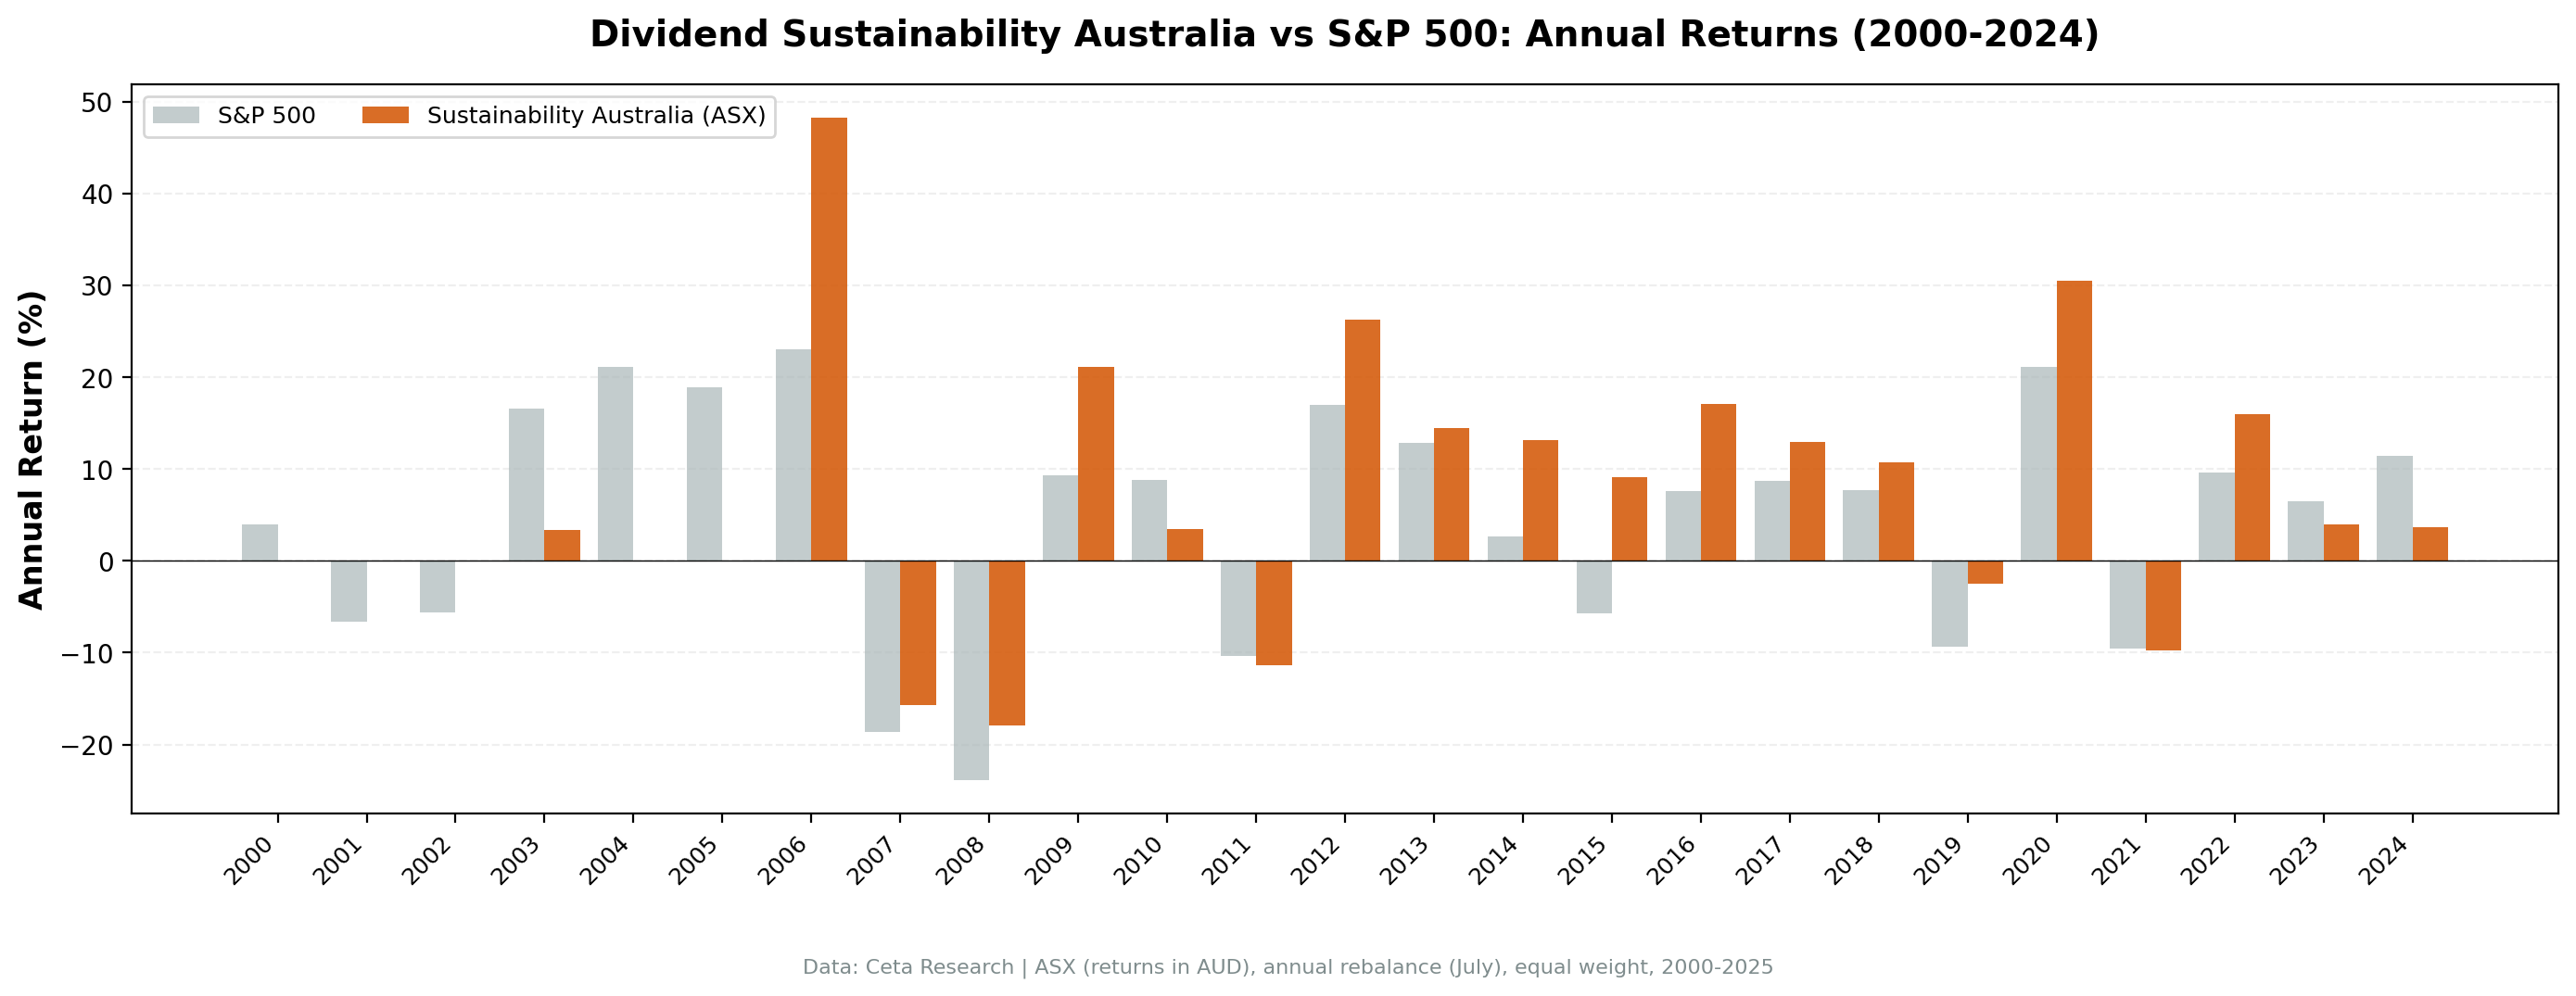
Year-by-year returns
| Year | Sustainability | ASX 200 | Excess |
|---|---|---|---|
| 2000 | 0.0% (cash) | +3.9% | -3.9% |
| 2001 | 0.0% (cash) | -6.6% | +6.6% |
| 2002 | 0.0% (cash) | -5.6% | +5.6% |
| 2003 | +3.4% | +16.6% | -13.2% |
| 2004 | 0.0% (cash) | +21.2% | -21.2% |
| 2005 | 0.0% (cash) | +18.9% | -18.9% |
| 2006 | +48.3% | +23.0% | +25.3% |
| 2007 | -15.8% | -18.7% | +2.9% |
| 2008 | -17.9% | -23.9% | +6.0% |
| 2009 | +21.2% | +9.3% | +11.8% |
| 2010 | +3.5% | +8.8% | -5.3% |
| 2011 | -11.4% | -10.4% | -1.0% |
| 2012 | +26.3% | +17.0% | +9.3% |
| 2013 | +14.5% | +12.9% | +1.6% |
| 2014 | +13.1% | +2.7% | +10.5% |
| 2015 | +9.1% | -5.7% | +14.8% |
| 2016 | +17.1% | +7.6% | +9.5% |
| 2017 | +13.0% | +8.7% | +4.3% |
| 2018 | +10.8% | +7.7% | +3.1% |
| 2019 | -2.5% | -9.3% | +6.8% |
| 2020 | +30.6% | +21.2% | +9.4% |
| 2021 | -9.7% | -9.5% | -0.2% |
| 2022 | +15.9% | +9.6% | +6.4% |
| 2023 | +3.9% | +6.5% | -2.6% |
| 2024 | +3.7% | +11.4% | -7.7% |
2006: the big breakout year
+48.3% in 2006, the strategy's best single year. Australia's commodity supercycle was in full swing, and the sustainability screen had finally found enough qualifying ASX stocks to deploy meaningfully. Mining companies with strong free cash flow, low payout ratios, and improving Piotroski scores drove performance. The ASX 200 returned a strong +23.0%, but the screen still added 25.3 points of excess. That single year built a compounding lead the strategy never gave back.
2008: cushioning the GFC
-17.9% while the ASX 200 fell 23.9%. The D/E and FCF components weeded out overleveraged banks and resource companies. Portfolio holdings had the balance sheet strength to survive the crash. 6.0 percentage points of cushion in the worst year for Australian equities since the 1990s.
2014-2015: defensive divergence
+13.1% and +9.1% while the ASX 200 returned +2.7% and -5.7%. Australia was in the middle of the commodity cycle downturn after the 2011 peak. The sustainability screen had already rotated away from cyclical miners into consumer staples, healthcare, and disciplined dividend payers. Two consecutive years of double-digit excess.
2020: COVID recovery, ASX style
+30.6% vs the ASX 200's +21.2%. Australia managed COVID well from a public health perspective, and the market recovery was strong. The sustainability portfolio captured the rally without the volatility of growth-led recoveries elsewhere.
2023-2024: lagging the index rally
The portfolio underperformed the ASX 200 in both years. Banks and resource companies rallied hard, and the sustainability filter's preference for diversified payers with lower volatility meant the portfolio missed some of the upside. This is the structural cost of running a quality-tilted screen in a market dominated by a few large cyclical names.
Backtest Methodology
| Parameter | Choice |
|---|---|
| Universe | ASX, Market Cap > 500M AUD (~$325M USD) |
| Signal | 5-component sustainability score (0-10), minimum 7 |
| Components | Payout Ratio + D/E + FCF Coverage + ROE + Piotroski F-Score |
| Filters | Dividend Yield > 2%, Market Cap > 500M AUD |
| Portfolio | Top 30 by score descending (yield tiebreak), equal weight |
| Rebalancing | Annual (July) |
| Cash rule | Hold cash if < 10 qualify |
| Benchmark | ASX 200 (AUD) |
| Execution | Next-day close (MOC after signal) |
| Period | 2000-2025 (25 years) |
| Data | Point-in-time (45-day lag for annual filings) |
| Costs | Size-tiered transaction costs applied |
| Piotroski | Computed from historical financial statements (9 binary signals) |
Limitations
Franking credits aren't captured. Australian dividends come with franking (imputation) credits that make them worth more on an after-tax basis than the raw yield suggests. Our backtest uses gross returns before tax, so it doesn't capture this benefit. For an Australian resident investor, the effective return is higher than 5.96%.
Five cash years reduce the effective test period. Like Japan, this is functionally a 20-year backtest with 5 years of zero return. Starting the test in 2005 gives a cleaner picture of how the strategy performs when it can actually invest.
Small investable universe. 22.4 average stocks per period is the lowest in our comparison. The screen sometimes struggled to fill 30 positions, meaning the portfolio concentrated in fewer names with higher idiosyncratic risk.
Currency risk. Returns are in local currency (AUD). AUD/USD fluctuations add volatility for international investors. The AUD weakened against the USD from 2013 onward, which would have further eroded returns for a US-based investor.
Survivorship bias. Exchange membership uses current company profiles. Delisted and acquired companies aren't fully captured.
Takeaway
Australia's dividend sustainability screen produced the smoothest ride in our 13-exchange comparison: 14.85% volatility, -30.83% max drawdown, and consistent positive returns once the strategy was invested. Against the ASX 200 (3.89% CAGR), the screen's 2.23% annual excess, 2.29% Jensen alpha, and 64% win rate over 25 years are a real result.
The five early cash years drag the absolute CAGR down. The 20 invested years show the strategy consistently outperforming the local market with low volatility. That's what you'd hope for from a quality dividend screen on a mature exchange.
For an Australian resident investor, the after-tax story is even better. Franking credits effectively add 1-2% to the annual yield. The strategy's 14.85% volatility and 53.7% down capture suit Australian superannuation portfolios where capital preservation matters. The 2.23% annual excess over the ASX 200 (on top of franking) makes this a genuinely useful approach for local investors.
Part of a Series
This analysis is part of our dividend sustainability global exchange comparison. We tested the same screen on 13 exchanges worldwide: - [Dividend Sustainability on US Stocks (NYSE, NASDAQ, AMEX)][US_BLOG_URL] - 10.73% CAGR, full methodology - [Dividend Sustainability on Indian Stocks (NSE)][INDIA_BLOG_URL] - 15.86% CAGR, the standout - [Dividend Sustainability on Japanese Stocks (JPX)][JAPAN_BLOG_URL] - 5.55% CAGR - [Dividend Sustainability on Hong Kong Stocks (HKSE)][HONGKONG_BLOG_URL] - 6.64% CAGR - [Dividend Sustainability: Global Exchange Comparison][COMPARISON_BLOG_URL] - full comparison table
References
- DeAngelo, H., DeAngelo, L. & Skinner, D. (1992). "Dividends and Losses." Journal of Finance, 47(5), 1837-1863.
- Piotroski, J. (2000). "Value Investing: The Use of Historical Financial Statement Information to Separate Winners from Losers." Journal of Accounting Research, 38, 1-41.
- Ainsworth, A., Partington, G. & Warren, G. (2016). "The Impact of Dividend Imputation on Share Prices, the Cost of Capital and Corporate Behaviour." CIFR Research Report.
Run This Screen Yourself
Via web UI: [Run the sustainability screen on Ceta Research][SUSTAINABILITY_AUSTRALIA_QUERY_URL]. The query is pre-loaded. Hit "Run" and see what passes today.
Via Python:
import requests, time

API_KEY = "your_api_key"  # get one at cetaresearch.com
BASE = "https://tradingstudio.finance/api/v1"

resp = requests.post(f"{BASE}/data-explorer/execute", headers={
    "X-API-Key": API_KEY, "Content-Type": "application/json"
}, json={
    "query": """
        WITH latest_ratios AS (
            SELECT r.symbol, r.dividendPayoutRatio, r.debtToEquityRatio,
                   r.dividendYield, r.date,
                ROW_NUMBER() OVER (PARTITION BY r.symbol ORDER BY r.date DESC) AS rn
            FROM financial_ratios r
            JOIN profile p ON r.symbol = p.symbol
            WHERE r.period = 'FY' AND r.dividendPayoutRatio > 0
              AND r.dividendYield IS NOT NULL
              AND p.exchange IN ('ASX')
        ),
        latest_cf AS (
            SELECT c.symbol, c.freeCashFlow, c.commonDividendsPaid, c.date,
                ROW_NUMBER() OVER (PARTITION BY c.symbol ORDER BY c.date DESC) AS rn
            FROM cash_flow_statement c
            JOIN profile p ON c.symbol = p.symbol
            WHERE c.period = 'FY' AND c.commonDividendsPaid < 0
              AND p.exchange IN ('ASX')
        ),
        latest_metrics AS (
            SELECT k.symbol, k.returnOnEquity, k.marketCap, k.date,
                ROW_NUMBER() OVER (PARTITION BY k.symbol ORDER BY k.date DESC) AS rn
            FROM key_metrics k
            JOIN profile p ON k.symbol = p.symbol
            WHERE k.period = 'FY' AND k.marketCap IS NOT NULL
              AND p.exchange IN ('ASX')
        ),
        latest_scores AS (
            SELECT symbol, piotroskiScore FROM scores
        ),
        scored AS (
            SELECT r.symbol,
                CASE WHEN r.dividendPayoutRatio < 0.5 THEN 2
                     WHEN r.dividendPayoutRatio < 0.8 THEN 1 ELSE 0 END +
                CASE WHEN r.debtToEquityRatio >= 0 AND r.debtToEquityRatio < 0.5 THEN 2
                     WHEN r.debtToEquityRatio >= 0 AND r.debtToEquityRatio < 1.5 THEN 1
                     ELSE 0 END +
                CASE WHEN c.freeCashFlow > 0 AND c.commonDividendsPaid < 0
                     AND c.freeCashFlow / ABS(c.commonDividendsPaid) > 2 THEN 2
                     WHEN c.freeCashFlow > 0 AND c.commonDividendsPaid < 0
                     AND c.freeCashFlow / ABS(c.commonDividendsPaid) > 1 THEN 1
                     ELSE 0 END +
                CASE WHEN k.returnOnEquity > 0.15 THEN 2
                     WHEN k.returnOnEquity > 0.08 THEN 1 ELSE 0 END +
                COALESCE(CASE WHEN s.piotroskiScore >= 7 THEN 2
                     WHEN s.piotroskiScore >= 5 THEN 1 ELSE 0 END, 0)
                AS score,
                ROUND(r.dividendYield * 100, 2) AS yield_pct,
                ROUND(k.marketCap / 1e9, 1) AS mktcap_bn
            FROM latest_ratios r
            JOIN latest_cf c ON r.symbol = c.symbol AND c.rn = 1
            JOIN latest_metrics k ON r.symbol = k.symbol AND k.rn = 1
            LEFT JOIN latest_scores s ON r.symbol = s.symbol
            WHERE r.rn = 1 AND r.dividendYield > 0.02 AND k.marketCap > 500e6
        )
        SELECT symbol, score, yield_pct, mktcap_bn
        FROM scored WHERE score >= 7
        ORDER BY score DESC, yield_pct DESC LIMIT 30
    """,
    "options": {"format": "json", "limit": 100}
})
task_id = resp.json()["taskId"]

while True:
    result = requests.get(f"{BASE}/tasks/data-query/{task_id}",
                          headers={"X-API-Key": API_KEY}).json()
    if result["status"] in ("completed", "failed"):
        break
    time.sleep(2)

for r in result["result"]["rows"][:10]:
    print(f"{r['symbol']:8s} score={r['score']}/10 yield={r['yield_pct']:.1f}%")
Get your API key at cetaresearch.com. The full backtest code (Python + DuckDB) is on GitHub.
Data: Ceta Research, FMP financial data warehouse. Universe: ASX. Annual rebalance (July), equal weight top 30 by sustainability score, 2000-2025.
Past performance does not guarantee future results. This is educational content, not investment advice.


