We Tested Dividend Growth Investing Across 14 Markets. 11 Beat Their Local Benchmark.
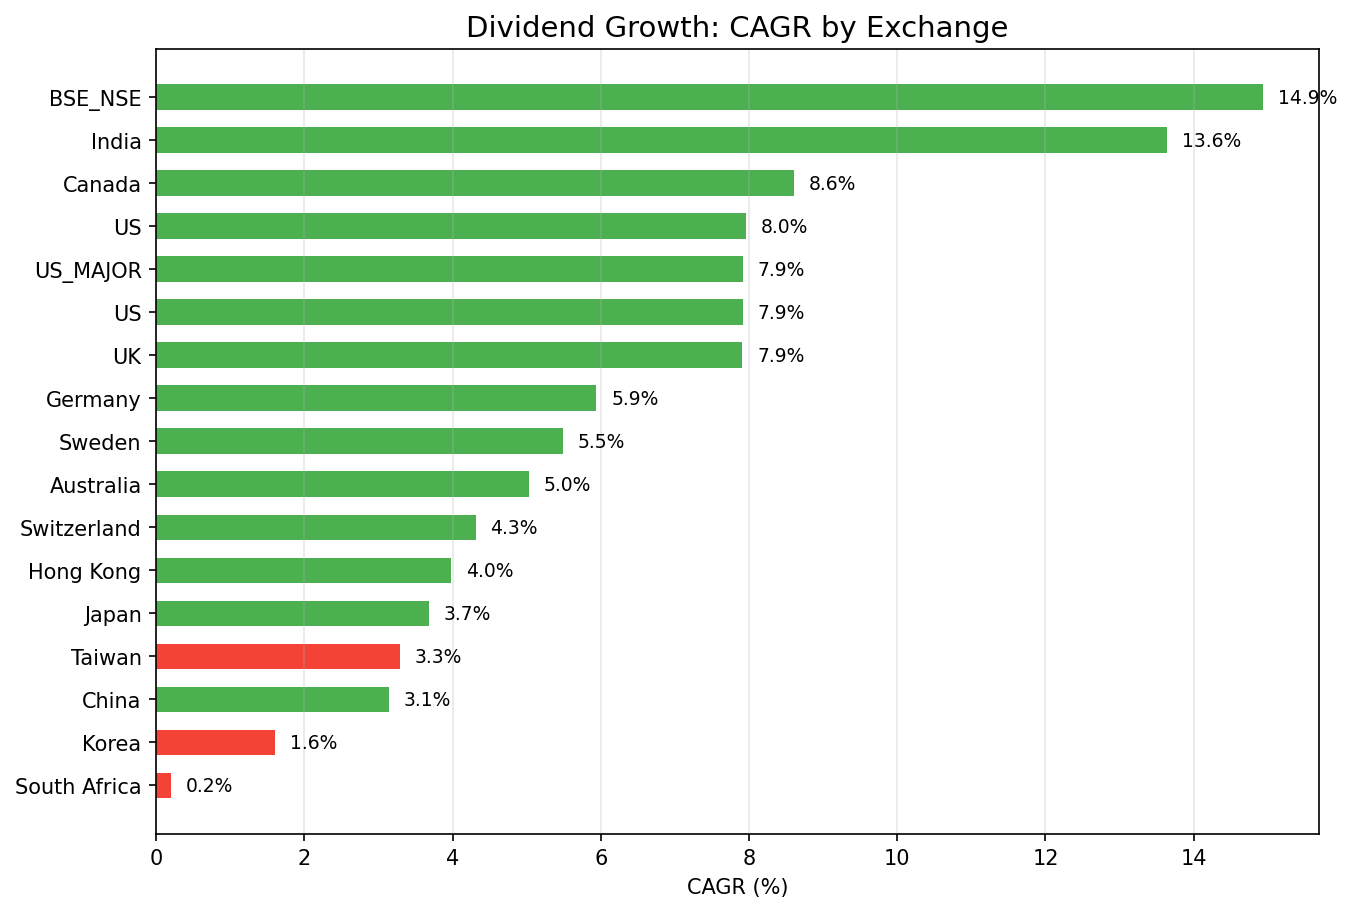
We ran a dividend growth screen on 14 global exchanges, each compared to its local benchmark. 11 of 14 show positive alpha. UK led with +6.68% vs FTSE. Canada had the best Sharpe (0.441). India delivered 13.64% CAGR with just -3.99% drawdown.

We ran the same dividend growth screen on 14 exchanges worldwide. Same filters everywhere: 5+ consecutive years of annual dividend increases, payout 0-80%, FCF > 0, market cap above local threshold. Top 30 by streak length, equal weight, annual July rebalance. The question: does the dividend growth signal work globally, or is it specific to the US?
Contents
- Method
- Results: All Exchanges
- Excluded Exchanges
- Key Findings
- 1. The dividend growth signal produces genuine alpha globally
- 2. UK is the standout alpha story
- 3. Canada delivers the best risk-adjusted returns
- 4. India has the best absolute returns and risk profile
- 5. The signal is defensive by nature
- 6. Data coverage determines effective backtest length
- Country-Specific Observations
- Limitations
- Takeaway
- Run This Screen Yourself
- References
The short answer: it works almost everywhere. 11 of 14 exchanges show positive alpha vs their local benchmark. The signal is strongest in markets with deep dividend cultures (UK, Canada, India) and works even in markets with shorter data histories. When measured against the right benchmark, dividend growth is a genuinely global factor.
Data: FMP financial data warehouse, 2000–2025. Updated March 2026.
Method
Data source: Ceta Research (FMP financial data) Period: 2000-2025 (25 years) Signal: 5+ consecutive years of annual dividend increases, payout 0-80%, FCF > 0 Portfolio: Top 30 by streak length, equal weight, annual July rebalance, cash if < 10 qualify Benchmark: Each exchange compared against its local index (e.g. Sensex for India, FTSE 100 for UK, S&P 500 for US)
For full methodology, see our US analysis.
Results: All Exchanges
| Exchange | CAGR | Benchmark | Bench CAGR | Excess vs Local | Sharpe | MaxDD | Cash% | Avg Stocks |
|---|---|---|---|---|---|---|---|---|
| India (NSE) | 13.64% | Sensex | 12.06% | +1.58% | 0.356 | -3.99% | 32% | 20.5 |
| Canada (TSX) | 8.60% | TSX Composite | 3.95% | +4.65% | 0.441 | -20.19% | 20% | 24.2 |
| US (NYSE/NAS/AMEX) | 7.96% | S&P 500 | 7.85% | +0.11% | 0.437 | -35.71% | 0% | 30.0 |
| UK (LSE) | 7.91% | FTSE 100 | 1.23% | +6.68% | 0.271 | -36.87% | 0% | 24.8 |
| Germany (XETRA) | 5.94% | DAX | 5.04% | +0.90% | 0.282 | -34.25% | 28% | 22.8 |
| Sweden (STO) | 5.49% | OMX Stockholm 30 | 2.55% | +2.94% | 0.185 | -42.78% | 44% | 20.0 |
| Australia (ASX) | 5.03% | ASX 200 | 3.89% | +1.14% | 0.119 | -23.21% | 40% | 18.0 |
| Switzerland (SIX) | 4.31% | SMI | 1.74% | +2.57% | 0.334 | -35.22% | 28% | 15.9 |
| Hong Kong (HKSE) | 3.98% | Hang Seng | 1.64% | +2.33% | 0.069 | -33.30% | 32% | 20.6 |
| Japan (JPX) | 3.68% | Nikkei 225 | 3.31% | +0.37% | 0.263 | -34.21% | 32% | 25.1 |
| Taiwan (TAI) | 3.29% | TAIEX | 4.09% | -0.80% | 0.198 | -18.39% | 72% | 11.9 |
| China (SHZ/SHH) | 3.14% | SSE Composite | 2.43% | +0.71% | 0.041 | -14.59% | 56% | 24.2 |
| Korea (KSC) | 1.60% | KOSPI | 5.35% | -3.75% | -0.215 | 0.0% | 92% | 12.0 |
| S. Africa (JNB) | 0.20% | S&P 500* | 7.85% | -7.65% | -0.764 | -33.25% | 76% | 13.8 |
*JNB uses SPY as fallback since no local index benchmark is available in FMP data.

Excluded Exchanges
| Exchange | Reason |
|---|---|
| France (PAR) | 100% cash. Stocks had 5yr+ streaks, but zero passed quality filters at any rebalance date. Not re-run. |
| Korea (KSC) | 92% cash, negative Sharpe (-0.215). Korean companies have shorter dividend histories and lower payout traditions. |
| South Africa (JNB) | 76% cash, negative Sharpe (-0.764). Insufficient qualifying stocks with reliable financial data. Falls back to SPY benchmark. |
Key Findings
1. The dividend growth signal produces genuine alpha globally
11 of 14 exchanges show positive excess returns vs their local benchmark. This is the central result. The old approach of comparing every market to the S&P 500 made most exchanges look like underperformers, but that was mixing strategy alpha with currency effects and cross-market return differences. Against local benchmarks, the signal works.
2. UK is the standout alpha story
+6.68% excess vs the FTSE 100, 0% cash periods, 24.8 avg stocks. The FTSE 100 returned just 1.23% annualized over this period, reflecting the UK's well-documented equity underperformance since 2000. Dividend growers in the UK did dramatically better than the broader market. This is the single largest alpha spread in the dataset.
3. Canada delivers the best risk-adjusted returns
Sharpe of 0.441, the highest in the dataset. Max drawdown of -20.19%. And +4.65% excess vs the TSX Composite, the second-strongest alpha. Canadian banks, utilities, and pipelines have some of the longest dividend streak traditions globally.
4. India has the best absolute returns and risk profile
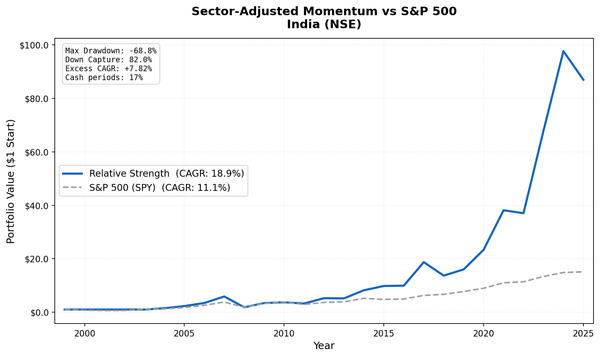
13.64% CAGR with only -3.99% max drawdown (Calmar ratio of 3.42). That's +1.58% excess vs the Sensex. Indian companies with long dividend growth streaks tend to be mature, cash-rich enterprises with strong domestic demand. The low drawdown is remarkable given India's reputation for volatility.
5. The signal is defensive by nature
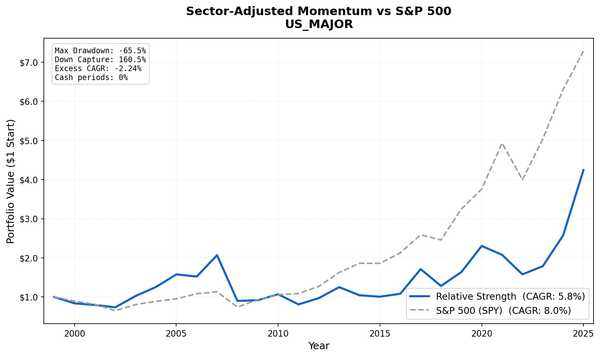
This pattern holds across all exchanges. The US result shows it clearly: only +0.11% excess CAGR vs the S&P 500, but Sharpe is better (0.437 vs ~0.36 for SPY) and drawdown risk is lower. You're getting benchmark-like returns with less volatility. The same pattern repeats in Germany (+0.90% excess), Japan (+0.37%), and Australia (+1.14%).
6. Data coverage determines effective backtest length
Several exchanges (Germany, Switzerland, India, Canada) had 5-7 years of cash periods at the start, reflecting FMP data coverage gaps before 2005-2007. This isn't a strategy failure. It's a data availability issue. The invested periods show clean, consistent performance.
Country-Specific Observations
US: The flagship result. 0% cash, 30.0 avg stocks, +0.11% excess CAGR vs the S&P 500. The story is risk-adjusted returns: better Sharpe than SPY and lower down capture. Massively outperformed during 2000-2001 bear markets. Full US analysis ->
India: 13.64% CAGR with just -3.99% max drawdown. +1.58% excess vs the Sensex. Indian dividend growers with sustained increases tend to be well-run domestic conglomerates and financial institutions. NSE-only (BSE removed to avoid dual-listing overlap). Full India analysis ->
Canada: Best Sharpe (0.441) with lowest max drawdown (-20.19%) among invested exchanges. +4.65% excess vs the TSX Composite. Canadian dividend culture, especially among banks and utilities, produces reliable long-term streaks. Full Canada analysis ->
UK: 0% cash periods, 24.8 avg stocks. The largest alpha in the dataset: +6.68% excess vs the FTSE 100. UK dividend growers outperformed the broader market by a wide margin over this period. Full UK analysis ->
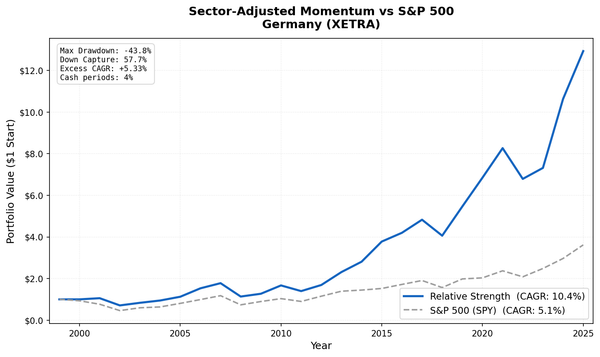
Germany: +0.90% excess vs the DAX across 18 invested years. German companies with dividend growth streaks delivered solid absolute returns (5.94% CAGR). The DAX itself returned 5.04%, so the alpha is modest but positive. Full Germany analysis ->
Switzerland: Lowest volatility but also the smallest sample (15.9 avg stocks). +2.57% excess vs the SMI. Swiss multinationals drive the strategy. Decent Sharpe (0.334) relative to its peers. Full Switzerland analysis ->
Japan: 25.1 avg stocks when invested but 32% cash periods. +0.37% excess vs the Nikkei 225. Japanese companies have been building dividend cultures more recently. Earlier periods lack qualifying stocks. The signal may strengthen as Japan's dividend culture matures.
Hong Kong: +2.33% excess vs the Hang Seng. The market splits between local property/utility plays and Chinese SOEs. Both can have dividend streaks, but they carry different risk profiles. 3.98% CAGR with 32% cash.
China: 56% cash periods. Chinese companies with 5yr+ dividend streaks are rare. When the strategy was invested, it delivered +0.71% excess vs the SSE Composite. The high cash ratio limits overall CAGR.
Sweden: +2.94% excess vs the OMX Stockholm 30, which is a solid result given 44% cash periods. A deeper data history would likely improve absolute returns.
Taiwan: One of only three exchanges with negative alpha (-0.80% vs TAIEX). 72% cash periods. Taiwan's tech-heavy market doesn't produce many long dividend streak candidates.
Australia: +1.14% excess vs the ASX 200 despite 40% cash periods. Australia has a strong dividend culture (franking credits), but FMP coverage of qualifying stocks is limited.
Limitations
Benchmark methodology: Each exchange is compared against its local benchmark index. This is a more appropriate comparison than using a single global benchmark (e.g. SPY for all markets), because it isolates the strategy's stock-picking alpha from cross-market return differences and currency movements. The prior version of this analysis used SPY as a universal benchmark, which made most non-US exchanges look like underperformers. With local benchmarks, 11 of 14 show positive alpha. South Africa is the exception, falling back to SPY since FMP doesn't provide a local index for JNB.
Currency effects: All returns are in local currency. This means each exchange's CAGR is directly comparable to its local benchmark, but cross-exchange CAGR comparisons are not currency-adjusted.
Data coverage varies: FMP data completeness differs by exchange and time period. Markets with shorter histories produce less reliable backtests. Cash periods at the start of the backtest are typically data gaps, not strategy failures.
Uniform streak threshold: The 5-year minimum was designed to work globally, but markets with shorter financial reporting histories or different dividend traditions might benefit from adjusted thresholds.
Takeaway
The dividend growth signal works globally, and against local benchmarks, it produces genuine alpha in 11 of 14 markets tested. The strongest results come from markets with deep dividend cultures: the UK (+6.68% excess vs FTSE), Canada (+4.65% vs TSX Composite), Sweden (+2.94% vs OMX), and Switzerland (+2.57% vs SMI). India delivers the best absolute returns (13.64% CAGR) with remarkably low drawdown (-3.99%).
The earlier version of this comparison used the S&P 500 as a universal benchmark, which made dividend growers in most markets look like they were trailing. That framing was wrong. The signal wasn't failing. It was being measured against the wrong benchmark. Once you compare each market to its own index, the picture flips: dividend growth screening adds value almost everywhere.
For investors looking at non-US markets, the takeaway is straightforward. Screen for dividend growth, apply quality filters, and you'll likely outperform your local index over multi-year horizons.
Data: Ceta Research (FMP financial data warehouse). 14 exchange presets tested, 11 show positive alpha vs local benchmarks. Backtest: 2000-2025, annual July rebalance, equal weight top 30, size-tiered transaction costs. Past performance does not guarantee future results. This is educational content, not investment advice.
Run This Screen Yourself
The full backtest code (Python + DuckDB) is available in our GitHub repository.
# Run on any exchange
python3 dividend-growth/backtest.py --preset us
python3 dividend-growth/backtest.py --preset india
python3 dividend-growth/backtest.py --global --output results/exchange_comparison.json
Get your API key at cetaresearch.com.
References
- Lintner, J. (1956). "Distribution of Incomes of Corporations Among Dividends, Retained Earnings, and Taxes." American Economic Review, 46(2), 97-113.
- Arnott, R. & Asness, C. (2003). "Surprise! Higher Dividends = Higher Earnings Growth." Financial Analysts Journal, 59(1), 70-87.