
Dividend Coverage on Swedish Stocks: Best Risk-Adjusted Returns in Our Global Test
We screened Stockholm-listed stocks for FCF-backed dividends. 10.74% CAGR over 25 years with a 0.485 Sharpe ratio, among the highest risk-adjusted returns of any exchange we tested. Just -3.4% in 2008.

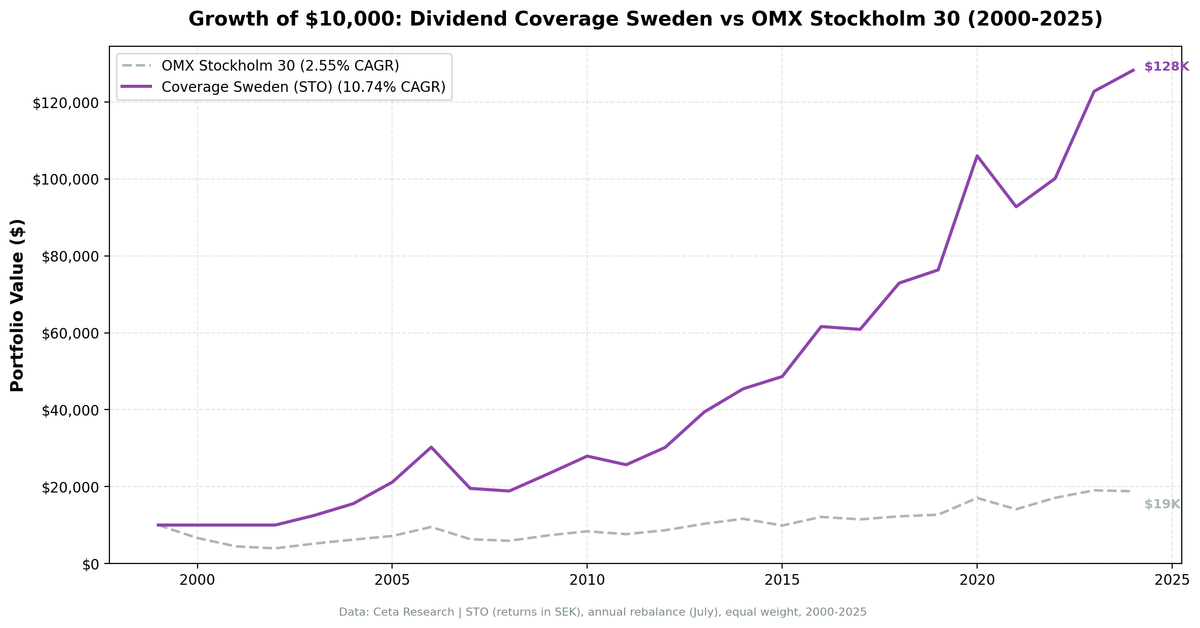
We screened Stockholm-listed stocks for companies whose free cash flow comfortably covers their dividend payments. Coverage between 1.5x and 20x, yield above 2%, annual rebalance. The result: 10.74% CAGR over 25 years with a 0.485 Sharpe ratio, among the highest risk-adjusted returns of any exchange we tested. The portfolio held cash in only 3 of 25 periods, averaging 23 stocks when invested. During 2008, coverage stocks lost just 3.4% while global markets collapsed.
Contents
- Method
- What is Dividend Coverage?
- The Screen (SQL)
- What We Found
- 25 years of data. 8.19% annual alpha with one of the highest Sharpe ratios in our global test.
- Year-by-year returns
- The early years: cash, then a strong start
- 2008: the standout year
- 2020: another strong year
- Where the strategy struggles
- Currency Warning
- Backtest Methodology
- Limitations
- Takeaway
- Part of a Series
- References
- Run This Screen Yourself
Data: FMP financial data warehouse, 2000–2025. Updated March 2026.
Method
Data source: Ceta Research (FMP financial data warehouse) Universe: Stockholm Stock Exchange (STO), market cap > 5B SEK Period: 2000-2025 (25 years, 25 annual periods) Rebalancing: Annual (July), equal weight top 30 by coverage descending Benchmark: OMX Stockholm 30 (^OMXS30, price return) Cash rule: Hold cash if fewer than 10 stocks qualify Transaction costs: Size-tiered model (0.1-0.5% one-way based on market cap)
(Note: benchmark is price return index, excluding dividends.)
Financial data uses a 45-day lag to prevent look-ahead bias. July rebalance ensures fiscal year filings are available.
What is Dividend Coverage?
Coverage measures whether a company can afford its dividend from cash, not earnings. The formula:
FCF Coverage = Free Cash Flow / ABS(Common Dividends Paid)
Earnings can be manipulated through depreciation, amortization, and stock-based compensation. Free cash flow is harder to fake. A company with 3x coverage generates three kronor of free cash for every krona it sends to shareholders. Below 1x, the company is borrowing or drawing down reserves to maintain its dividend.
Sweden has one of Europe's strongest dividend cultures. Swedish companies routinely pay 40-60% of earnings as dividends, and institutional investors expect it. The coverage filter separates companies that can sustain these payments from those stretching to maintain them.
Screen Filters:
| Criterion | Metric | Threshold |
|---|---|---|
| Dividend safety | FCF / ABS(Dividends Paid) | 1.5x to 20x |
| Meaningful yield | Dividend Yield | > 2% |
| Institutional grade | Market Cap | > 5B SEK |
Coverage below 1.5x is too thin. Above 20x usually means a token dividend. The yield filter removes companies paying negligible dividends despite high coverage. Combined, these three filters isolate companies with meaningful, well-funded dividend payments.
Academic basis: Benartzi, Michaely & Thaler (1997) showed that dividend changes signal information about future cash flows. Managers are reluctant to cut dividends even when fundamentals deteriorate. They stretch, borrow, and defer capex to maintain payments. Coverage catches this: when FCF drops below dividends paid, the company is funding shareholders from something other than operations.
The Screen (SQL)
WITH latest_cf AS (
    SELECT c.symbol, c.freeCashFlow, c.commonDividendsPaid, c.date,
        ROW_NUMBER() OVER (PARTITION BY c.symbol ORDER BY c.date DESC) AS rn
    FROM cash_flow_statement c
    JOIN profile p ON c.symbol = p.symbol
    WHERE c.period = 'FY'
      AND c.commonDividendsPaid < 0
      AND c.freeCashFlow > 0
      AND p.exchange IN ('STO')
),
latest_ratios AS (
    SELECT symbol, dividendYield, date,
        ROW_NUMBER() OVER (PARTITION BY symbol ORDER BY date DESC) AS rn
    FROM financial_ratios
    WHERE period = 'FY' AND dividendYield IS NOT NULL
),
latest_metrics AS (
    SELECT symbol, marketCap, date,
        ROW_NUMBER() OVER (PARTITION BY symbol ORDER BY date DESC) AS rn
    FROM key_metrics
    WHERE period = 'FY' AND marketCap IS NOT NULL
)
SELECT
    cf.symbol,
    ROUND(cf.freeCashFlow / NULLIF(ABS(cf.commonDividendsPaid), 0), 2) AS coverage,
    ROUND(r.dividendYield * 100, 2) AS yield_pct,
    ROUND(cf.freeCashFlow / 1e9, 2) AS fcf_bn,
    ROUND(km.marketCap / 1e9, 1) AS mktcap_bn
FROM latest_cf cf
JOIN latest_ratios r ON cf.symbol = r.symbol AND r.rn = 1
JOIN latest_metrics km ON cf.symbol = km.symbol AND km.rn = 1
WHERE cf.rn = 1
  AND cf.freeCashFlow / NULLIF(ABS(cf.commonDividendsPaid), 0) BETWEEN 1.5 AND 20
  AND r.dividendYield > 0.02
  AND km.marketCap > 5e9
ORDER BY coverage DESC
LIMIT 30
Run this query on Ceta Research
What We Found

25 years of data. 8.19% annual alpha with one of the highest Sharpe ratios in our global test.
| Metric | Coverage (STO) | OMX Stockholm 30 |
|---|---|---|
| CAGR | 10.74% | 2.55% |
| Total Return | 1,183% | 88% |
| Volatility | 18.02% | 20.52% |
| Max Drawdown | -37.68% | -60.54% |
| Sharpe Ratio | 0.485 | 0.027 |
| Win Rate (annual) | 84% | - |
| Avg Stocks per Period | 22.7 | - |
| Cash Periods | 3 of 25 | - |
$10,000 invested in 2000 grew to roughly $128,000. The Sharpe ratio of 0.485 is among the highest of any exchange we tested globally. That means Sweden delivered strong return per unit of risk.
The volatility of 18.02% is notably lower than the US coverage portfolio (22.4%). Swedish dividend payers tend to be stable industrials and consumer companies. Fewer biotech lottery tickets, fewer meme stocks.
Year-by-year returns
| Year | Coverage | OMX Stockholm 30 | Excess |
|---|---|---|---|
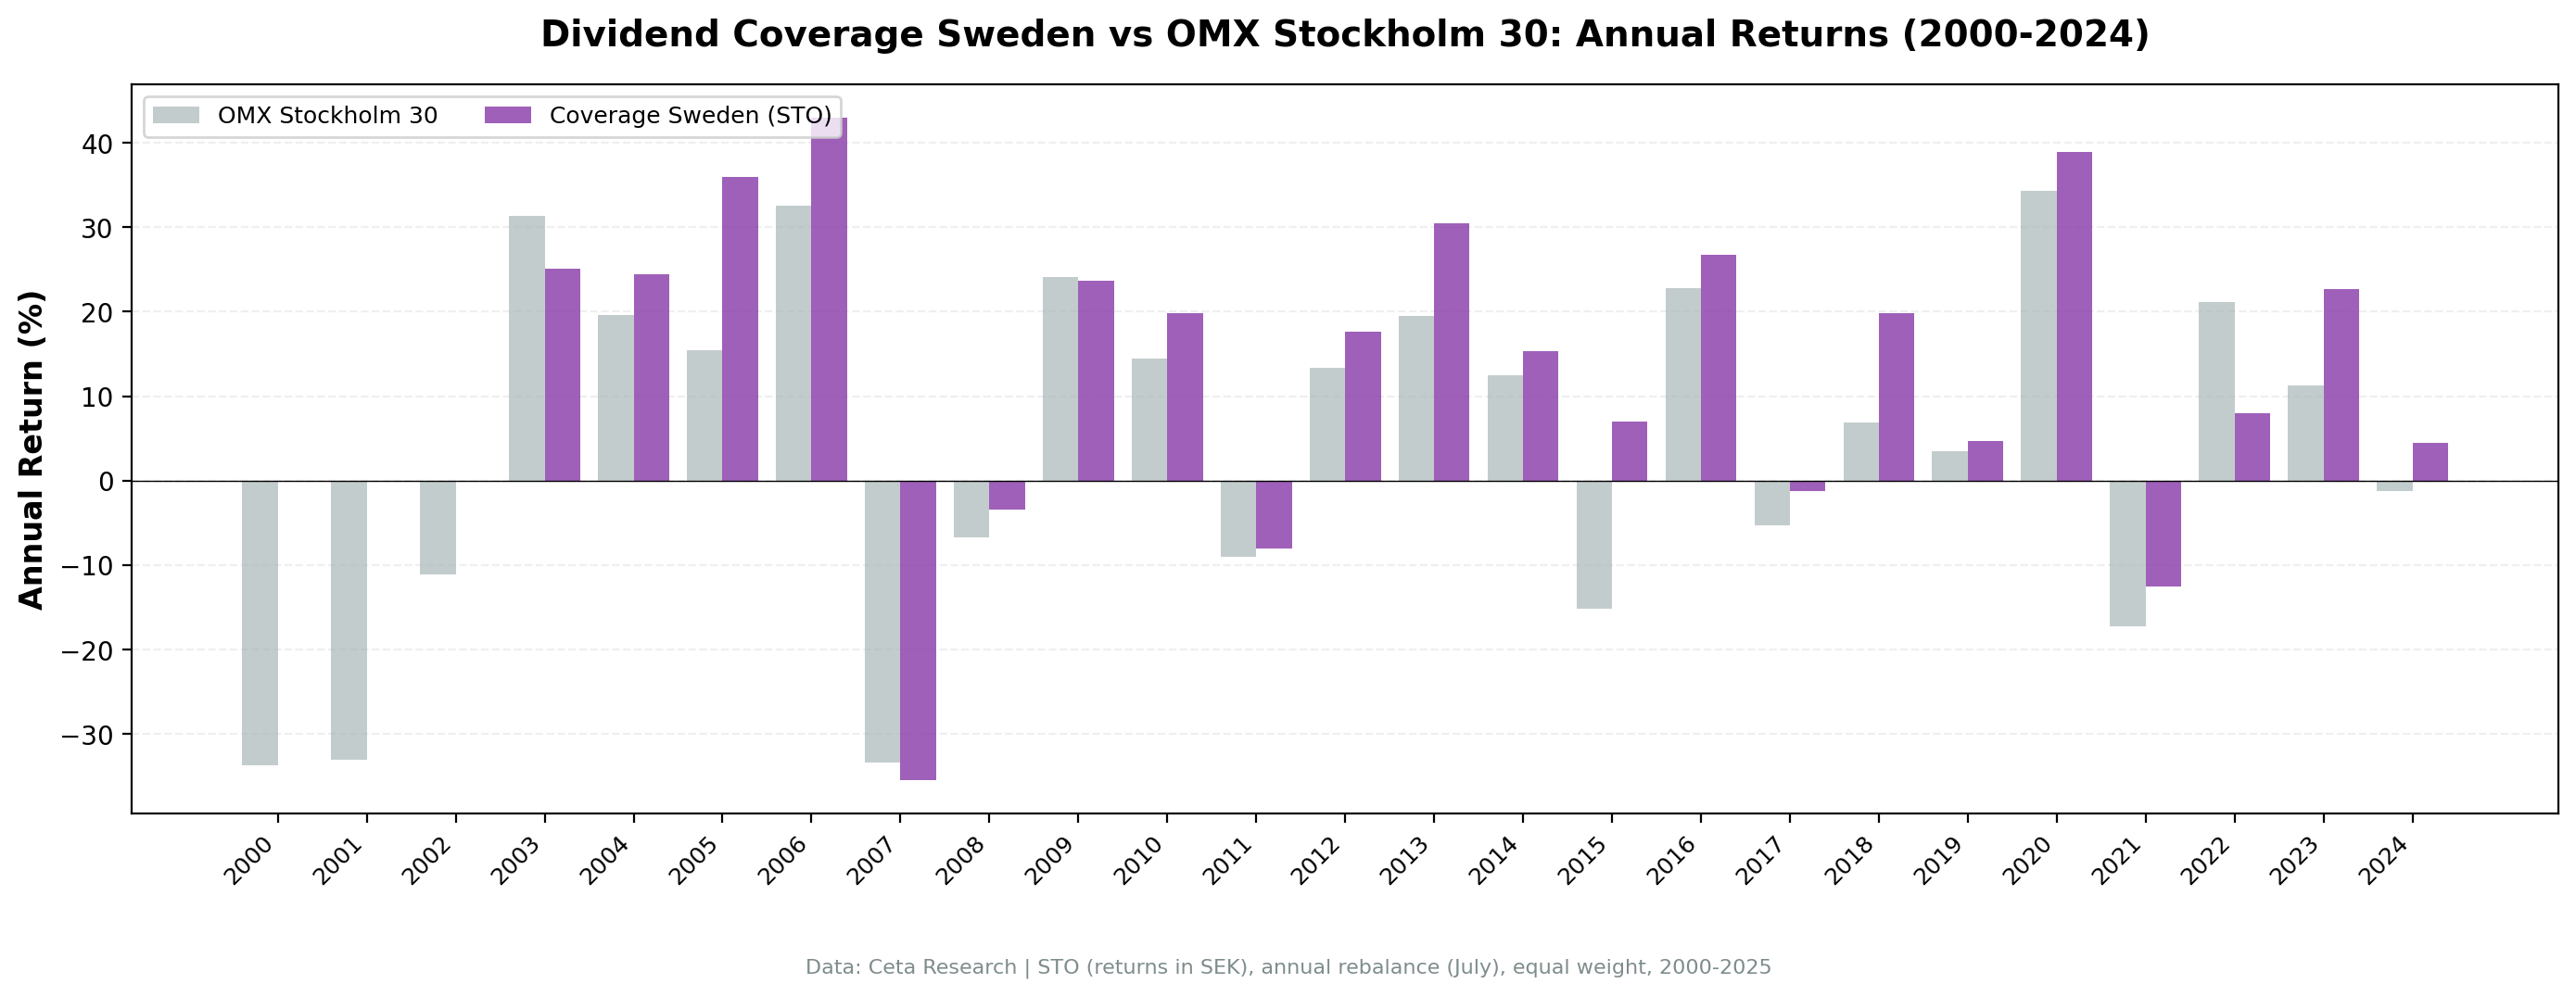
| 2000 | 0.0% (cash) | -33.7% | - |
| 2001 | 0.0% (cash) | -33.0% | - |
| 2002 | 0.0% (cash) | -11.2% | - |
| 2003 | +25.1% | +31.3% | -6.2% |
| 2004 | +24.4% | +19.6% | +4.8% |
| 2005 | +35.9% | +15.5% | +20.4% |
| 2006 | +43.0% | +32.6% | +10.4% |
| 2007 | -35.5% | -33.4% | -2.1% |
| 2008 | -3.4% | -6.7% | +3.3% |
| 2009 | +23.7% | +24.1% | -0.4% |
| 2010 | +19.8% | +14.5% | +5.3% |
| 2011 | -8.0% | -9.0% | +0.9% |
| 2012 | +17.6% | +13.3% | +4.3% |
| 2013 | +30.4% | +19.5% | +10.9% |
| 2014 | +15.3% | +12.5% | +2.8% |
| 2015 | +7.0% | -15.1% | +22.1% |
| 2016 | +26.7% | +22.8% | +4.0% |
| 2017 | -1.2% | -5.3% | +4.1% |
| 2018 | +19.8% | +6.9% | +12.9% |
| 2019 | +4.7% | +3.5% | +1.2% |
| 2020 | +38.9% | +34.3% | +4.5% |
| 2021 | -12.5% | -17.3% | +4.8% |
| 2022 | +7.9% | +21.2% | -13.2% |
| 2023 | +22.6% | +11.3% | +11.3% |
| 2024 | +4.5% | -1.2% | +5.7% |
The early years: cash, then a strong start
The portfolio sat in cash for 2000-2002. Not enough Swedish stocks met the coverage and yield filters in those years. When the strategy went live in 2003, it immediately delivered: +25.1%, +24.4%, +35.9%, +43.0% over four consecutive years. That 2003-2006 run produced a cumulative return of roughly 200%, establishing the alpha early.
2008: the standout year
| Year | Coverage | OMX Stockholm 30 | Excess |
|---|---|---|---|
| 2008 | -3.4% | -6.7% | +3.3% |
The coverage filter shed companies stretching to pay dividends before the crisis hit. Swedish industrials like Atlas Copco and Sandvik, with strong FCF and comfortable coverage, held up while banks and cyclicals collapsed. The OMX30 fell 6.7%, coverage stocks fell only 3.4%.
2020: another strong year
+38.9% return, +4.5% excess. The COVID recovery favored cash-rich dividend payers globally, and Sweden was no exception. The portfolio's largest single-year gain, with solid excess over the OMX Stockholm 30.
Where the strategy struggles
2007 was the single worst year in absolute terms: -35.5% with -2.1% excess. The financial crisis hit Swedish banks hard, and coverage stocks were not immune to the initial selloff (though the recovery in 2008 was better than the benchmark). 2022 was the worst excess year (-13.2%) as the OMX30 rallied while coverage stocks lagged. 2024 was also weak (+4.5%, +5.7% excess vs the benchmark, but low absolute return).
Currency Warning
All returns are in Swedish Kronor (SEK). The SEK depreciated significantly against the USD over this period, losing roughly 40% since 2000. A US-based investor's returns would be meaningfully lower after currency conversion. Conversely, a Swedish investor comparing to their local benchmark sees the full alpha. If you're investing cross-border, currency hedging costs or exchange rate movements will affect realized returns.
Backtest Methodology
| Parameter | Choice |
|---|---|
| Universe | STO, Market Cap > 5B SEK |
| Signal | FCF / ABS(Dividends Paid) between 1.5x and 20x |
| Filters | Dividend Yield > 2%, Market Cap > 5B SEK |
| Portfolio | Top 30 by coverage descending, equal weight |
| Rebalancing | Annual (July) |
| Cash rule | Hold cash if < 10 qualify |
| Benchmark | OMX Stockholm 30 (^OMXS30, price return) |
| Period | 2000-2025 (25 years) |
| Data | Point-in-time (45-day lag for annual filings) |
| Costs | Size-tiered transaction costs applied |
Limitations
Three cash periods. 2000-2002 had too few qualifying stocks. The market cap threshold of 5B SEK and the coverage filters combined to screen out too many companies in those early years. This means the track record is really 22 invested years, not 25.
Smaller universe. Stockholm has fewer listed companies than NYSE or LSE. The top 30 filter sometimes pulls in marginal candidates near the coverage boundary.
Annual rebalancing is slow. A company's coverage can deteriorate between July rebalances. Monthly or quarterly rebalancing would catch problems faster but increase turnover and costs.
Coverage is backward-looking. The ratio uses last fiscal year's cash flow statement. A company with 5x coverage today could have a business downturn tomorrow.
Sector concentration. Swedish markets are heavy in industrials, real estate, and financials. The screen doesn't balance sectors. Some years skew heavily toward one group.
Survivorship bias. Exchange membership uses current company profiles. Companies that delisted, went bankrupt, or were acquired aren't fully captured.
Takeaway
The dividend coverage screen delivers strong risk-adjusted returns on Swedish stocks. 10.74% CAGR, 0.485 Sharpe, and low volatility (18.02%) of the markets we tested with meaningful sample sizes. The 2008 result (just -3.4% vs -6.7% for the benchmark) shows what well-covered dividends do in a crisis: they hold better.
Sweden's dividend culture helps. Companies there treat dividends seriously, and the coverage filter separates the ones that can back it up from the ones that can't. Three cash years at the start are a limitation, but the 22 invested years tell a consistent story.
The 8.19% annual alpha vs the OMX Stockholm 30 price return (2.89% vs the S&P 500 Total Return) is real, but comes in chunks. Some years (2005, 2015, 2018) deliver large outperformance. Others (2003, 2022) give it back. Factor strategies require patience. Sweden rewards it more consistently than most markets.
Part of a Series
This analysis is part of our dividend coverage global exchange comparison. We tested the same screen on 12 exchanges worldwide: - Dividend Coverage on US Stocks (NYSE, NASDAQ, AMEX) - 11.56% CAGR, the baseline - Dividend Coverage on Canadian Stocks (TSX) - 10.84% CAGR, lowest volatility - Dividend Coverage on Japanese Stocks (JPX) - 7.88% CAGR, matched SPY - Dividend Coverage: 12-Exchange Global Comparison - full comparison table
References
- Benartzi, S., Michaely, R. & Thaler, R. (1997). "Do Changes in Dividends Signal the Future or the Past?" Journal of Finance, 52(3), 1007-1034.
- DeAngelo, H., DeAngelo, L. & Skinner, D. (1996). "Reversal of Fortune: Dividend Signaling and the Disappearance of Sustained Earnings Growth." Journal of Financial Economics, 40(3), 341-371.
Run This Screen Yourself
Via web UI: Run the coverage screen on Ceta Research. The query is pre-loaded. Hit "Run" and see what passes today.
Via Python:
import requests, time

API_KEY = "your_api_key"  # get one at cetaresearch.com
BASE = "https://tradingstudio.finance/api/v1"

resp = requests.post(f"{BASE}/data-explorer/execute", headers={
    "X-API-Key": API_KEY, "Content-Type": "application/json"
}, json={
    "query": """
        WITH latest_cf AS (
            SELECT c.symbol, c.freeCashFlow, c.commonDividendsPaid, c.date,
                ROW_NUMBER() OVER (PARTITION BY c.symbol ORDER BY c.date DESC) AS rn
            FROM cash_flow_statement c
            JOIN profile p ON c.symbol = p.symbol
            WHERE c.period = 'FY' AND c.commonDividendsPaid < 0
              AND c.freeCashFlow > 0 AND p.exchange IN ('STO')
        ),
        latest_ratios AS (
            SELECT symbol, dividendYield,
                ROW_NUMBER() OVER (PARTITION BY symbol ORDER BY date DESC) AS rn
            FROM financial_ratios WHERE period = 'FY' AND dividendYield IS NOT NULL
        ),
        latest_metrics AS (
            SELECT symbol, marketCap,
                ROW_NUMBER() OVER (PARTITION BY symbol ORDER BY date DESC) AS rn
            FROM key_metrics WHERE period = 'FY' AND marketCap IS NOT NULL
        )
        SELECT cf.symbol,
            ROUND(cf.freeCashFlow / NULLIF(ABS(cf.commonDividendsPaid), 0), 2) AS coverage,
            ROUND(r.dividendYield * 100, 2) AS yield_pct,
            ROUND(km.marketCap / 1e9, 1) AS mktcap_bn
        FROM latest_cf cf
        JOIN latest_ratios r ON cf.symbol = r.symbol AND r.rn = 1
        JOIN latest_metrics km ON cf.symbol = km.symbol AND km.rn = 1
        WHERE cf.rn = 1
          AND cf.freeCashFlow / NULLIF(ABS(cf.commonDividendsPaid), 0) BETWEEN 1.5 AND 20
          AND r.dividendYield > 0.02 AND km.marketCap > 5e9
        ORDER BY coverage DESC LIMIT 30
    """,
    "options": {"format": "json", "limit": 100}
})
task_id = resp.json()["taskId"]

while True:
    result = requests.get(f"{BASE}/tasks/data-query/{task_id}",
                          headers={"X-API-Key": API_KEY}).json()
    if result["status"] in ("completed", "failed"):
        break
    time.sleep(2)

for r in result["result"]["rows"][:10]:
    print(f"{r['symbol']:8s} coverage={r['coverage']:.1f}x yield={r['yield_pct']:.1f}%")
Get your API key at cetaresearch.com. The full backtest code (Python + DuckDB) is on GitHub.
Data: Ceta Research, FMP financial data warehouse. Universe: STO. Annual rebalance (July), equal weight top 30, 2000-2025.
Past performance does not guarantee future results. This is educational content, not investment advice.


