
Dividend Coverage on Indian Stocks: 17.24% CAGR Over 25 Years of NSE Data
We screened NSE-listed Indian stocks for companies whose free cash flow covers dividend payments. 17.24% CAGR over 25 years vs 12.06% for the Sensex. The 2008 crisis year returned +39.4% vs Sensex +7.3%.

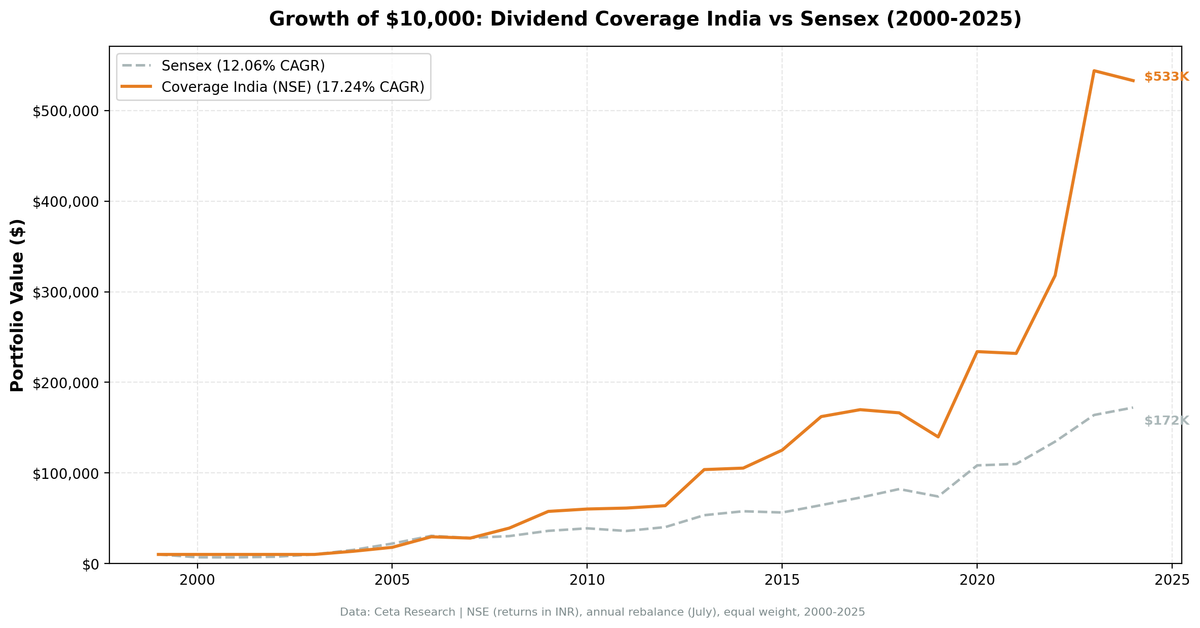
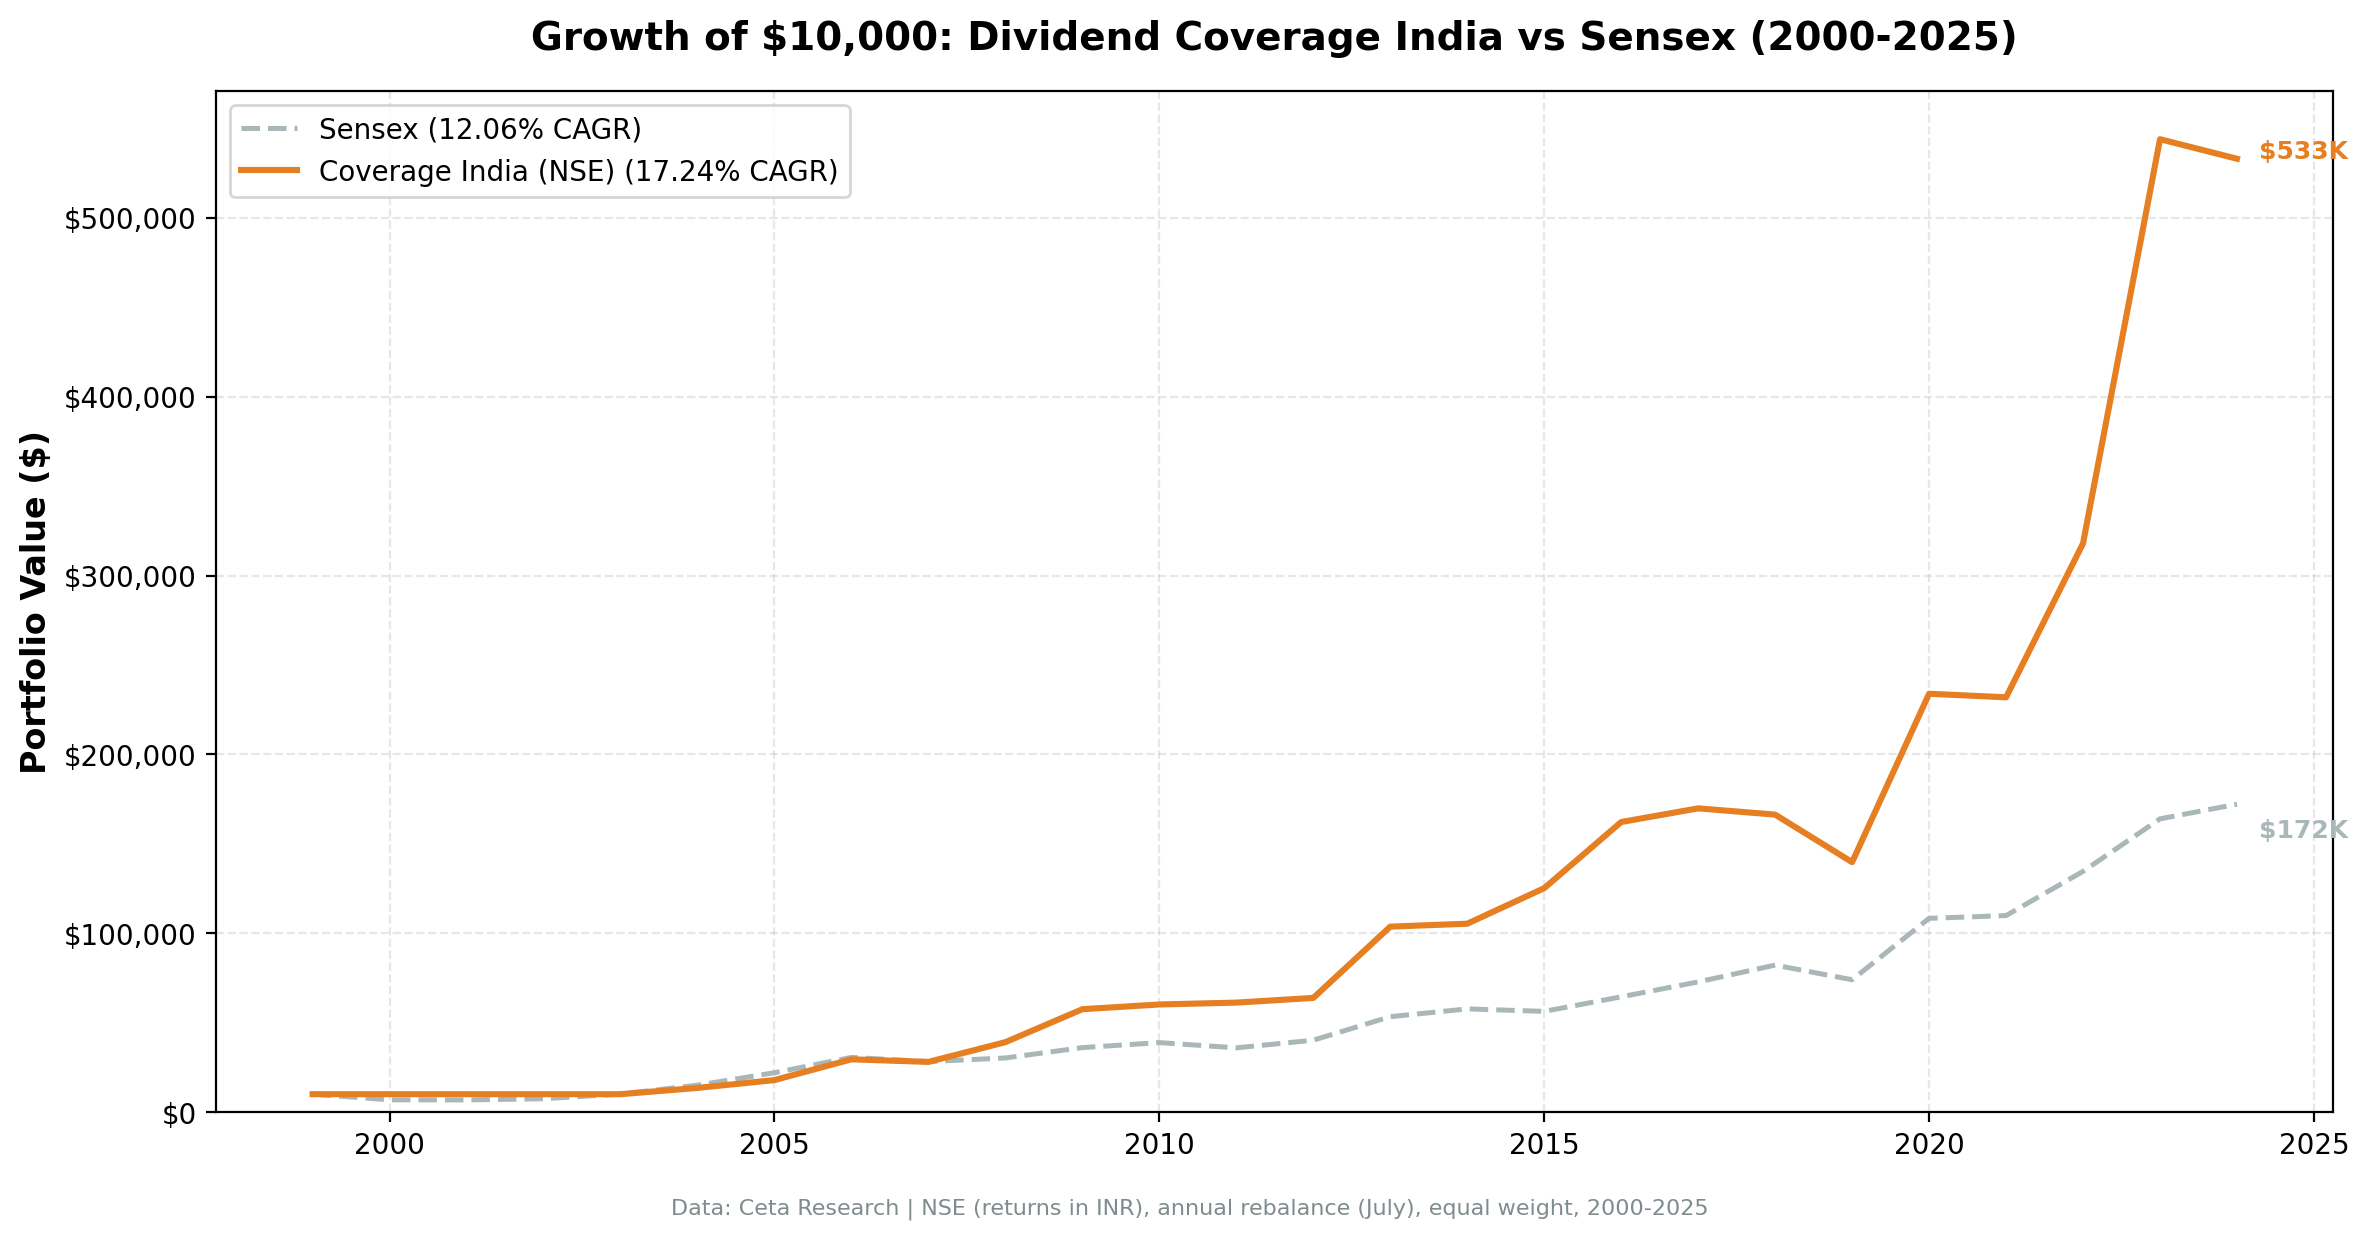
We screened NSE-listed Indian stocks for companies whose free cash flow comfortably covers their dividend payments. Coverage between 1.5x and 20x, yield above 2%, market cap above 20B INR, annual rebalance. The result: 17.24% CAGR over 25 years vs 12.06% for the Sensex. A 5,231% total return. The strategy turned $10,000 into roughly $533,000 in INR terms. Four of the 25 periods were in cash, all concentrated in the early 2000s when too few Indian large-caps passed the screen. Once the portfolio was invested, the returns were substantial.
Contents
- Method
- The Screen (SQL)
- What We Found
- 25 years of data. +5.18% annual alpha over the Sensex.
- Year-by-Year Returns
- Key Observations
- 2000-2003: Four years of cash
- 2004-2006: Strong returns, mixed performance vs local index
- 2008: +39.4% during a global crisis
- 2013: +62.5% on quality re-rating
- 2020: +67.4%, COVID recovery
- 2023: +71.1%, the biggest single year
- Where the strategy struggles
- Benchmark Context
- Limitations
- Takeaway
- Part of a Series
- References
- Run This Screen Yourself
Data: FMP financial data warehouse, 2000–2025. Updated March 2026.
Method
Signal: FCF / ABS(Common Dividends Paid) between 1.5x and 20x Filters: Dividend Yield > 2%, Market Cap > 20B INR (~$240M USD) Portfolio: Top 30 by coverage descending, equal weight Rebalancing: Annual (July) Period: 2000-2025 (25 years, 25 annual periods) Benchmark: Sensex (^BSESN, price return, INR) Cash rule: Hold cash if fewer than 10 stocks qualify Transaction costs: Size-tiered model (0.1-0.5% one-way based on market cap)
For the full methodology, dividend coverage rationale, and GE case study, see the main US Dividend Coverage post.
The Screen (SQL)
WITH latest_cf AS (
    SELECT c.symbol, c.freeCashFlow, c.commonDividendsPaid, c.date,
        ROW_NUMBER() OVER (PARTITION BY c.symbol ORDER BY c.date DESC) AS rn
    FROM cash_flow_statement c
    JOIN profile p ON c.symbol = p.symbol
    WHERE c.period = 'FY'
      AND c.commonDividendsPaid < 0
      AND c.freeCashFlow > 0
      AND p.exchange IN ('NSE')
),
latest_ratios AS (
    SELECT symbol, dividendYield, date,
        ROW_NUMBER() OVER (PARTITION BY symbol ORDER BY date DESC) AS rn
    FROM financial_ratios
    WHERE period = 'FY' AND dividendYield IS NOT NULL
),
latest_metrics AS (
    SELECT symbol, marketCap, date,
        ROW_NUMBER() OVER (PARTITION BY symbol ORDER BY date DESC) AS rn
    FROM key_metrics
    WHERE period = 'FY' AND marketCap IS NOT NULL
)
SELECT
    cf.symbol,
    ROUND(cf.freeCashFlow / NULLIF(ABS(cf.commonDividendsPaid), 0), 2) AS coverage,
    ROUND(r.dividendYield * 100, 2) AS yield_pct,
    ROUND(cf.freeCashFlow / 1e9, 2) AS fcf_bn,
    ROUND(km.marketCap / 1e9, 1) AS mktcap_bn
FROM latest_cf cf
JOIN latest_ratios r ON cf.symbol = r.symbol AND r.rn = 1
JOIN latest_metrics km ON cf.symbol = km.symbol AND km.rn = 1
WHERE cf.rn = 1
  AND cf.freeCashFlow / NULLIF(ABS(cf.commonDividendsPaid), 0) BETWEEN 1.5 AND 20
  AND r.dividendYield > 0.02
  AND km.marketCap > 20e9
ORDER BY coverage DESC
LIMIT 30
Run this query on Ceta Research
What We Found
25 years of data. +5.18% annual alpha over the Sensex.
| Metric | Coverage (NSE) | Sensex (INR) |
|---|---|---|
| CAGR | 17.24% | 12.06% |
| Total Return | 5,231% | 1,622% |
| Volatility | 26.52% | 19.80% |
| Max Drawdown | -17.72% | -32.20% |
| Sharpe Ratio | 0.405 | 0.281 |
| Excess CAGR vs Sensex | +5.18% | - |
| Win Rate (annual) | 52% | - |
| Avg Stocks per Period | 20.3 | - |
| Cash Periods | 4 of 25 | - |
$10,000 invested in 2000 grew to roughly $533,000 in INR terms. The same amount in the Sensex grew to $172,000. The max drawdown of -17.72% was significantly shallower than the benchmark's -32.20%. That's notable for an emerging market strategy with 27% annualized volatility.
The Sharpe ratio (0.405 vs 0.281) confirms better risk-adjusted returns. The strategy averaged 20.3 stocks per period with only four cash years, all at the start of the backtest window when India's dividend-paying universe was thin.
Year-by-Year Returns
| Year | Coverage (INR) | Sensex (INR) | Excess |
|---|---|---|---|
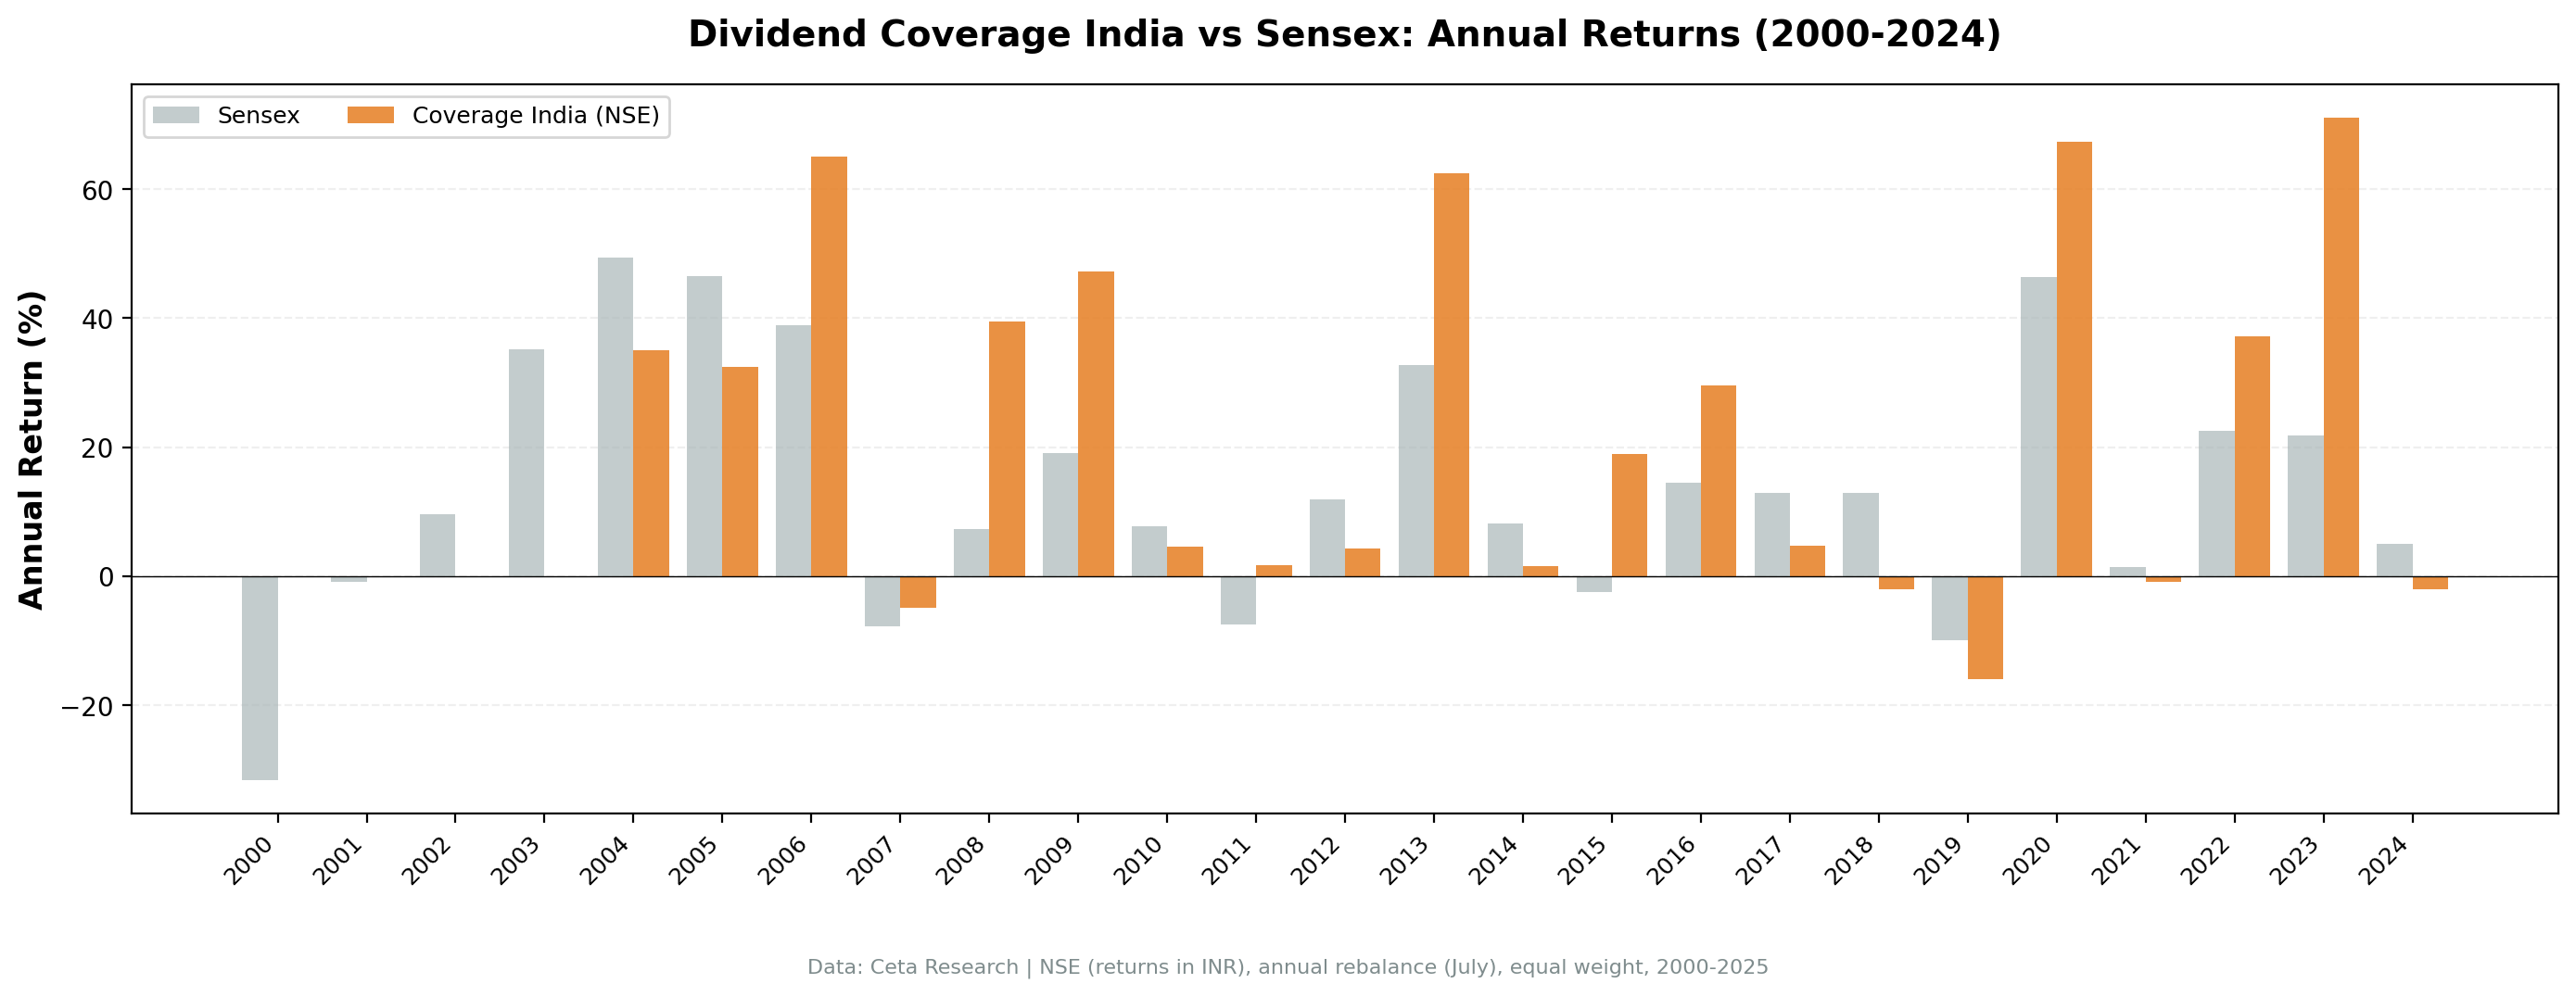
| 2000 | 0.0% (cash) | -31.6% | - |
| 2001 | 0.0% (cash) | -0.8% | - |
| 2002 | 0.0% (cash) | +9.6% | - |
| 2003 | 0.0% (cash) | +35.2% | - |
| 2004 | +35.0% | +49.4% | -14.4% |
| 2005 | +32.4% | +46.5% | -14.1% |
| 2006 | +65.1% | +38.9% | +26.2% |
| 2007 | -5.0% | -7.7% | +2.8% |
| 2008 | +39.4% | +7.3% | +32.1% |
| 2009 | +47.2% | +19.1% | +28.0% |
| 2010 | +4.6% | +7.8% | -3.2% |
| 2011 | +1.7% | -7.5% | +9.2% |
| 2012 | +4.3% | +11.9% | -7.6% |
| 2013 | +62.5% | +32.8% | +29.7% |
| 2014 | +1.6% | +8.1% | -6.6% |
| 2015 | +18.9% | -2.4% | +21.3% |
| 2016 | +29.5% | +14.4% | +15.1% |
| 2017 | +4.7% | +12.9% | -8.2% |
| 2018 | -2.1% | +12.9% | -15.0% |
| 2019 | -16.0% | -10.0% | -6.0% |
| 2020 | +67.4% | +46.4% | +20.9% |
| 2021 | -0.8% | +1.4% | -2.3% |
| 2022 | +37.1% | +22.5% | +14.6% |
| 2023 | +71.1% | +21.8% | +49.2% |
| 2024 | -2.0% | +5.0% | -7.0% |
Key Observations
2000-2003: Four years of cash
The strategy sat idle for four years. In the early 2000s, India's large-cap dividend-paying universe was small. Few companies passed all three filters at the 20B INR threshold. This is honest accounting. The 17.24% CAGR is computed over the full 25 years, including the dead weight of four cash years. Active returns started in 2004.
2004-2006: Strong returns, mixed performance vs local index
The first three active years produced +35.0%, +32.4%, and +65.1%. India's corporate sector was maturing rapidly. Companies that had been reinvesting heavily through the late 1990s were now generating strong free cash flows and initiating dividend programs. The coverage screen caught them as they crossed the threshold.
However, the Sensex was in a historic bull run during 2004-2005, returning +49.4% and +46.5%. Coverage stocks lagged the broader index in those years by 14 percentage points. This is the dividend coverage trade-off: during explosive growth years, boring cash-generative dividend payers don't keep pace with the full market. 2006 reversed this (+65.1% vs Sensex +38.9%).
2008: +39.4% during a global crisis
This is the standout result. While global markets collapsed, the Indian coverage portfolio gained 39.4% vs the Sensex's 7.3%. That's +32.1% excess return in a single year during a financial crisis. Companies with strong FCF coverage held up because their dividends were funded by real cash, not leverage. Indian dividend payers with conservative balance sheets were re-rated as safe havens during the panic. This single year demonstrates what coverage is designed to find: companies that don't need to cut when things get ugly.
2013: +62.5% on quality re-rating
The portfolio surged ahead of a broader sentiment shift in Indian equities. High-coverage companies benefited from a falling interest rate environment where stable dividend payers attracted institutional flows. The screen's emphasis on cash-backed dividends aligned with what foreign institutional investors wanted: visible, sustainable cash returns. The +62.5% return delivered +29.7% excess over the Sensex's +32.8%.
2020: +67.4%, COVID recovery
One of the largest annual returns in the dataset. COVID crushed equity prices in March 2020, but the July rebalance loaded the portfolio with beaten-down dividend payers whose cash flows had recovered faster than their stock prices. By year-end, the portfolio had rallied 67.4% vs 46.4% for the Sensex. The +20.9% excess return shows how coverage stocks recovered harder than the broader Indian market.
2023: +71.1%, the biggest single year
The largest annual return in the dataset. Domestic consumption growth, manufacturing policy incentives (PLI schemes), and expanding market depth drove a standout year. The coverage portfolio delivered +71.1% vs +21.8% for the Sensex. The +49.2% excess was the highest single-year outperformance vs the local benchmark. Companies with high FCF coverage were disproportionately in sectors benefiting from India's capex cycle: industrials, materials, and consumer goods.
Where the strategy struggles
2004 (-14.4% excess), 2005 (-14.1%), 2018 (-15.0%), 2012 (-7.6%), and 2019 (-6.0%) were the worst relative years vs the Sensex. The pattern is consistent: when growth stocks or index heavyweights drive markets, boring dividend payers lag. The 2004-2005 underperformance occurred during India's mid-2000s bull run when the Sensex posted +49.4% and +46.5%. Coverage stocks did well in absolute terms (+35.0% and +32.4%), but lagged the explosive broader market.
Benchmark Context
Primary benchmark: We compare vs the Sensex (^BSESN), India's benchmark equity index. Both returns are in INR, so the +5.18% excess is a clean local-currency comparison.
Cross-market benchmark: For context, coverage stocks returned 17.24% CAGR vs 7.85% for the S&P 500 (USD), an approximate +9.39% excess in raw returns. However, this comparison mixes currencies. The INR/USD exchange rate moved from roughly 43 in 2000 to roughly 84 in 2024, about 2.7% annual drag.
Currency-adjusted estimates:
| Metric | Coverage (INR) | Coverage (est. USD) | S&P 500 (USD) |
|---|---|---|---|
| CAGR | 17.24% | ~14.5% | 7.85% |
| Excess vs SPY | +9.39% | ~6.6% | - |
For Indian investors earning and spending in Rupees, the currency adjustment doesn't apply. The 17.24% CAGR and +5.18% alpha vs Sensex are the relevant numbers. For US-based investors, the USD-adjusted ~14.5% CAGR represents the approximate experience without hedging.
Limitations
Cash drag. 4 of 25 periods were in cash (all 2000-2003). The strategy produced zero returns for four years. Investors with shorter time horizons would have abandoned it.
NSE-only universe. BSE was excluded due to 38% dual-listing duplication with NSE. The backtest uses NSE listings only. Some dividend payers available on BSE but not NSE aren't captured.
Survivorship bias. Exchange membership uses current company profiles, not historical. Indian exchanges had different compositions in the early 2000s. Delisted companies aren't fully captured.
Market cap filter in INR. The 20B INR threshold (~$240M USD at 2025 rates) targets liquid mid-to-large-cap companies appropriate for India's market structure. In USD terms, this is lower than the $1B threshold used for US exchanges, reflecting different market size distributions.
Liquidity concerns. Some NSE-listed stocks that pass the screen may have thin trading volumes. The backtest assumes frictionless execution at closing prices. Real-world slippage on mid-cap Indian stocks can be material.
Transaction costs modeled, taxes not. India's Securities Transaction Tax (STT), stamp duty, and short-term capital gains tax aren't modeled. These reduce realized returns.
Annual rebalancing is slow. A company's coverage can deteriorate between July rebalances. Monthly or quarterly rebalancing would catch problems faster but increase turnover and costs.
Takeaway
The dividend coverage screen on NSE-listed Indian stocks produced a 17.24% CAGR with a -17.72% max drawdown. That drawdown is shallower than the Sensex's -32.20%, which is notable given the 5.18% annual alpha. The screen's emphasis on cash-backed dividends creates a natural quality filter that proved effective in India.
The 2008 result (+39.4% while the Sensex gained only 7.3%) captures the thesis perfectly. Companies generating real free cash flow with conservative dividend policies held value when leveraged peers collapsed. The screen doesn't predict crises, but it selects companies that survive them. 2023 showed the same pattern (+71.1% vs Sensex +21.8%, a +49.2% gap).
Compared to the US version of this strategy (11.56% CAGR, 0.427 Sharpe), the Indian version delivered higher raw returns (17.24% CAGR) but similar risk-adjusted performance (0.405 Sharpe). India's growing corporate sector produced a pool of high-coverage dividend payers. The screen captured them during a period of rapid economic expansion. The 52% win rate vs Sensex shows the strategy beat the local market roughly half the time, with outperformance concentrated in crisis and recovery years.
Part of a Series
This analysis is part of our dividend coverage global exchange comparison. We tested the same screen on 12 exchanges worldwide: - Dividend Coverage on US Stocks (NYSE + NASDAQ + AMEX) - 11.56% CAGR, the baseline - Dividend Coverage on German Stocks (XETRA) - 12.83% CAGR, best European result - Dividend Coverage on UK Stocks (LSE) - 9.38% CAGR, highest win rate - Dividend Coverage on Swedish Stocks (STO) - 10.74% CAGR, strong Sharpe - Dividend Coverage: 12-Exchange Global Comparison - full comparison table
References
- Benartzi, S., Michaely, R. & Thaler, R. (1997). "Do Changes in Dividends Signal the Future or the Past?" Journal of Finance, 52(3), 1007-1034.
- DeAngelo, H., DeAngelo, L. & Skinner, D. (1996). "Reversal of Fortune: Dividend Signaling and the Disappearance of Sustained Earnings Growth." Journal of Financial Economics, 40(3), 341-371.
Run This Screen Yourself
Via web UI: Run the coverage screen on Ceta Research. The query is pre-loaded with NSE filters. Hit "Run" and see what passes today.
Via Python:
import requests, time

API_KEY = "your_api_key"  # get one at cetaresearch.com
BASE = "https://tradingstudio.finance/api/v1"

resp = requests.post(f"{BASE}/data-explorer/execute", headers={
    "X-API-Key": API_KEY, "Content-Type": "application/json"
}, json={
    "query": """
        WITH latest_cf AS (
            SELECT c.symbol, c.freeCashFlow, c.commonDividendsPaid, c.date,
                ROW_NUMBER() OVER (PARTITION BY c.symbol ORDER BY c.date DESC) AS rn
            FROM cash_flow_statement c
            JOIN profile p ON c.symbol = p.symbol
            WHERE c.period = 'FY'
              AND c.commonDividendsPaid < 0
              AND c.freeCashFlow > 0
              AND p.exchange IN ('NSE')
        ),
        latest_ratios AS (
            SELECT symbol, dividendYield,
                ROW_NUMBER() OVER (PARTITION BY symbol ORDER BY date DESC) AS rn
            FROM financial_ratios WHERE period = 'FY' AND dividendYield IS NOT NULL
        ),
        latest_metrics AS (
            SELECT symbol, marketCap,
                ROW_NUMBER() OVER (PARTITION BY symbol ORDER BY date DESC) AS rn
            FROM key_metrics WHERE period = 'FY' AND marketCap IS NOT NULL
        )
        SELECT cf.symbol,
            ROUND(cf.freeCashFlow / NULLIF(ABS(cf.commonDividendsPaid), 0), 2) AS coverage,
            ROUND(r.dividendYield * 100, 2) AS yield_pct,
            ROUND(km.marketCap / 1e9, 1) AS mktcap_bn
        FROM latest_cf cf
        JOIN latest_ratios r ON cf.symbol = r.symbol AND r.rn = 1
        JOIN latest_metrics km ON cf.symbol = km.symbol AND km.rn = 1
        WHERE cf.rn = 1
          AND cf.freeCashFlow / NULLIF(ABS(cf.commonDividendsPaid), 0) BETWEEN 1.5 AND 20
          AND r.dividendYield > 0.02 AND km.marketCap > 20e9
        ORDER BY coverage DESC LIMIT 30
    """,
    "options": {"format": "json", "limit": 100}
})
task_id = resp.json()["taskId"]

while True:
    result = requests.get(f"{BASE}/tasks/data-query/{task_id}",
                          headers={"X-API-Key": API_KEY}).json()
    if result["status"] in ("completed", "failed"):
        break
    time.sleep(2)

for r in result["result"]["rows"][:10]:
    print(f"{r['symbol']:8s} coverage={r['coverage']:.1f}x yield={r['yield_pct']:.1f}%")
Get your API key at cetaresearch.com. The full backtest code (Python + DuckDB) is on GitHub.
Data: Ceta Research, FMP financial data warehouse. Universe: NSE. Annual rebalance (July), equal weight top 30, 2000-2025. Primary benchmark: Sensex (INR). Returns in INR.
Past performance does not guarantee future results. This is educational content, not investment advice.


