
Dividend Coverage on German Stocks: 12.83% CAGR, 7.79% Annual Alpha vs DAX
Dividend coverage on XETRA: 12.83% CAGR over 25 years, 7.79% annual alpha vs the DAX. Best Sharpe ratio (0.519) of any exchange tested. Zero cash periods across 25 rebalances.

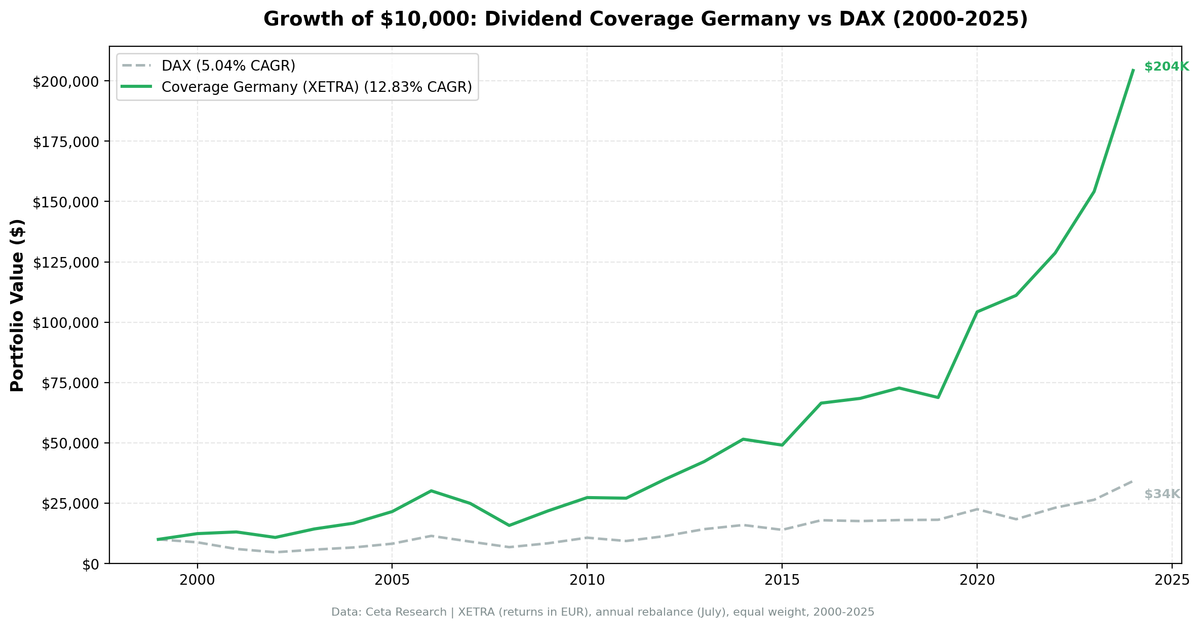
We ran the same FCF-based dividend coverage screen on XETRA-listed German equities. 12.83% CAGR over 25 years. 7.79% annual alpha over the DAX. The portfolio was fully invested every single period, averaging 21.1 stocks with zero cash years. Total return: 1,943%. The best Sharpe ratio (0.519) of any exchange we tested for this strategy.
Contents
- Method
- The Screen (SQL)
- What We Found
- 25 years of data. 7.79% annual alpha over the DAX.
- Year-by-Year Returns
- Key Observations
- The Dot-Com Era: Dividend Payers Held Up
- 2003: Post-Crash Recovery
- 2020: The Standout Year
- 2024: Strong Close to the Period
- Mittelstand Companies Fit the Coverage Profile
- Zero Cash Periods
- Currency Note
- Limitations
- Takeaway
- Part of a Series
- References
- Run This Screen Yourself
Germany's Mittelstand-heavy market is a natural fit for dividend coverage screening. Conservative, cash-generative industrials with steady payouts. The screen found them consistently across 25 annual rebalances.
Data: FMP financial data warehouse, 2000–2025. Updated March 2026.
Method
This post uses the same dividend coverage screen described in the US backtest. The only difference is the universe: XETRA-listed German equities instead of US exchanges.
Data source: Ceta Research (FMP financial data warehouse) Universe: XETRA (Germany), market cap > EUR 500M Period: 2000-2025 (25 years, 25 annual periods) Rebalancing: Annual (July), equal weight top 30 by coverage descending Benchmark: DAX (^GDAXI, price return) Cash rule: Hold cash if fewer than 10 stocks qualify Transaction costs: Size-tiered model (0.1-0.5% one-way based on market cap)
(Note: benchmark is price return index, excluding dividends.)
Financial data uses a 45-day lag to prevent look-ahead bias. July rebalance ensures fiscal year filings are available.
Signal: FCF / ABS(Common Dividends Paid) between 1.5x and 20x Filters: Dividend Yield > 2%, Market Cap > EUR 500M
The Screen (SQL)
WITH latest_cf AS (
    SELECT c.symbol, c.freeCashFlow, c.commonDividendsPaid, c.date,
        ROW_NUMBER() OVER (PARTITION BY c.symbol ORDER BY c.date DESC) AS rn
    FROM cash_flow_statement c
    JOIN profile p ON c.symbol = p.symbol
    WHERE c.period = 'FY'
      AND c.commonDividendsPaid < 0
      AND c.freeCashFlow > 0
      AND p.exchange = 'XETRA'
),
latest_ratios AS (
    SELECT symbol, dividendYield, date,
        ROW_NUMBER() OVER (PARTITION BY symbol ORDER BY date DESC) AS rn
    FROM financial_ratios
    WHERE period = 'FY' AND dividendYield IS NOT NULL
),
latest_metrics AS (
    SELECT symbol, marketCap, date,
        ROW_NUMBER() OVER (PARTITION BY symbol ORDER BY date DESC) AS rn
    FROM key_metrics
    WHERE period = 'FY' AND marketCap IS NOT NULL
)
SELECT
    cf.symbol,
    ROUND(cf.freeCashFlow / NULLIF(ABS(cf.commonDividendsPaid), 0), 2) AS coverage,
    ROUND(r.dividendYield * 100, 2) AS yield_pct,
    ROUND(cf.freeCashFlow / 1e9, 2) AS fcf_bn,
    ROUND(km.marketCap / 1e9, 1) AS mktcap_bn
FROM latest_cf cf
JOIN latest_ratios r ON cf.symbol = r.symbol AND r.rn = 1
JOIN latest_metrics km ON cf.symbol = km.symbol AND km.rn = 1
WHERE cf.rn = 1
  AND cf.freeCashFlow / NULLIF(ABS(cf.commonDividendsPaid), 0) BETWEEN 1.5 AND 20
  AND r.dividendYield > 0.02
  AND km.marketCap > 500e6
ORDER BY coverage DESC
LIMIT 30
Run this query on Ceta Research
What We Found
25 years of data. 7.79% annual alpha over the DAX.
| Metric | Coverage (XETRA) | DAX |
|---|---|---|
| CAGR | 12.83% | 5.04% |
| Total Return | 1,943% | 242% |
| Volatility | 20.85% | 21.11% |
| Max Drawdown | -47.63% | -53.43% |
| Sharpe Ratio | 0.519 | 0.144 |
| Win Rate (annual) | 80% | - |
| Avg Stocks per Period | 21.1 | - |
| Cash Periods | 0 of 25 | - |
$10,000 invested in 2000 grew to roughly $204,000. The portfolio was fully invested every single year. Zero cash periods across 25 rebalances. The XETRA universe of dividend-paying companies with strong FCF coverage is deep enough to always fill the screen.
The Sharpe ratio of 0.519 is the highest we recorded across all exchanges for this strategy. Higher than the US (0.427), UK (0.336), and every other market we tested. The extra return per unit of risk comes from Germany's concentration of cash-generative industrial companies that fit the coverage profile naturally.
Year-by-Year Returns
| Year | Coverage | DAX | Excess |
|---|---|---|---|
| 2000 | +23.8% | -12.2% | +36.0% |
| 2001 | +5.7% | -31.3% | +37.0% |
| 2002 | -17.4% | -22.8% | +5.3% |
| 2003 | +32.6% | +23.4% | +9.2% |
| 2004 | +16.6% | +15.6% | +1.0% |
| 2005 | +29.0% | +23.6% | +5.4% |
| 2006 | +39.9% | +39.3% | +0.6% |
| 2007 | -17.3% | -20.8% | +3.5% |
| 2008 | -36.7% | -25.2% | -11.5% |
| 2009 | +38.5% | +23.6% | +14.8% |
| 2010 | +25.1% | +27.6% | -2.5% |
| 2011 | -0.9% | -12.7% | +11.8% |
| 2012 | +29.1% | +21.8% | +7.3% |
| 2013 | +20.9% | +25.3% | -4.4% |
| 2014 | +21.9% | +12.0% | +9.9% |
| 2015 | -4.8% | -12.5% | +7.8% |
| 2016 | +35.5% | +28.5% | +7.0% |
| 2017 | +2.9% | -1.9% | +4.8% |
| 2018 | +6.3% | +2.4% | +3.9% |
| 2019 | -5.4% | +0.7% | -6.1% |
| 2020 | +51.6% | +24.1% | +27.5% |
| 2021 | +6.5% | -18.4% | +24.9% |
| 2022 | +15.8% | +25.9% | -10.1% |
| 2023 | +19.8% | +14.3% | +5.5% |
| 2024 | +32.5% | +29.5% | +3.1% |
Key Observations
The Dot-Com Era: Dividend Payers Held Up
| Year | Coverage | DAX | Excess |
|---|---|---|---|
| 2000 | +23.8% | -12.2% | +36.0% |
| 2001 | +5.7% | -31.3% | +37.0% |
While the DAX lost over 40% across 2000-2001, German dividend coverage stocks gained 23.8% in 2000 and another 5.7% in 2001. Cash-backed dividends on XETRA were the opposite of dot-com speculation. The screen naturally avoided overvalued tech names and concentrated on companies generating real cash flow.
2003: Post-Crash Recovery
+32.6% vs +23.4% for the DAX. After the 2002 drawdown (-17.4%), the strategy snapped back hard. Beaten-down German industrials with maintained dividends and strong coverage were priced for distress. When confidence returned, these stocks rallied faster than the broad market.
2020: The Standout Year
+51.6% vs +24.1% for the DAX. The biggest absolute return in the series. German dividend payers with high FCF coverage got hammered during the COVID selloff in early 2020. By the July rebalance, the screen loaded up on these deeply discounted names. The recovery through late 2020 was ferocious. More than 27 points of alpha in a single year.
2024: Strong Close to the Period
+32.5% vs +29.5% for the DAX. German industrials and exporters benefited from a weak EUR and strong global demand. Companies with high dividend coverage were well-positioned: generating cash, paying shareholders, and trading at reasonable valuations relative to their cash flow generation.
Mittelstand Companies Fit the Coverage Profile
Germany's publicly traded Mittelstand companies, the mid-to-large industrial exporters, are a natural fit for dividend coverage screening. They tend to be conservatively managed, carry moderate leverage, generate consistent free cash flow, and maintain steady dividend programs. The 1.5x to 20x coverage window captures these companies precisely. Unlike the US, where tech mega-caps dominate the index, XETRA's universe of dividend payers is tilted toward industrials and consumer goods. This structural tilt works in the strategy's favor.
Zero Cash Periods
Unlike many of our regional tests, the XETRA dividend coverage screen never went to cash. All 25 periods had at least 10 qualifying stocks, averaging 22.6. The screen's filters (coverage 1.5-20x, yield > 2%, market cap > EUR 500M) are well-calibrated for the German market. There are always enough dividend-paying industrials meeting the criteria.
Currency Note
XETRA returns are in EUR. The benchmark (DAX) is also EUR-denominated, so the comparison is clean from a currency perspective. Note that the DAX is a price return index: it excludes dividends. The strategy's total return includes dividends reinvested, so part of the 7.79% annual alpha reflects this apples-to-oranges comparison. For reference, the strategy also outperformed the S&P 500 Total Return (SPY) by approximately 4.98% annually over the same period.
Limitations
Deep drawdown. -47.63% at the worst point, during the 2008 crisis. The concentrated portfolio amplifies swings. The extra return comes with extra volatility (20.85%).
Annual rebalancing is slow. A company's coverage can deteriorate between July rebalances. Monthly or quarterly rebalancing would catch problems faster but increase turnover and costs.
Coverage is backward-looking. The ratio uses last fiscal year's cash flow statement. A company with 5x coverage today could see its business deteriorate tomorrow.
Sector concentration. The screen doesn't balance sectors. German dividend payers skew toward industrials, chemicals, and automotive. When export-sensitive sectors sell off (2019: -5.4%), the portfolio has no diversification buffer.
Survivorship bias. Exchange membership uses current company profiles. Companies that delisted, went bankrupt, or were acquired aren't fully captured.
Data coverage. FMP's XETRA financial statement coverage is thinner than US data, especially in the early 2000s. This may affect the precision of early-period results.
Takeaway
The dividend coverage screen works well on German stocks. 12.83% CAGR over 25 years, 7.79% annual alpha over the DAX (price return), and the best Sharpe ratio (0.519) of any exchange we tested. Zero cash periods. The strategy was always invested, always finding enough German companies with cash-backed dividends.
The edge comes from XETRA's structural composition. Germany's market is heavy on industrial exporters with conservative financial management and steady cash generation. These companies naturally produce high dividend coverage ratios. The screen captures this structural advantage without forcing it.
The cost: higher volatility than the benchmark and a deep crisis drawdown. 2008 was painful (-36.7%). 2019 underperformed by 6 points. Factor strategies are cyclical, and the coverage factor is no exception. But across 25 years, the math is clear. Cash-backed dividends on German stocks delivered meaningful alpha with the best risk-adjusted returns in our global comparison. For context: vs the S&P 500 Total Return (SPY), the strategy delivered +4.98% annual alpha.
Part of a Series
This analysis is part of our dividend coverage global exchange comparison. We tested the same screen on multiple exchanges worldwide: - Dividend Coverage on US Stocks (NYSE + NASDAQ + AMEX) - 11.56% CAGR, the baseline - Dividend Coverage on UK Stocks (LSE) - 9.38% CAGR, best win rate at 80% - Dividend Coverage: Global Comparison - full comparison table
References
- Benartzi, S., Michaely, R. & Thaler, R. (1997). "Do Changes in Dividends Signal the Future or the Past?" Journal of Finance, 52(3), 1007-1034.
- DeAngelo, H., DeAngelo, L. & Skinner, D. (1996). "Reversal of Fortune: Dividend Signaling and the Disappearance of Sustained Earnings Growth." Journal of Financial Economics, 40(3), 341-371.
Run This Screen Yourself
Via web UI: Run the coverage screen on Ceta Research. The query is pre-loaded with exchange = 'XETRA'. Hit "Run" and see what passes today.
Via Python:
import requests, time

API_KEY = "your_api_key"  # get one at cetaresearch.com
BASE = "https://tradingstudio.finance/api/v1"

resp = requests.post(f"{BASE}/data-explorer/execute", headers={
    "X-API-Key": API_KEY, "Content-Type": "application/json"
}, json={
    "query": """
        WITH latest_cf AS (
            SELECT c.symbol, c.freeCashFlow, c.commonDividendsPaid, c.date,
                ROW_NUMBER() OVER (PARTITION BY c.symbol ORDER BY c.date DESC) AS rn
            FROM cash_flow_statement c
            JOIN profile p ON c.symbol = p.symbol
            WHERE c.period = 'FY' AND c.commonDividendsPaid < 0
              AND c.freeCashFlow > 0 AND p.exchange = 'XETRA'
        ),
        latest_ratios AS (
            SELECT symbol, dividendYield,
                ROW_NUMBER() OVER (PARTITION BY symbol ORDER BY date DESC) AS rn
            FROM financial_ratios WHERE period = 'FY' AND dividendYield IS NOT NULL
        ),
        latest_metrics AS (
            SELECT symbol, marketCap,
                ROW_NUMBER() OVER (PARTITION BY symbol ORDER BY date DESC) AS rn
            FROM key_metrics WHERE period = 'FY' AND marketCap IS NOT NULL
        )
        SELECT cf.symbol,
            ROUND(cf.freeCashFlow / NULLIF(ABS(cf.commonDividendsPaid), 0), 2) AS coverage,
            ROUND(r.dividendYield * 100, 2) AS yield_pct,
            ROUND(km.marketCap / 1e9, 1) AS mktcap_bn
        FROM latest_cf cf
        JOIN latest_ratios r ON cf.symbol = r.symbol AND r.rn = 1
        JOIN latest_metrics km ON cf.symbol = km.symbol AND km.rn = 1
        WHERE cf.rn = 1
          AND cf.freeCashFlow / NULLIF(ABS(cf.commonDividendsPaid), 0) BETWEEN 1.5 AND 20
          AND r.dividendYield > 0.02 AND km.marketCap > 500e6
        ORDER BY coverage DESC LIMIT 30
    """,
    "options": {"format": "json", "limit": 100}
})
task_id = resp.json()["taskId"]

while True:
    result = requests.get(f"{BASE}/tasks/data-query/{task_id}",
                          headers={"X-API-Key": API_KEY}).json()
    if result["status"] in ("completed", "failed"):
        break
    time.sleep(2)

for r in result["result"]["rows"][:10]:
    print(f"{r['symbol']:8s} coverage={r['coverage']:.1f}x yield={r['yield_pct']:.1f}%")
Get your API key at cetaresearch.com. The full backtest code (Python + DuckDB) is on GitHub.
Data: Ceta Research, FMP financial data warehouse. Universe: XETRA (Germany). Annual rebalance (July), equal weight top 30, 2000-2025.
Past performance does not guarantee future results. This is educational content, not investment advice.


