
DCF Discount on German Stocks: 12.40% CAGR Over 25 Years of XETRA Data
We screened every German stock on XETRA for discount to intrinsic value using a Gordon Growth Model and backtested from 2000 to 2025. The strategy returned 12.40% CAGR vs 4.51% for the DAX (price index), +7.89% local excess (~+5pp after dividend adjustment).

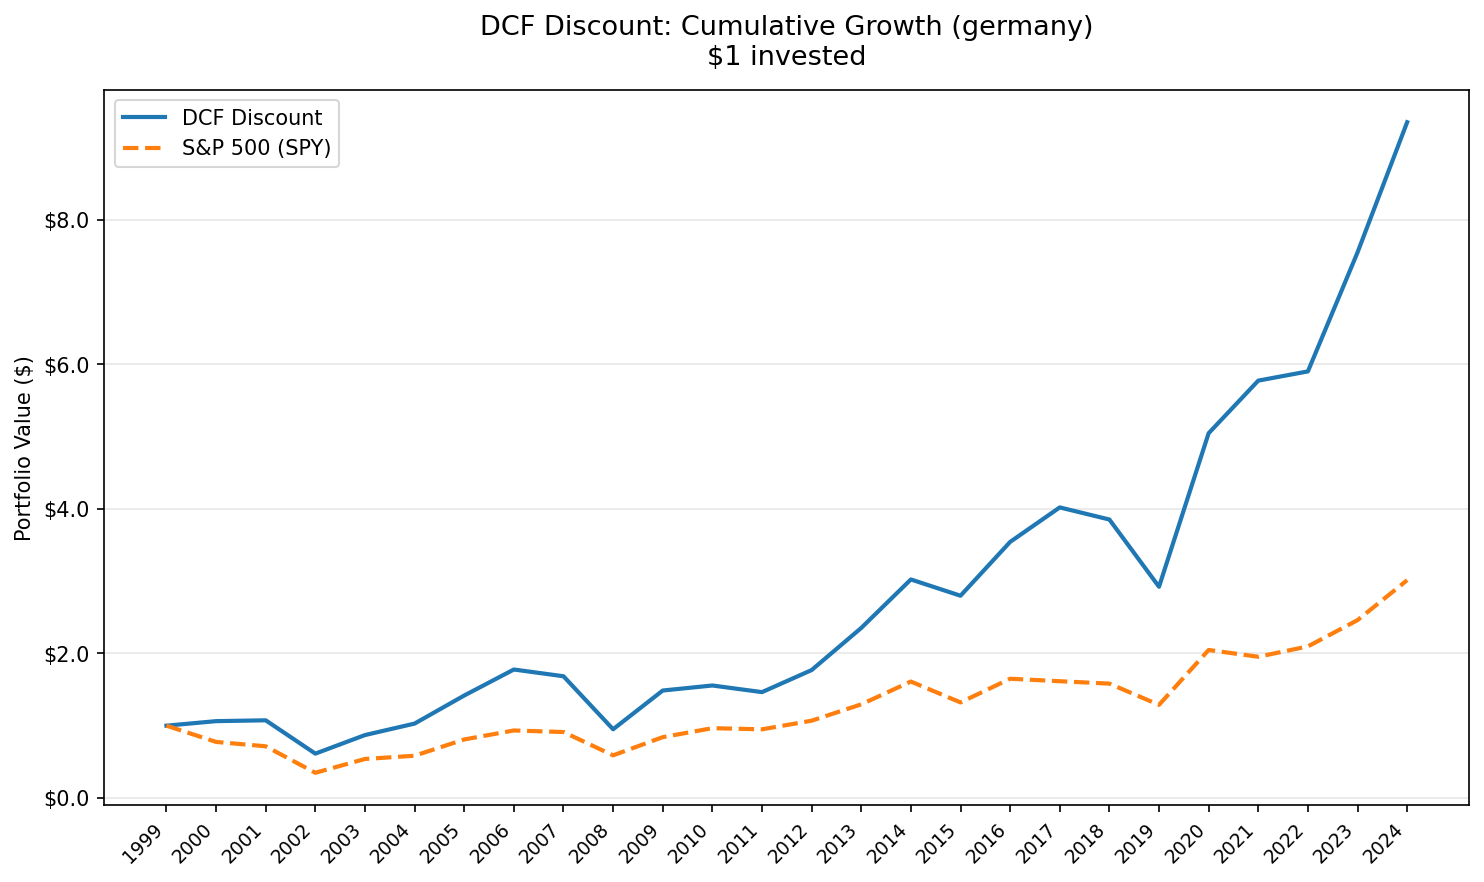
We screened every German stock on XETRA for discount to intrinsic value using a Gordon Growth Model and backtested from 2000 to 2025. The strategy returned 12.40% CAGR vs 4.51% for the DAX (price index), turning $10,000 into $185,796 vs $30,139. Germany's industrial value stocks delivered a +7.89% annual edge over the local index, with just one cash period across 25 years.
Contents
- Method
- The Screen
- What We Found
- Year-by-Year Returns
- Key Observations
- Currency and Benchmark Notes
- Limitations
- Takeaway
- Part of a Series
The DAX as published is a price index. The total-return DAX (DAX TR) would have returned roughly 6.5-7% over the same window once dividends are reinvested. Adjusted for that gap, the strategy's true alpha is closer to +5 to +5.5 percentage points per year. Even after that adjustment, this is the strongest XETRA result in our DCF series.
Data: FMP financial data warehouse, 2000–2025. Updated May 2026 (post bias fix).
Method
Full methodology is covered in the US flagship post. Short version:
Signal: FCF/MarketCap >= 8.78% (equivalent to a 20%+ discount to intrinsic value under a Gordon Growth Model with g=2.5%, r=10%, implied multiple=13.67x). Universe: XETRA (Deutsche Boerse). All listed stocks meeting the filters. Period: 2000-2025 (25 years, annual rebalancing in April). Portfolio: Top 50 by FCF yield, equal weight. Market cap floor: €500M (~$545M USD equivalent). Costs: Size-tiered transaction costs (0.1% for >$10B, 0.3% for $2-10B, 0.5% for <$2B). Point-in-time: 45-day filing lag, 18-month staleness filter. Benchmark: DAX (^GDAXI), price index. All returns in EUR. Execution: Next-day close (MOC). Signal generated at rebalance date, executed at the following trading day's close. Data: Ceta Research (FMP financial data warehouse).
The Screen
WITH latest_cfs AS (
    SELECT * FROM cash_flow_statement
    WHERE period = 'FY' AND freeCashFlow > 0 AND reportedCurrency = 'EUR'
    QUALIFY ROW_NUMBER() OVER (PARTITION BY symbol ORDER BY date DESC) = 1
),
latest_km AS (
    SELECT * FROM key_metrics
    WHERE period = 'FY' AND marketCap > 500000000
    QUALIFY ROW_NUMBER() OVER (PARTITION BY symbol ORDER BY date DESC) = 1
)
SELECT
    cfs.symbol,
    p.companyName,
    p.sector,
    ROUND(cfs.freeCashFlow / 1e6, 0) AS fcf_mm,
    ROUND(km.marketCap / 1e9, 2) AS mktcap_bn,
    ROUND(cfs.freeCashFlow / km.marketCap * 100, 2) AS fcf_yield_pct,
    ROUND((1 - km.marketCap / (cfs.freeCashFlow * 13.67)) * 100, 1) AS discount_pct
FROM latest_cfs cfs
JOIN latest_km km ON cfs.symbol = km.symbol
JOIN profile p ON cfs.symbol = p.symbol
WHERE p.exchange = 'XETRA'
    AND p.isFund = false
    AND p.isEtf = false
    AND p.isActivelyTrading = true
    AND cfs.freeCashFlow / km.marketCap BETWEEN 0.0878 AND 0.50
ORDER BY fcf_yield_pct DESC
LIMIT 30
Run this screen live on Ceta Research
What We Found
The strategy beat the DAX (price index) by 7.89% per year over 25 years. That's 1,757.96% cumulative vs 201.39%. The portfolio was invested in 24 of 25 periods, averaging 36.5 stocks per rebalance. The single cash period reflects one year where XETRA didn't have enough qualifying companies meeting the FCF yield and market cap thresholds.
The volatility is below the DAX: 24.44% vs 26.27%. Max drawdown hit -43.69% (vs -65.15% for the DAX). Beta of 0.812 against the DAX shows the portfolio moves with less amplitude than the index. Up capture of 118.14% grabs more upside, and down capture of 31.61% means it dodges roughly 68% of the DAX's losses. That asymmetry is what drives the result.

Full 25-year summary:
| Metric | DCF Discount (XETRA) | DAX |
|---|---|---|
| CAGR | 12.40% | 4.51% |
| Total Return | 1,757.96% | 201.39% |
| Max Drawdown | -43.69% | -65.15% |
| Annualized Volatility | 24.44% | 26.27% |
| Sharpe Ratio | 0.425 | 0.096 |
| Sortino Ratio | 0.979 | 0.164 |
| Calmar Ratio | 0.284 | 0.069 |
| Win Rate vs DAX | 64% | - |
| Beta | 0.812 | 1.0 |
| Alpha (Jensen) | 8.36% | - |
| Up Capture | 118.14% | - |
| Down Capture | 31.61% | - |
| VaR 95% | -23.86% | -35.35% |
| Avg Stocks | 36.5 | - |
| Cash Periods | 1/25 | - |
| Information Ratio | 0.557 | - |
| Tracking Error | 12.90% | - |
The Sharpe ratio is over 4x the DAX's (0.425 vs 0.096). The Sortino ratio strongly favors the portfolio: 0.979 vs 0.164. The raw edge is real in both absolute and risk-adjusted terms, even before adjusting for the DAX's missing dividends.
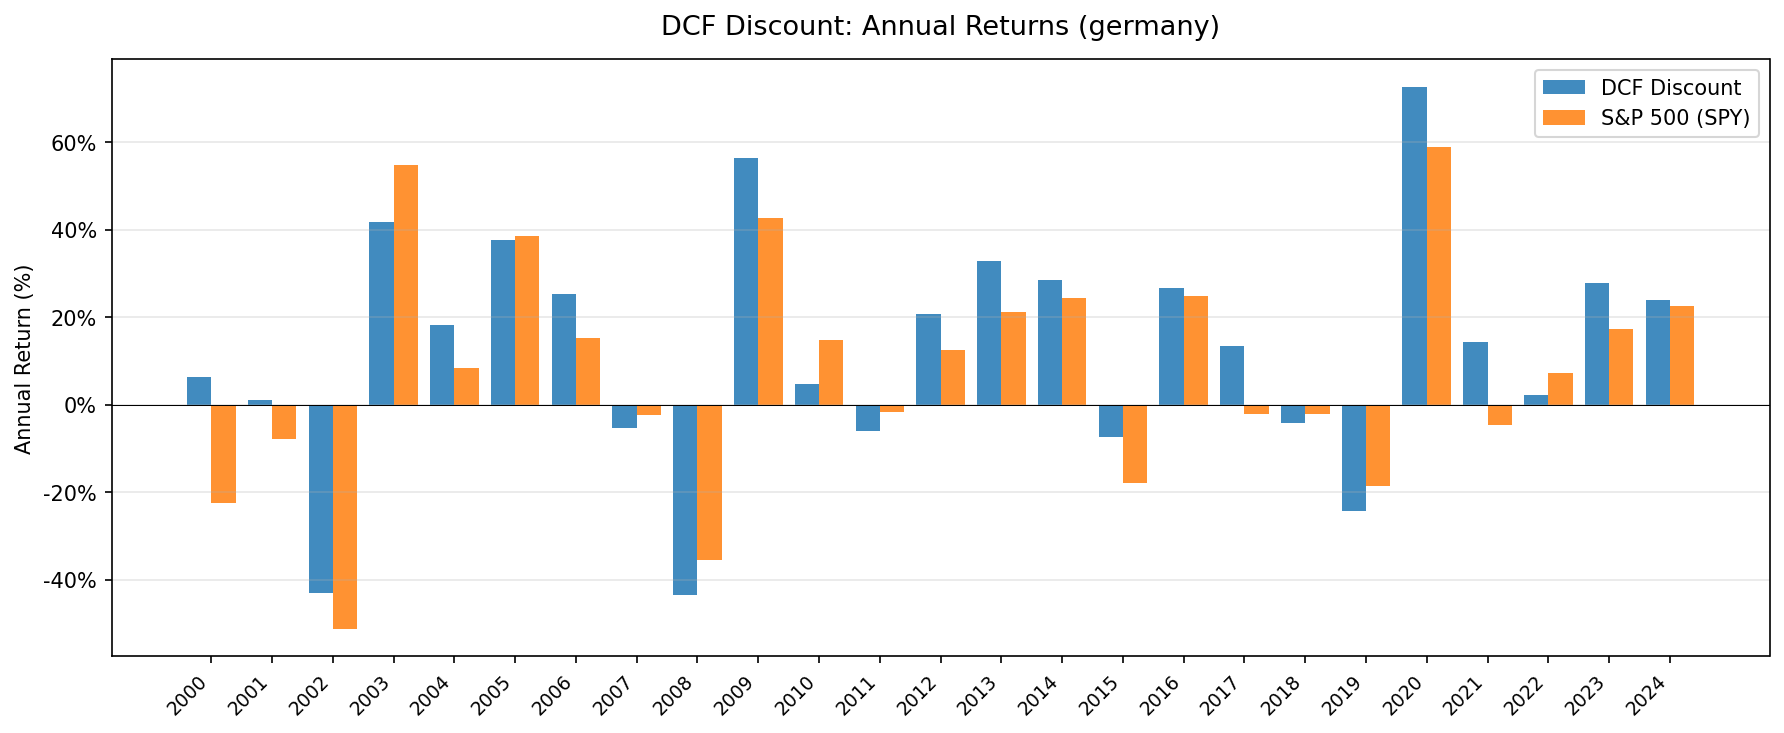
Year-by-Year Returns
| Year | Portfolio | DAX | Excess |
|---|---|---|---|
| 2000 | +5.8% | -22.5% | +28.2% |
| 2001 | +3.9% | -7.8% | +11.7% |
| 2002 | +0.0% (cash) | -51.3% | +51.3% |
| 2003 | +52.6% | +54.8% | -2.2% |
| 2004 | +25.2% | +8.3% | +16.8% |
| 2005 | +47.9% | +38.5% | +9.4% |
| 2006 | +23.3% | +15.4% | +8.0% |
| 2007 | -2.3% | -2.3% | 0.0% |
| 2008 | -42.3% | -35.4% | -7.0% |
| 2009 | +56.6% | +42.7% | +14.0% |
| 2010 | +17.2% | +14.8% | +2.4% |
| 2011 | -4.7% | -1.7% | -3.1% |
| 2012 | +17.2% | +12.6% | +4.6% |
| 2013 | +37.1% | +21.1% | +16.0% |
| 2014 | +14.6% | +24.4% | -9.7% |
| 2015 | -6.9% | -17.9% | +11.0% |
| 2016 | +29.7% | +24.8% | +4.9% |
| 2017 | +16.9% | -2.1% | +18.9% |
| 2018 | -4.4% | -2.1% | -2.3% |
| 2019 | -23.9% | -18.6% | -5.3% |
| 2020 | +61.8% | +59.0% | +2.8% |
| 2021 | +5.6% | -4.6% | +10.2% |
| 2022 | +5.3% | +7.3% | -2.1% |
| 2023 | +18.4% | +17.3% | +1.0% |
| 2024 | +22.4% | +22.5% | -0.1% |
Key Observations
The Mittelstand advantage. XETRA isn't just Siemens and SAP. It includes hundreds of Mittelstand companies, the mid-cap industrial specialists that dominate niche global markets. Companies like Duerr, Krones, and Jungheinrich. These firms often generate substantial free cash flow relative to their market cap because they're market leaders in unglamorous industries: packaging machinery, paint systems, forklifts. The DCF screen naturally gravitates toward them.
2002 cash year, dodged the worst. The DAX fell 51.3% in 2002 amid the Neuer Markt collapse. The screen produced too few qualifying names that year, parking the portfolio in cash. That single decision contributed +51.3 percentage points of excess in a single year. Real outperformance, but partly mechanical: the screen tightened up just before the worst of the crash.
2017 stood out. +18.9% excess as German industrials and exporters re-rated while the DAX itself was flat to negative. The portfolio's tilt away from index-heavy financials helped here.
2020: a strong recovery year. +61.8%. German industrial value stocks were priced for permanent decline during COVID lockdowns in March-April 2020. The April rebalance picked up deeply discounted manufacturers and exporters right at the bottom. The portfolio just edged the DAX's +59.0% by 2.8 points.
The 2018-2019 slump. Two years of mixed results. 2018 saw the portfolio lag by -2.3%, and 2019 by -5.3%. Germany's auto sector was dealing with diesel emissions fallout, trade war fears hit exporters, and the ECB's negative rate environment squeezed financials.
Down capture tells the real story. At 31.61%, this portfolio provides substantial downside protection vs the DAX. The portfolio dodges roughly 68% of the DAX's losses. Combined with 118.14% up capture, the asymmetry compounds powerfully over 25 years and is the main driver of the +7.89% headline excess.
Almost always invested. Just one cash period (2002) across 25 years. XETRA consistently produced enough qualifying companies meeting the market cap and FCF yield thresholds to keep the portfolio working.
Currency and Benchmark Notes
Returns and benchmark in EUR. Since both the strategy and the DAX are EUR-denominated, currency effects cancel out in the comparison. For a USD-based investor, the EUR/USD rate fluctuated between roughly 0.85 (late 2000) and 1.60 (mid-2008) and has settled around 1.08 in recent years.
DAX is a price index in this dataset. It does not include reinvested dividends. German dividend yield averaged roughly 2.5-3% per year over 2000-2024. A total-return DAX (commonly published as DAX TR or PR) would have returned roughly 6.5-7% CAGR over the period. Adjusted for this gap, the strategy's true alpha is closer to +5 to +5.5 percentage points per year.
The +7.89% headline excess flatters the gap, but the strategy still comfortably beats a hypothetical total-return DAX. The Sharpe and Sortino comparisons are unaffected since they don't depend on benchmark return level.
Limitations
Meaningful drawdowns. 24.44% annualized volatility with a -43.69% max drawdown. The 2008 crash alone wiped out 42.3% in a single year. That's a hard drawdown to sit through, even knowing it recovered.
Concentrated sector exposure. German high-FCF-yield stocks cluster in industrials, autos, and chemicals. The portfolio isn't a diversified Germany fund. When those sectors underperform (2018-2019 diesel/trade war period), the strategy drags hard.
Trailing FCF in cyclical industries. Germany's economy is export-driven and cyclical. A manufacturer reporting strong FCF in year T may see cash flows collapse in T+1 if global demand falls. The screen uses last year's numbers. For deeply cyclical companies, trailing FCF overstates normalized earning power during peaks.
Benchmark dividend gap. The DAX in our dataset is a price index. After adjusting for typical 2.5-3% German dividend yield, the strategy's true alpha is closer to +5 to +5.5 percentage points per year, not +7.89%. Still meaningful, just narrower.
One cash year. 2002 was a cash period: the screen didn't have enough qualifying stocks. That decision dodged the DAX's -51.3% loss and contributed materially to the 25-year excess. Stripping that single year out lowers the headline edge.
Smaller universe than the US. The US version selects from NYSE + NASDAQ + AMEX, thousands of stocks. XETRA has a smaller eligible pool, which is why the portfolio averages 36.5 stocks per rebalance. Less diversification means more idiosyncratic risk per holding.
Survivorship bias. The €500M market cap floor and XETRA's listing standards reduce the risk, but some delisted companies may have incomplete data in the earlier years of the backtest.
Takeaway
Buying German stocks at a 20%+ discount to intrinsic value delivered 12.40% CAGR over 25 years, beating the DAX (price index) by 7.89% annually. After adjusting for the index's missing dividends, the true edge is closer to +5 to +5.5 percentage points per year, which still compounds meaningfully over 25 years.
The strategy provides strong downside protection vs the DAX, with 31.6% down capture. The recoveries were strong: 2005 (+47.9%), 2009 (+56.6%), and 2020 (+61.8%) show what happens when deeply discounted industrial cash flow generators get re-priced. The portfolio's -43.69% max drawdown was 21 percentage points shallower than the DAX's -65.15%.
Germany's Mittelstand keeps this screen populated. Just one cash year across 25, and an average of 36.5 holdings per rebalance. For a DCF-based value screen, that reliability matters.
The practical takeaway: the DCF discount signal works in Europe's largest economy. With an information ratio of 0.557 and a Sortino ratio close to 1.0, it delivers systematic exposure to cheap German industrials with a long-term compounding edge that holds up after dividend adjustments.
Part of a Series
This analysis is part of our DCF Discount global exchange comparison:
- DCF Discount on US Stocks (NYSE + NASDAQ + AMEX)
- DCF Discount on Indian Stocks (NSE)
- DCF Discount on Taiwan Stocks (TAI + TWO)
- DCF Discount on Canadian Stocks (TSX)
- DCF Discount on Korean Stocks (KSC)
- DCF Discount on German Stocks (XETRA)
- DCF Discount on Swedish Stocks (STO)
- DCF Discount: Global Exchange Comparison
Data: Ceta Research, FMP financial data warehouse. Backtest: 2000-2025, 25 annual periods, Gordon Growth Model (g=2.5%, r=10%, multiple=13.67x). Universe: XETRA, market cap >€500M, positive FCF. Returns in EUR. Benchmark: DAX (^GDAXI, price index). Next-day close (MOC) execution. Size-tiered transaction costs applied. Full methodology: METHODOLOGY.md. Not investment advice.


