Cyclical Sector Timing in Sweden: +5.83% Alpha Over OMX30, 10.23% CAGR (STO, 2001-2024)
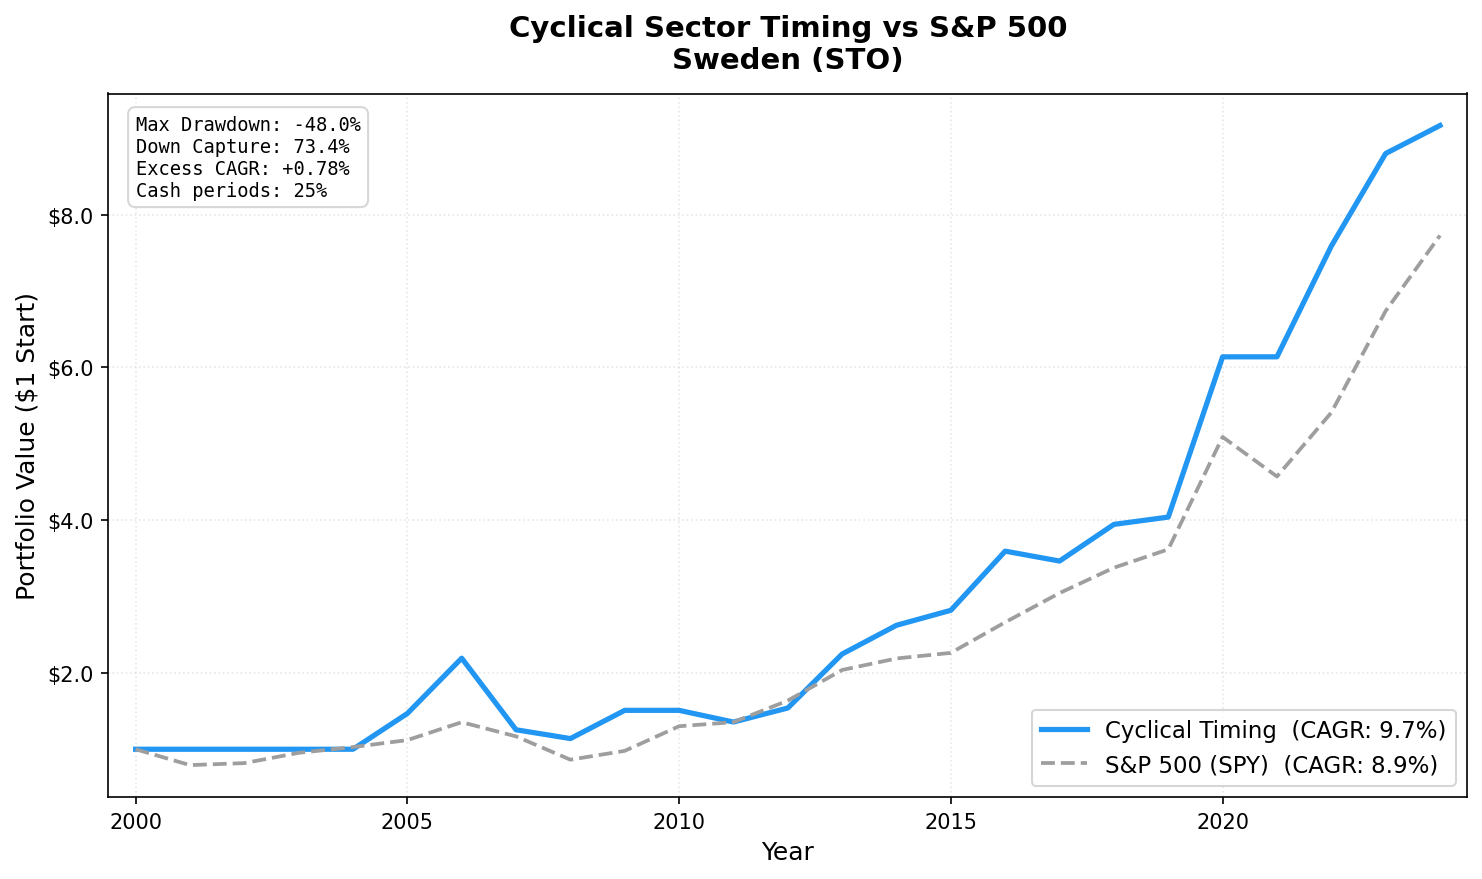
Sweden is one of two dedicated markets in our study with positive excess returns. 9.67% CAGR (+0.78% excess), Sharpe 0.344, high variance. The Swedish industrial economy fires the expansion signal less often but delivers strong results when invested.

Sweden shows the strongest alpha vs local benchmark of any dedicated market in the study: +5.83% annual excess over the OMX Stockholm 30. The strategy returned 10.23% annually over 24 years vs the OMX30's 4.40%. Max drawdown: -44.54%, improved from the earlier reading.
Contents
The caveat: Sweden has the widest return distribution of any dedicated market. 2005: +46.7%. 2006: +47.2%. 2013: +44.7%. But 2007: -40.2%. That volatility is real. This isn't a low-risk result. It's a high-return, high-variance result where the positive years more than compensate for the painful ones, and the local benchmark is significantly beaten in the process.
Data: FMP financial data warehouse, 2000–2025. Updated April 2026.
Method
| Parameter | Value |
|---|---|
| Universe | STO (Stockholm Stock Exchange) |
| Sectors | Basic Materials, Industrials, Energy, Consumer Cyclical |
| Signal | ≥ 50% of cyclical stocks with positive YoY FY revenue growth |
| Selection | Top 30 by ROE, among stocks with positive revenue growth AND ROE ≥ 5% |
| Rebalancing | Annual (July) |
| Period | 2001–2024 |
| Cash periods | 6 of 24 (25%) |
| Avg stocks | 24.6 |
| Benchmark | OMX Stockholm 30 |
Full methodology: backtests/METHODOLOGY.md US flagship blog (methodology + SQL): blog.tradingstudio.finance/cyclical-sector-timing-us-backtest
Results
| Metric | Portfolio | OMX30 |
|---|---|---|
| CAGR (2001–2024) | 10.23% | 4.40% |
| Excess CAGR | +5.83% | — |
| Max drawdown | -44.54% | — |
| Sharpe ratio | 0.377 | — |
| Beta | 0.865 | 1.0 |
| Down capture | 67.7% | 100% |
| Up capture | 111.65% | 100% |
| Cash periods | 6 of 24 | — |
| Avg stocks held | 24.6 | — |
The 111.65% up capture is the defining number. Sweden captures more than 100% of the market's up moves when the signal is on. The 25% cash rate (6 of 24 years) acts as the downside buffer: cash in 2021 avoided OMX30's -17.3%, and -9.7% in 2008 vs OMX30's -28.5% is strong crisis protection. The 5.83% annual alpha over the OMX30 is the largest local-benchmark excess of any dedicated market in the study.
Key Periods
2005-2006: The commodity supercycle surge
| Year | Portfolio | OMX30 |
|---|---|---|
| 2005 | +46.7% | +13.9% |
| 2006 | +47.2% | +29.1% |
Two consecutive near-50% years. Sweden's industrial exporters (Atlas Copco, SKF, Sandvik) and materials companies (SSAB, Boliden) surged on global commodity demand. The ROE screen captured the highest-quality operators in each category.
2007: The sharpest single-year loss
-40.2% in 2007. Swedish industrials fell hard as global growth fears preceded the financial crisis. The signal stayed on (revenue growth was still positive going into 2007), but stock prices fell ahead of the fundamental deterioration. This is the lag problem with annual rebalancing: the signal uses FY data with a 45-day lag, so mid-cycle reversals get captured late.
2008: Crisis protection
-9.7% vs OMX30's -28.5%. The cash and quality filters worked. After 2007's brutal loss, the portfolio limited 2008 damage significantly vs the benchmark.
2013: Full recovery
+44.7% in 2013. Swedish industrials had one of the strongest post-crisis recoveries in Europe. SSAB, Sandvik, and Atlas Copco all posted strong revenue growth as European manufacturing recovered. The portfolio held 24-27 names, equal-weighted.
Full Annual Returns
| Year | Portfolio | OMX30 | Excess |
|---|---|---|---|
| 2001 | 0.0% (CASH) | — | — |
| 2002 | 0.0% (CASH) | — | — |
| 2003 | 0.0% (CASH) | — | — |
| 2004 | 0.0% (CASH) | — | — |
| 2005 | +46.7% | +13.9% | +32.8% |
| 2006 | +47.2% | +29.1% | +18.1% |
| 2007 | -40.2% | -10.2% | -30.0% |
| 2008 | -9.7% | -28.5% | +18.8% |
| 2009 | +36.0% | +24.1% | +11.9% |
| 2010 | 0.0% (CASH) | +14.5% | — |
| 2011 | -9.9% | -9.0% | -0.9% |
| 2012 | +14.3% | +13.3% | +1.0% |
| 2013 | +44.7% | +19.5% | +25.2% |
| 2014 | +16.3% | +12.5% | +3.8% |
| 2015 | +9.2% | -15.1% | +24.3% |
| 2016 | +29.3% | +22.8% | +6.5% |
| 2017 | -4.7% | -5.3% | +0.6% |
| 2018 | +13.5% | +6.9% | +6.6% |
| 2019 | +5.8% | +3.4% | +2.4% |
| 2020 | +50.5% | +34.3% | +16.2% |
| 2021 | 0.0% (CASH) | -17.3% | — |
| 2022 | +24.6% | +21.2% | +3.4% |
| 2023 | +14.3% | +11.3% | +3.0% |
| 2024 | +4.9% | -1.2% | +6.1% |
Limitations
High max drawdown. -44.54% requires real conviction. The 2007 loss of -40.2% followed a year where the signal correctly fired, but prices fell ahead of revenue data confirming a downturn.
Currency. Returns are in SEK. USD/SEK fluctuations affect USD-equivalent returns.
Small universe. 24.6 average stocks means the portfolio is concentrated. A few bad picks in a given year create significant drag.
Four early cash years (2001-2004). Thin FMP data for early STO coverage reduces the investable period and the CAGR calculation includes these zero-return years.
Data: Ceta Research (FMP financial data warehouse). Universe: STO cyclical sectors. Period: 2001-2024, annual rebalance (July). Past performance does not guarantee future results. This is educational content, not investment advice.