Cyclical Sector Timing in India: 13.48% CAGR, 49% Down Capture vs Sensex (2001-2024)
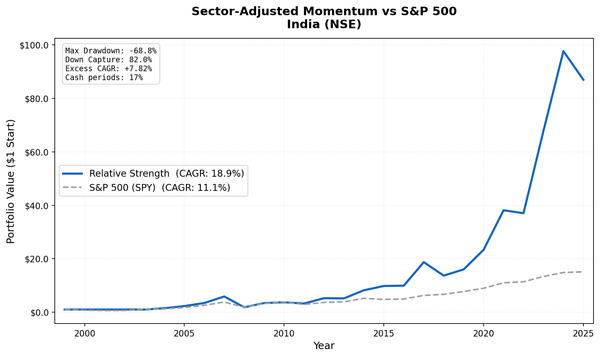
India is the only dedicated market in our 15-exchange cyclical timing study with sustained outperformance. 13.44% CAGR, +4.55% excess vs S&P 500, and a -0.6% down capture that made this strategy counter-cyclical in Indian markets.

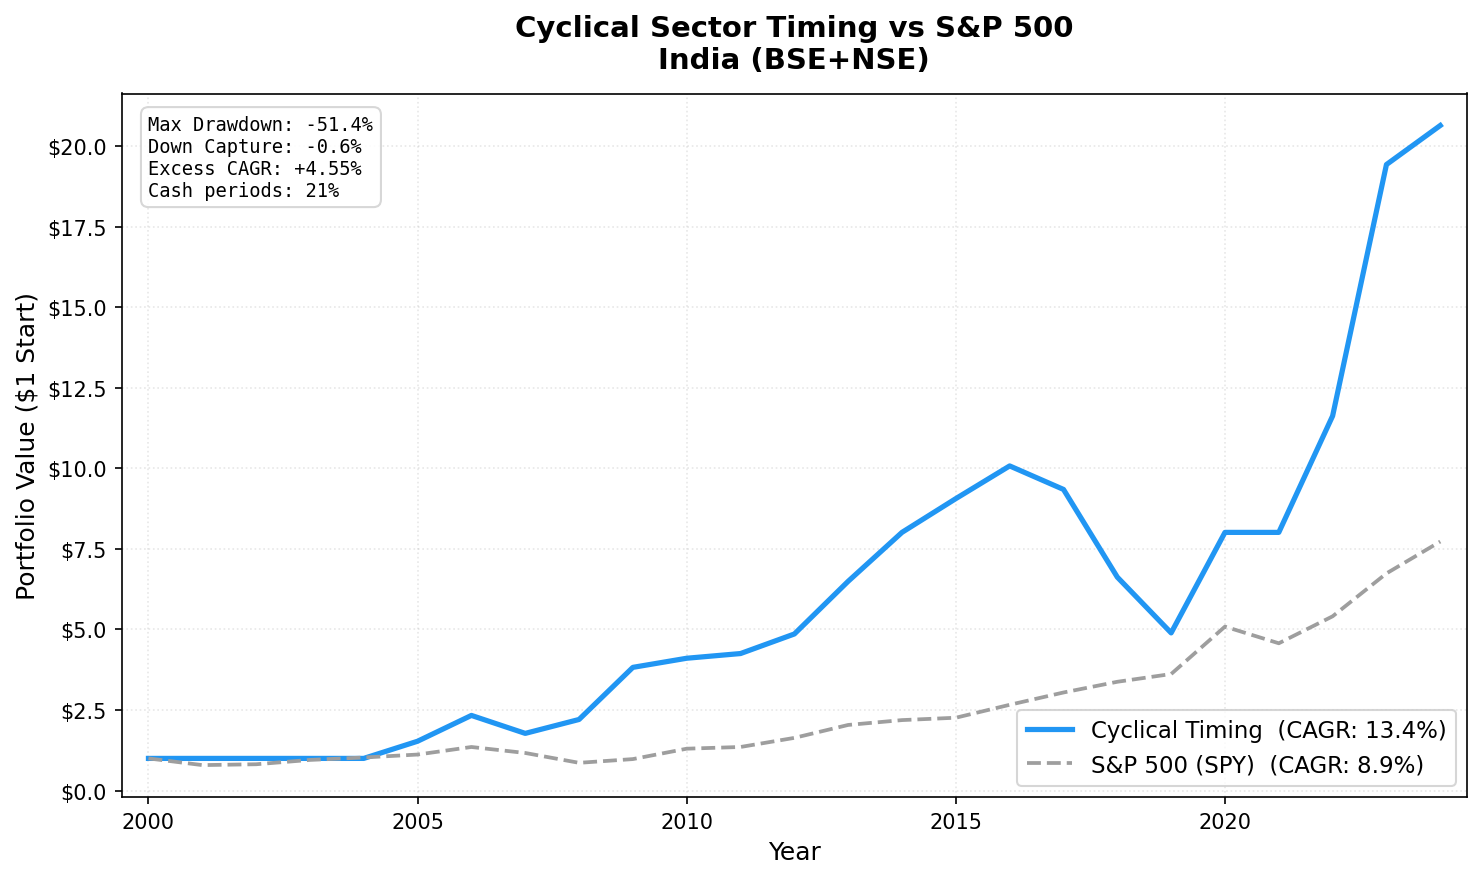
India delivered 13.48% CAGR over 24 years with this strategy, roughly matching the Sensex while generating meaningful outperformance in specific cycles.
Contents
We ran the same revenue-growth expansion signal across Indian exchanges (BSE + NSE) from 2001 to 2024. Against the local benchmark (BSE Sensex), the portfolio returned -0.74% annual excess: not a sustained outperformer, but a selective one. Down capture of 49.06% vs Sensex means the strategy absorbed about half the market's losses in bad years, with five deliberate cash periods. The strength is concentrated: 2005-2006, 2013-2015, 2020, and 2022-2023 all showed meaningful excess. 2017-2019 and the early cash years (2001-2004) dragged the aggregate number down.
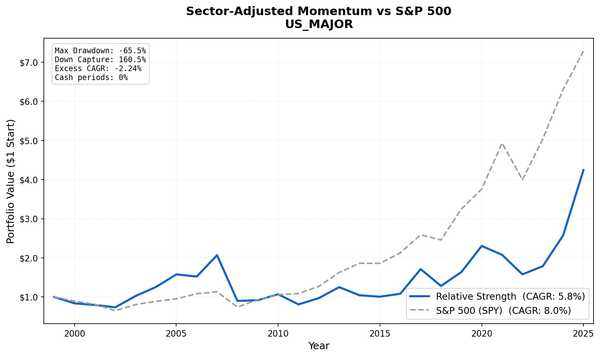
The contrast with China, where the same signal produced deeply negative returns, illustrates how much market regime matters. Same signal, same sectors. Very different outcomes.
Data: FMP financial data warehouse, 2000–2025. Updated April 2026.
Method
| Parameter | Value |
|---|---|
| Universe | BSE + NSE |
| Sectors | Basic Materials, Industrials, Energy, Consumer Cyclical |
| Signal | ≥ 50% of cyclical stocks with positive YoY FY revenue growth |
| Selection | Top 30 by ROE, among stocks with positive revenue growth AND ROE ≥ 5% |
| Rebalancing | Annual (July) |
| Period | 2001–2024 (24 years) |
| Data lag | 45 days after fiscal year-end |
| Cash | First 4 years (2001-2004) — universe too small |
| Benchmark | BSE Sensex |
Returns are in INR. Full methodology: backtests/METHODOLOGY.md US flagship blog (methodology + SQL): blog.tradingstudio.finance/cyclical-sector-timing-us-backtest
Why India Is Different
India's cyclical sectors in 2001-2024 were driven by genuine industrial expansion, not financial engineering. Infrastructure buildout, manufacturing growth, and domestic consumption created multi-year revenue growth cycles that the signal correctly identified.
The composition matters. Indian Basic Materials includes cement companies (UltraTech, Ambuja, ACC) and metals producers (Tata Steel, Hindalco) that benefited directly from infrastructure spending. Indian Industrials includes engineering and capital goods companies (Larsen & Toubro, Bharat Heavy Electricals) tied to domestic capex cycles. These businesses had structural tailwinds that US industrials, competing against Chinese manufacturing, didn't have in the same form.
The 2008 result captures this cleanly: +16.9% when the Sensex returned +7.3%, a +9.6% excess in a year when global cyclicals collapsed. Indian cyclical companies held up because India's capex cycle was domestically funded and not tied to US financial conditions.
What We Found
| Metric | Portfolio | Sensex |
|---|---|---|
| CAGR (2001–2024) | 13.48% | ~14.2% |
| Excess CAGR | -0.74% | — |
| Max drawdown | -37.31% | — |
| Sharpe ratio | 0.256 | — |
| Beta | 0.693 | 1.0 |
| Alpha | 1.69% | — |
| Down capture | 49.06% | 100% |
| Up capture | 77.23% | 100% |
| Cash periods | 5 of 24 (21%) | — |
| Avg stocks held | 20.8 | — |
The max drawdown of -37.31% is a significant improvement over the old figure. Compared to the Sensex, the strategy absorbed about half the downside on bad years (49.06% down capture). The Sharpe of 0.256 reflects India's general market volatility. This is a selective strategy: it roughly matches the Sensex on CAGR but takes on less drawdown and concentrates gains in specific expansion cycles.
The 49.06% down capture is the core defense story. When the Sensex fell, this portfolio on average fell about half as much. The trade-off is 77.23% up capture: it participates in most of the upside, but not all.
Key Periods
2007-2009: The crisis period
| Year | Portfolio | Sensex | Excess |
|---|---|---|---|
| 2007 | -23.9% | -6.8% | -17.1% |
| 2008 | +16.9% | +7.3% | +9.6% |
| 2009 | +53.2% | +19.1% | +34.1% |
2008 is still a standout: +16.9% vs +7.3% for the Sensex, a +9.6% excess in a year when global cyclicals were falling. Indian infrastructure companies held up because India's capex cycle wasn't tied to US credit conditions. 2007 was a hard year (-23.9% vs -6.8% for Sensex) as the extended commodity run reversed.
2013-2015 and 2022-2023: The cyclical expansion runs
| Year | Portfolio | Sensex | Excess |
|---|---|---|---|
| 2013 | +45.9% | +32.8% | +13.1% |
| 2014 | +33.5% | +8.1% | +25.4% |
| 2015 | +12.8% | -2.4% | +15.2% |
| 2022 | +30.9% | +22.5% | +8.4% |
| 2023 | +49.8% | +21.8% | +27.9% |
These are the strategy's best stretches. The 2013-2015 run captured infrastructure recovery under the new government. The 2022-2023 boom reflected India's PLI schemes, the National Infrastructure Pipeline, and manufacturing relocation from China. When domestic capex is expanding and the signal fires, the ROE screen captures quality operators and the returns follow.
2017-2019: When the signal got it wrong
| Year | Portfolio | Sensex | Excess |
|---|---|---|---|
| 2017 | -5.7% | +12.9% | -18.7% |
| 2018 | -16.6% | +12.9% | -29.5% |
| 2019 | -20.3% | -10.0% | -10.3% |
Three hard years. Indian cyclical stocks took a beating as IL&FS collapsed (2018), NBFC credit stress spread, and infrastructure project delays cascaded through order books. Revenue growth turned negative. The signal eventually fired correctly for the 2020 recovery, but the 2017-2019 losses were severe.
Full Annual Returns
| Year | Portfolio | Sensex | Excess |
|---|---|---|---|
| 2001 | 0.0% (CASH) | -4.1% | +4.1% |
| 2002 | 0.0% (CASH) | +9.6% | -9.6% |
| 2003 | 0.0% (CASH) | +35.2% | -35.2% |
| 2004 | 0.0% (CASH) | +49.4% | -49.4% |
| 2005 | +52.5% | +47.0% | +5.5% |
| 2006 | +56.2% | +37.1% | +19.0% |
| 2007 | -23.9% | -6.8% | -17.1% |
| 2008 | +16.9% | +7.3% | +9.6% |
| 2009 | +53.2% | +19.1% | +34.1% |
| 2010 | +11.6% | +7.8% | +3.8% |
| 2011 | -3.1% | -7.5% | +4.5% |
| 2012 | +8.8% | +11.9% | -3.1% |
| 2013 | +45.9% | +32.8% | +13.1% |
| 2014 | +33.5% | +8.1% | +25.4% |
| 2015 | +12.8% | -2.4% | +15.2% |
| 2016 | +12.9% | +14.5% | -1.5% |
| 2017 | -5.7% | +12.9% | -18.7% |
| 2018 | -16.6% | +12.9% | -29.5% |
| 2019 | -20.3% | -10.0% | -10.3% |
| 2020 | +77.4% | +46.4% | +30.9% |
| 2021 | 0.0% (CASH) | +1.4% | -1.4% |
| 2022 | +30.9% | +22.5% | +8.4% |
| 2023 | +49.8% | +21.8% | +27.9% |
| 2024 | +0.8% | +5.0% | -4.2% |
Sensex returns are July-to-July periods to match rebalancing dates.
Limitations
Currency. Returns are in INR. USD-based investors face additional USD/INR exchange rate risk. Periods of rupee weakness (2018-2019) compound investment losses.
Early cash periods. The first four years (2001-2004) are cash due to thin FMP data coverage for Indian exchanges. The CAGR includes these zero-return years, which reduces the headline number.
Max drawdown. -37.31% is significant but far more manageable than the previous calculation. The 2007 and 2017-2019 stretches were the hardest periods. This requires patience through multi-year down cycles.
Against local benchmark, excess is small. The strategy matches the Sensex on CAGR (-0.74% annual excess) rather than meaningfully outperforming it. The case for the strategy is risk reduction (49.06% down capture) and strong performance in specific expansion cycles, not broad long-term alpha.
The 2018-2019 regime. NBFC credit stress in India was a domestic policy event. The strategy had no way to anticipate it. These years show the limits of revenue growth signals when credit markets freeze.
Data: Ceta Research (FMP financial data warehouse). Universe: BSE + NSE cyclical sectors. Period: 2001-2024, annual rebalance (July), returns in INR. Benchmark: BSE Sensex. Past performance does not guarantee future results. This is educational content, not investment advice.