Cyclical Sector Timing in Germany: 8.24% CAGR, +2.41% Alpha Over DAX (XETRA, 2001-2024)
Germany produced the best risk-adjusted cyclical timing result among developed markets. 8.48% CAGR (-0.41% excess), Sharpe 0.411, max drawdown -35.07%. German industrials and materials provided stable expansion signals across 24 years.

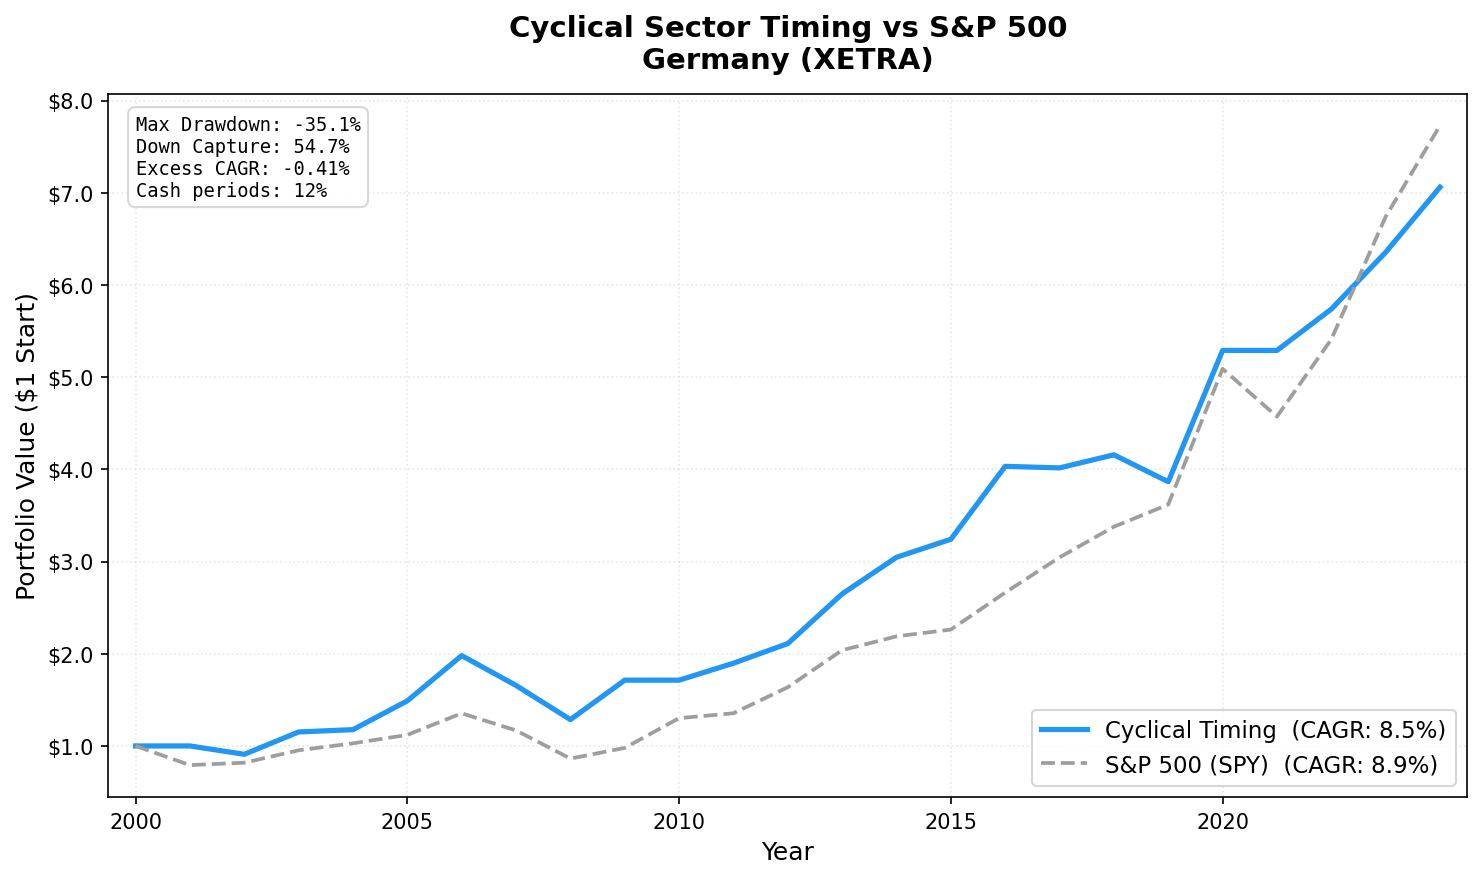
Germany produced the best risk-adjusted cyclical timing result among developed Western markets.
Contents
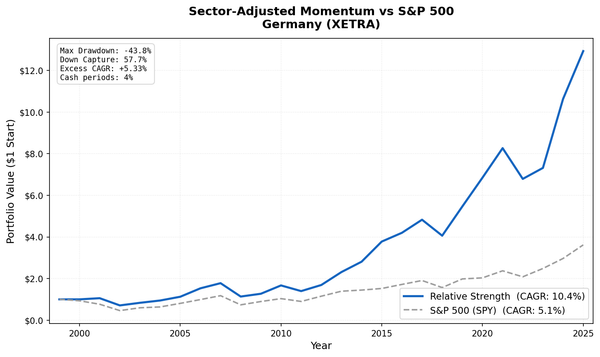
The XETRA backtest (2001-2024) returned 8.24% annually, +2.41% above the DAX. Sharpe ratio: 0.385. Max drawdown: -38.57%. Only 4 of 24 years in cash (17%).
Germany's industrial economy is the reason. Mittelstand companies (the mid-sized industrial specialists that form the backbone of German exports) run on lean operations and show clear revenue cycles tied to European and global manufacturing demand. When the expansion signal fires on XETRA, it's reflecting genuine industrial orders growth, not financial sector noise.
Data: FMP financial data warehouse, 2000–2025. Updated April 2026.
Method
| Parameter | Value |
|---|---|
| Universe | XETRA |
| Sectors | Basic Materials, Industrials, Energy, Consumer Cyclical |
| Signal | ≥ 50% of cyclical stocks with positive YoY FY revenue growth |
| Selection | Top 30 by ROE, among stocks with positive revenue growth AND ROE ≥ 5% |
| Rebalancing | Annual (July) |
| Period | 2001–2024 |
| Cash periods | 4 of 24 (17%) |
| Avg stocks | 19.1 |
| Benchmark | DAX Total Return |
Full methodology: backtests/METHODOLOGY.md US flagship blog (methodology + SQL): blog.tradingstudio.finance/cyclical-sector-timing-us-backtest
Results
| Metric | Portfolio | DAX |
|---|---|---|
| CAGR (2001–2024) | 8.24% | 5.83% |
| Excess CAGR | +2.41% | — |
| Max drawdown | -38.57% | — |
| Sharpe ratio | 0.385 | — |
| Beta | 0.715 | 1.0 |
| Alpha | 4.16% | — |
| Down capture | 39.5% | 100% |
| Up capture | 82.88% | 100% |
| Cash periods | 4 of 24 | — |
| Avg stocks held | 19.1 | — |
The 2.41% annual alpha over the DAX and best-in-class Sharpe among developed markets tell a consistent story. German cyclical timing outperformed the local benchmark with less volatility. The 39.5% down capture is meaningful protection. The 82.88% up capture means most of the upside is retained.
The signal worked reliably in Germany because German industrial companies have relatively transparent revenue cycles. Export orders, manufacturing PMI, and infrastructure contracts create leading indicators that FY revenue data confirms with a lag. The 45-day data lag still captures the trend direction.
Two standout defensive years: 2011, +6.7% vs DAX -12.7%. 2015, +9.7% vs DAX -12.5%. Cash in 2021 avoided DAX -18.4%.
Key Periods
2009: Strong post-crisis recovery (+38.3%)
After the 2008 crisis, German cyclical stocks recovered sharply. German exporters (auto parts suppliers, machinery manufacturers, specialty chemicals) bounced hard as global trade normalized in 2009. The portfolio captured this with +38.3% vs DAX +23.6%.
2020: Industrial recovery (+32.3%)
COVID-related manufacturing disruptions resolved faster in Germany than in many markets. German industrial companies with strong balance sheets recovered their order books quickly. +32.3% in 2020 vs DAX +24.1%.
2022-2024: Consistent positive returns
| Year | Portfolio | DAX |
|---|---|---|
| 2022 | +9.0% | +25.9% |
| 2023 | +12.1% | +14.3% |
| 2024 | +16.4% | +29.5% |
Three consecutive positive years against a mixed global backdrop reflects Germany's industrial base maintaining expansion through the post-COVID cycle, even as energy costs rose.
Full Annual Returns
| Year | Portfolio | DAX | Excess |
|---|---|---|---|
| 2001 | 0.0% (CASH) | -20.5% | — |
| 2002 | -2.9% | -8.8% | +5.9% |
| 2003 | +20.4% | +15.3% | +5.1% |
| 2004 | +7.1% | +13.9% | -6.8% |
| 2005 | +27.2% | +24.2% | +3.0% |
| 2006 | +34.2% | +21.5% | +12.7% |
| 2007 | -16.6% | -8.1% | -8.5% |
| 2008 | -26.2% | -19.2% | -7.0% |
| 2009 | +38.3% | +23.6% | +14.7% |
| 2010 | 0.0% (CASH) | +27.6% | — |
| 2011 | +6.7% | -12.7% | +19.4% |
| 2012 | +11.9% | +21.8% | -9.9% |
| 2013 | +28.5% | +25.3% | +3.2% |
| 2014 | +13.2% | +12.0% | +1.2% |
| 2015 | +9.7% | -12.5% | +22.2% |
| 2016 | +22.4% | +28.5% | -6.1% |
| 2017 | -2.0% | -1.9% | -0.1% |
| 2018 | +3.2% | +2.4% | +0.8% |
| 2019 | -2.7% | +0.7% | -3.4% |
| 2020 | +32.3% | +24.1% | +8.2% |
| 2021 | 0.0% (CASH) | -18.4% | — |
| 2022 | +9.0% | +25.9% | -16.9% |
| 2023 | +12.1% | +14.3% | -2.2% |
| 2024 | +16.4% | +29.5% | -13.1% |
Limitations
Currency. Returns are in EUR. USD/EUR fluctuations affect the USD-equivalent returns.
Energy sector size. Germany's energy sector is smaller than the US equivalent. The cyclical universe is more industrials-dominated, which creates concentration in a single sector's revenue cycle.
Post-2021 structural headwinds. German manufacturing faced elevated energy costs from 2021 onward (Russia-Ukraine, gas price shock). The revenue growth signal still fired, but at lower magnitudes. This may continue affecting German cyclical signal quality going forward.
Data: Ceta Research (FMP financial data warehouse). Universe: XETRA cyclical sectors. Period: 2001-2024, annual rebalance (July). Past performance does not guarantee future results. This is educational content, not investment advice.