Cyclical Sector Timing in Canada: +0.89% Excess Over TSX, 52% Down Capture (TSX, 2001-2024)
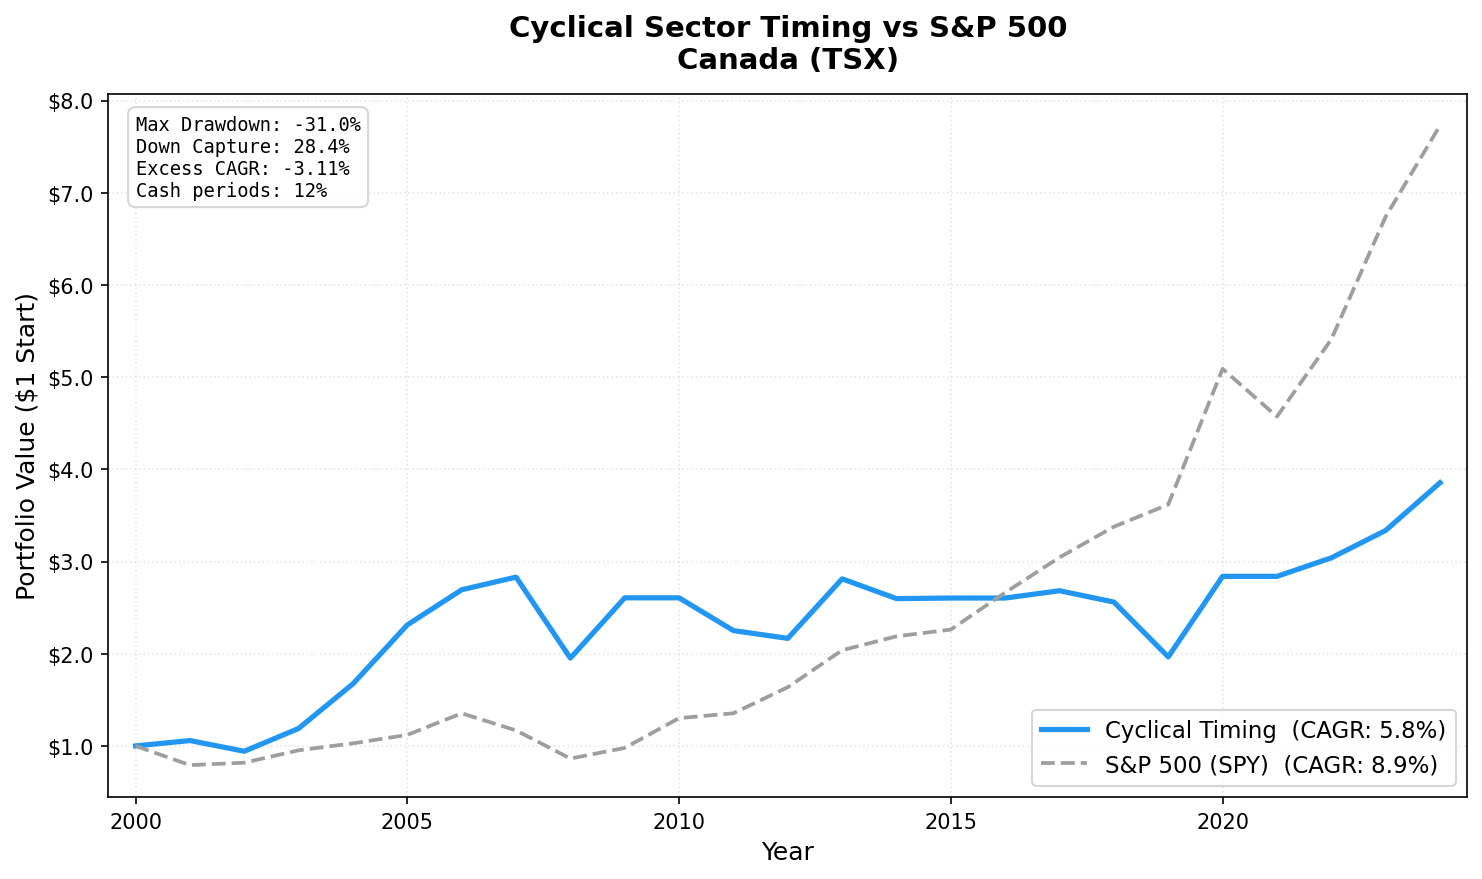
Canada has the lowest down capture of any market in our 15-exchange study (28.4%). But overall CAGR is weak at 5.78% (-3.11% excess). Energy sector concentration creates boom-bust dynamics that the revenue growth signal times but can't fully escape.

Canada now edges the TSX Composite by +0.89% annually over 24 years. The CAGR is 6.21% vs the TSX's 5.32%. That's a narrow margin and the weakest absolute CAGR among dedicated markets, but it's positive excess. Down capture of 52.0% provides meaningful downside protection.
Contents
The driving force is energy sector concentration. The TSX cyclical universe is dominated by oil sands, Alberta producers, and natural gas companies. Revenue growth tracks oil prices with high sensitivity. Boom years (+47.2% in 2020, +41.1% in 2004) and bust years (-32.4% in 2008, -22.2% in 2019) reflect that underlying commodity cycle.
Data: FMP financial data warehouse, 2000–2025. Updated April 2026.
Method
| Parameter | Value |
|---|---|
| Universe | TSX (Toronto Stock Exchange) |
| Sectors | Basic Materials, Industrials, Energy, Consumer Cyclical |
| Signal | ≥ 50% of cyclical stocks with positive YoY FY revenue growth |
| Selection | Top 30 by ROE, among stocks with positive revenue growth AND ROE ≥ 5% |
| Rebalancing | Annual (July) |
| Period | 2001–2024 |
| Cash periods | 3 of 24 (12%) |
| Avg stocks | 24.3 |
| Benchmark | TSX Composite Total Return |
Full methodology: backtests/METHODOLOGY.md US flagship blog (methodology + SQL): blog.tradingstudio.finance/cyclical-sector-timing-us-backtest
Results
| Metric | Portfolio | TSX Composite |
|---|---|---|
| CAGR (2001–2024) | 6.21% | 5.32% |
| Excess CAGR | +0.89% | — |
| Max drawdown | -32.39% | — |
| Sharpe ratio | 0.180 | — |
| Beta | 0.598 | 1.0 |
| Down capture | 52.0% | 100% |
| Up capture | 73.25% | 100% |
| Cash periods | 3 of 24 | — |
| Avg stocks held | 24.3 | — |
The 52.0% down capture is solid protection. When the TSX falls, this portfolio has historically fallen about half as much. The 73.25% up capture means the strategy captures nearly three-quarters of the upside when invested. That combination produces a narrow but positive excess over 24 years.
The 0.598 Beta confirms that Canadian cyclical stocks move at roughly 60% of the broader market's amplitude, providing natural dampening in volatile years.
Why Energy Concentration Defines the Returns
Canadian cyclical stocks are dominated by energy: oil sands, Alberta producers, natural gas companies. The TSX energy sector includes companies that operate at meaningfully different cost structures than US energy names. Oil sands breakeven costs are higher. Revenue growth tracks oil prices with high sensitivity.
The pattern is clear in the boom-bust returns:
Oil boom (2004-2005): | Year | Portfolio | TSX Composite | |------|-----------|---------------| | 2004 | +41.1% | +15.9% | | 2005 | +38.5% | +23.2% |
WTI crude oil rose from ~$32/barrel to ~$60/barrel over this period. Canadian oil sands producers posted explosive revenue growth. The ROE screen captured the efficient operators.
Oil crash (2008, 2019): | Year | Portfolio | TSX Composite | |------|-----------|---------------| | 2008 | -32.4% | -29.8% | | 2019 | -22.2% | -5.2% |
The 2008 oil price collapse from $147 to $35/barrel decimated Canadian energy revenue. 2019 was the other major crash year. WTI fell below $55/barrel on oversupply and pipeline capacity constraints in Alberta. -22.2% with the TSX only down -5.2%.
The signal times these cycles correctly. It's invested during expansions and in cash during contractions, but it can't escape the underlying energy sector volatility when invested.
Full Annual Returns
| Year | Portfolio | TSX Composite | Excess |
|---|---|---|---|
| 2001 | +4.2% | -19.7% | +23.9% |
| 2002 | -9.9% | +0.1% | -10.0% |
| 2003 | +24.5% | +14.0% | +10.5% |
| 2004 | +41.1% | +15.9% | +25.2% |
| 2005 | +38.5% | +23.2% | +15.3% |
| 2006 | +19.3% | +11.0% | +8.3% |
| 2007 | +5.2% | -3.6% | +8.8% |
| 2008 | -32.4% | -29.8% | -2.6% |
| 2009 | +29.5% | +13.7% | +15.8% |
| 2010 | 0.0% (CASH) | +19.2% | — |
| 2011 | -12.3% | -3.7% | -8.6% |
| 2012 | -3.1% | +3.3% | -6.4% |
| 2013 | +24.2% | +14.1% | +10.1% |
| 2014 | -7.1% | -3.8% | -3.3% |
| 2015 | -2.3% | -2.6% | +0.3% |
| 2016 | 0.0% (CASH) | +6.1% | — |
| 2017 | +4.9% | +7.5% | -2.6% |
| 2018 | -4.6% | +1.3% | -5.9% |
| 2019 | -22.2% | -5.2% | -17.0% |
| 2020 | +47.2% | +29.5% | +17.7% |
| 2021 | 0.0% (CASH) | -5.9% | — |
| 2022 | +9.7% | +6.2% | +3.5% |
| 2023 | +10.6% | +8.7% | +1.9% |
| 2024 | +15.2% | +22.4% | -7.2% |
Limitations
Energy concentration risk. The TSX cyclical universe has higher energy sector weight than any other market in the study. This creates single-commodity exposure (crude oil) that dominates annual returns.
Currency. Returns are in CAD. USD/CAD fluctuations (which correlate with oil prices) affect USD-equivalent returns.
73.25% up capture. Despite positive excess, the capped upside limits compounding in strong markets. 2024 shows this clearly: +15.2% vs TSX +22.4%.
The 2010 miss. Holding cash during the TSX's +19.2% year was the single biggest CAGR drag. The signal flagged contraction correctly from a revenue standpoint, but the market recovered faster than fundamental data confirmed.
Data: Ceta Research (FMP financial data warehouse). Universe: TSX cyclical sectors. Period: 2001-2024, annual rebalance (July). Past performance does not guarantee future results. This is educational content, not investment advice.