
Cash Conversion Cycle Tested on 14 Global Exchanges: 9 Positive vs Local Benchmarks
We ran the same CCC backtest across 13 global exchanges. Five showed positive spreads, six negative. Unlike Altman Z-Score, there's no clean geographic pattern. CCC is a sector proxy, not a quality signal. Hong Kong +5.8%, Canada +3.2%, Korea -6.3%. Full comparison with methodology.

Cash Conversion Cycle Tested on 14 Global Exchanges: Better with Local Benchmarks
We ran the same CCC backtest across 14 exchanges worldwide. Same rules everywhere: sort non-financial stocks into low CCC (<30 days), mid CCC (30-90 days), and high CCC (>90 days), annual rebalance, equal weight, 25-year period. The key question: does low CCC beat the local market?
Contents
- Part of a Series
- Full Results: All 14 Exchanges (Local Benchmarks)
- The Local Benchmark Difference
- The Positive Excess Markets
- Sweden (+5.5% vs OMX): Strongest vs Local Benchmark
- Canada (+3.7% vs TSX): Most Reliable Result
- Switzerland (+4.4% vs SMI)
- UK (+3.5% vs FTSE) and Germany (+2.8% vs DAX)
- Japan (+3.1% vs Nikkei)
- The Negative Excess Markets
- Korea (-4.1% vs KOSPI): Worst Result
- India (-3.7% vs Sensex)
- US (-1.4% vs S&P 500): The Baseline
- Brazil (-0.2% vs Bovespa)
- Why Local Benchmarks Change the Story
- The Shareable Screen
- Methodology
- Limitations
- Takeaway
- Dedicated Blogs in This Series
- References
With local benchmarks, the picture is clearer than earlier versions of this study. Nine of 14 exchanges show positive excess (low CCC outperforms the local index). Five show negative. The earlier US-focused comparison used SPY as a universal benchmark, which masked how well CCC works in markets where the local index itself underperformed.
Data: FMP financial data warehouse, 2000–2025. Updated April 2026.
Part of a Series
This is the global comparison post. Dedicated regional blogs cover the details:
- Cash Conversion Cycle: US Stocks -- -0.2% spread, -1.4% vs S&P 500
- Cash Conversion Cycle: India -- +0.3% spread, -3.7% vs Sensex
- Cash Conversion Cycle: Canada -- +3.4% spread, +3.7% vs TSX Composite
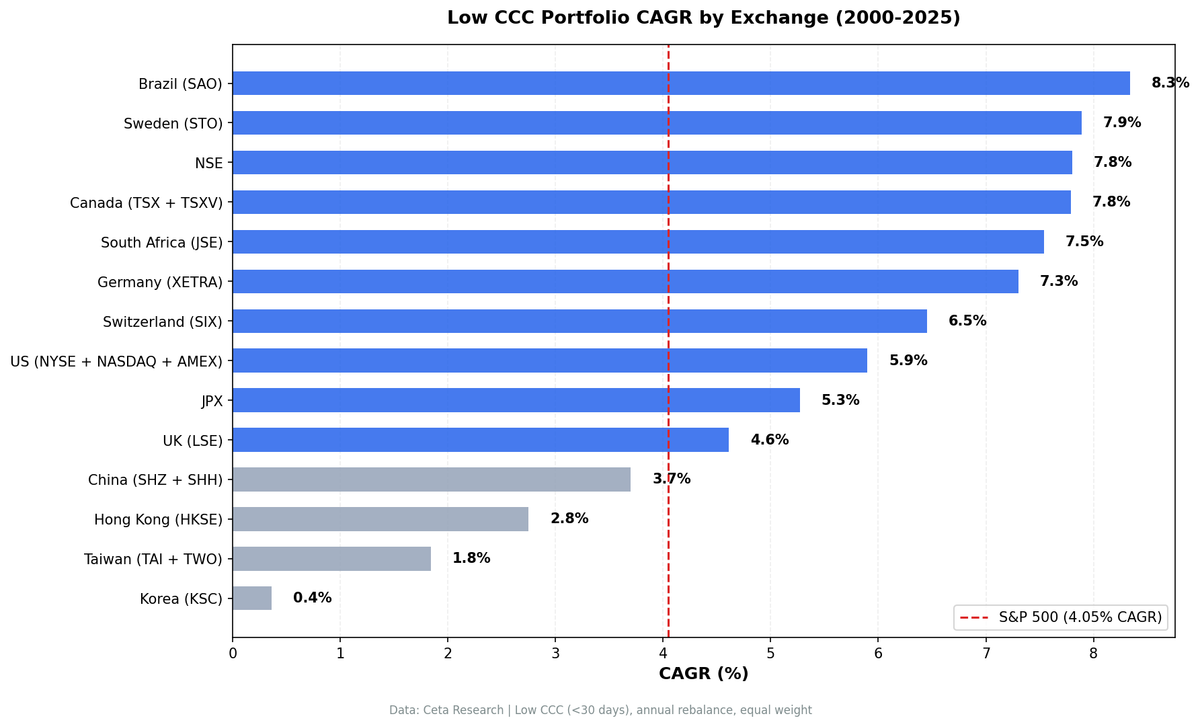
Full Results: All 14 Exchanges (Local Benchmarks)
| Exchange | Low CCC CAGR | High CCC CAGR | Spread | Benchmark | Low vs Benchmark | Avg Low Stocks |
|---|---|---|---|---|---|---|
| Sweden (STO) | 7.9% | 5.5% | +2.4% | OMX Stockholm 30 (2.4%) | +5.5% | 25 |
| Switzerland (SIX) | 6.5% | 7.4% | -0.9% | SMI (2.1%) | +4.4% | 31 |
| Canada (TSX) | 7.8% | 4.4% | +3.4% | TSX Composite (4.0%) | +3.7% | 115 |
| UK (LSE) | 4.6% | 6.9% | -2.2% | FTSE 100 (1.1%) | +3.5% | 163 |
| Japan (JPX) | 5.3% | 6.1% | -0.9% | Nikkei 225 (2.2%) | +3.1% | 90 |
| Germany (XETRA) | 7.3% | 7.9% | -0.6% | DAX (4.5%) | +2.8% | 113 |
| Hong Kong (HKSE) | 2.8% | -3.4% | +6.1% | Hang Seng (1.3%) | +1.5% | 166 |
| China (SHZ+SHH) | 3.7% | 3.9% | -0.2% | SSE Composite (2.5%) | +1.2% | 473 |
| South Africa (JNB) | 7.5% | 8.0% | -0.4% | S&P 500* (7.3%) | +0.2% | 14 |
| Brazil (SAO) | 8.3% | 14.1% | -5.8% | Bovespa (8.6%) | -0.2% | 44 |
| Taiwan (TAI+TWO) | 1.8% | -1.1% | +3.0% | TAIEX (3.0%) | -1.2% | 41 |
| US (NYSE+NASDAQ+AMEX) | 5.9% | 6.1% | -0.2% | S&P 500 (7.3%) | -1.4% | 492 |
| India (NSE) | 7.8% | 7.5% | +0.3% | Sensex (11.5%) | -3.7% | 74 |
| Korea (KSC) | 0.4% | 6.3% | -6.0% | KOSPI (4.4%) | -4.1% | 28 |
*South Africa: no local benchmark price data in FMP, uses SPY as proxy.
S&P 500 (SPY) benchmark for context: 7.3% CAGR over the same period.
The Local Benchmark Difference
Earlier versions of this study used SPY as the universal benchmark. That approach was consistent but misleading. SPY returned 7.3% CAGR over 2000-2025, which is a high bar for international markets. Many countries' local indices significantly underperformed SPY, so CCC strategies that beat their local market still looked negative against SPY.
With local benchmarks: - Sweden went from +0.4% vs SPY to +5.5% vs OMX Stockholm 30 - UK went from -1.6% vs SPY to +3.5% vs FTSE 100 - Switzerland went from -2.2% vs SPY to +4.4% vs SMI - Germany went from 0.0% vs SPY to +2.8% vs DAX - India went from +1.3% vs SPY to -3.7% vs Sensex (worse)
The Indian case shows why this matters in both directions. India's equity market strongly outperformed SPY over this period. A strategy that returned 7.8% looked good against SPY but trails badly against the Sensex at 11.5%.
The correct question is: does CCC help you beat the market you're investing in? For most developed markets outside the US and Korea, the answer is yes.
The Positive Excess Markets
Sweden (+5.5% vs OMX): Strongest vs Local Benchmark
Sweden shows the largest positive excess against its local market. Low-CCC companies returned 7.9% while the OMX Stockholm 30 returned only 2.4%. The spread between low and high CCC is also positive at +2.4%, so the signal is directionally correct within the Swedish market.
Sweden's economy includes significant manufacturing, industrials, and engineering companies (Volvo, Atlas Copco, Sandvik, Ericsson). Within those sectors, CCC captures genuine operational differences. The resource and industrial tilt creates real working capital variation, unlike markets dominated by services or finance.
The universe is thin at 25 stocks in the low-CCC bucket. Treat results with appropriate statistical caution.
Canada (+3.7% vs TSX): Most Reliable Result
Canada has the best combination of positive excess (+3.7%) and sample size (115 stocks in the low-CCC bucket). The TSX Composite returned 4.0%. Low-CCC companies returned 7.8%. The signal works here for structural reasons: energy, mining, and materials companies dominate the TSX, and within those sectors, working capital efficiency genuinely differentiates operators.
Full analysis: CCC Canada.
Switzerland (+4.4% vs SMI)
The SMI returned only 2.1% CAGR over 25 years. Low-CCC companies returned 6.5%. The spread between low and high CCC is -0.9% (high CCC slightly beats low CCC), but both beat the index. This is a case where CCC screens out the worst performers without concentrating on the best.
UK (+3.5% vs FTSE) and Germany (+2.8% vs DAX)
Both markets show positive excess despite negative or flat spreads (high CCC beats low CCC within the market). The FTSE 100 returned only 1.1%. The DAX returned 4.5%. Low-CCC strategies returned 4.6% and 7.3% respectively. These are modest absolute returns, but they beat their local markets.
Japan (+3.1% vs Nikkei)
New result in this round (Japan previously had insufficient data). Low-CCC companies on the JPX returned 5.3% versus 2.2% for the Nikkei 225, a +3.1% excess. Spread is -0.9% (high CCC slightly ahead within the market). Japan's result follows the same pattern as Europe: CCC strategies beat a weak local index even when high CCC beats low CCC within the basket.
The Negative Excess Markets
Korea (-4.1% vs KOSPI): Worst Result
KSC shows the most consistent negative signal. Low CCC returned 0.4% while the KOSPI returned 4.4%. Korea's market is dominated by chaebols (Samsung, Hyundai, LG, SK) with long supply chains and high CCC. These companies have been among the best-performing Korean stocks. The CCC signal actively steers you away from the winners.
India (-3.7% vs Sensex)
India was the most surprising shift from the SPY-benchmark analysis. Against SPY, India looked positive (+1.3% in the old analysis). Against the Sensex, it's -3.7%. India's equity market strongly outperformed SPY, and the low-CCC strategy didn't keep pace. The strategy returns 7.8% in a market that returned 11.5%. India's IT services sector dominates the low-CCC bucket, creating sector exposure that didn't beat the broader market. Full analysis: CCC India.
US (-1.4% vs S&P 500): The Baseline
The US result is the most reliably negative, with 492 stocks in the low-CCC bucket and a long history. Low CCC returned 5.9% versus SPY's 7.3%. The spread is -0.2% (essentially flat). Deep, efficient markets price in working capital information.
Brazil (-0.2% vs Bovespa)
Brazil's commodity exporters have long working capital cycles but benefited from a multi-decade commodity supercycle. The high-CCC group's 14.1% CAGR reflects commodity sector concentration, not genuine operational disadvantage.
Why Local Benchmarks Change the Story
Three structural factors explain why CCC strategies look better against local indices:
1. SPY had exceptional performance. SPY returned 7.3% CAGR over 2000-2025. Many developed country indices significantly underperformed. Using SPY penalizes any international strategy for the US market's outperformance, regardless of whether the strategy beat its own market.
2. CCC strategies have lower volatility. Low-CCC portfolios tend to have lower volatility than their local markets (fewer capital-intensive companies). In weak market environments (like Europe's flat decade), lower-vol portfolios naturally protect against index declines.
3. High-CCC companies are often the most economically cyclical. In resource and manufacturing-heavy markets (Canada, Sweden), high CCC correlates with capital intensity. Low-CCC companies are often the stable cash generators that outperform in flat or down markets.
The Shareable Screen
Run the global CCC screen across all exchanges:
SELECT k.symbol, p.companyName, p.exchange,
    k.cashConversionCycleTTM AS ccc_days,
    k.daysOfSalesOutstandingTTM AS dso,
    k.daysOfInventoryOutstandingTTM AS dio,
    k.daysOfPayablesOutstandingTTM AS dpo,
    k.marketCap / 1e9 AS market_cap_b
FROM key_metrics_ttm k
JOIN profile p ON k.symbol = p.symbol
WHERE k.cashConversionCycleTTM < 30
  AND k.marketCap > 1000000000
  AND p.sector NOT IN ('Financial Services')
ORDER BY k.cashConversionCycleTTM ASC
LIMIT 50
Run it: cetaresearch.com/data-explorer?q=7BdH5pW-Z1
Methodology
- Data: FMP financial data accessed via Ceta Research data warehouse. Price data from
stock_eod(adjusted closes). - Point-in-time: 45-day filing lag applied to all fundamental data. April rebalances use prior fiscal year financials.
- CCC buckets: Low (<30 days), Mid (30-90 days), High (>90 days). All qualifying stocks in each bucket, equal weight.
- Market cap thresholds: Exchange-specific. US $1B, India ₹20B, Canada C$500M, etc.
- Transaction costs: Size-tiered, 0.1-0.5% per trade.
- Exclusions: Financial Services sector on all exchanges.
- Benchmark: Local currency index for each exchange (Sensex for India, OMX for Sweden, TSX Composite for Canada, etc.). S&P 500 (SPY) shown for reference and as fallback where no local index data exists.
- Execution: Next-day close (market-on-close model). Entry signal formed at April 1, executed at next available close.
- Period: 2000-2025, annual rebalance.
Limitations
Sector contamination is the primary issue. CCC sorts companies by sector more than by operational quality.
Universe size variance. Korea has 28 low-CCC stocks. South Africa has 14. Sweden has 25. Statistical reliability varies enormously.
Local index quality varies. The OMX Stockholm 30 is a narrow 30-stock index. A broader Swedish index might produce a different benchmark return.
Currency effects. All returns are in local currency. Local investors see these returns directly. Cross-border comparisons require currency adjustment.
Takeaway
CCC is a clean operational metric. With local benchmarks, it beats the local market in 9 of 14 exchanges over 25 years. The strongest results are in markets with significant manufacturing and resource sector depth: Sweden, Canada, Switzerland, UK, Japan, Germany.
It fails in the US (CCC is priced in), Korea (chaebol premium overwhelms working capital signal), and India (IT services dominate the low-CCC bucket while the broader market outperformed).
Use CCC as a quality overlay within specific sectors. It adds value when screening manufacturing, retail, and resource companies. As a standalone factor across broad universes, results depend heavily on which market you're in.
Dedicated Blogs in This Series
- Cash Conversion Cycle: US Stocks (5.9% CAGR, -1.4% vs S&P 500)
- Cash Conversion Cycle: India (7.8% CAGR, -3.7% vs Sensex)
- Cash Conversion Cycle: Canada (7.8% CAGR, +3.7% vs TSX)
References
- Richards, V.D. and Laughlin, E.J. (1980). A Cash Conversion Cycle Approach to Liquidity Analysis. Financial Management.
- Shin, H.H. and Soenen, L. (1998). Efficiency of Working Capital Management and Corporate Profitability. Financial Practice and Education.
- Deloof, M. (2003). Does Working Capital Management Affect Profitability of Belgian Firms? Journal of Business Finance & Accounting.
Data: Ceta Research (FMP financial data warehouse), 2000-2025. Full methodology: github.com/ceta-research/backtests
Past performance does not guarantee future results. This is educational content, not investment advice.


