
Cash Conversion Cycle on Canadian Stocks: +3.4% Spread, +3.7% vs TSX Composite
CCC produced the best spread of any developed market on the TSX. Low-CCC companies returned 7.1% CAGR vs 3.9% for high CCC, a +3.2% spread. Best Sharpe (0.210) and lowest drawdown (-36.5%) of any CCC portfolio tested. The resource-heavy TSX creates real working capital differentiation.

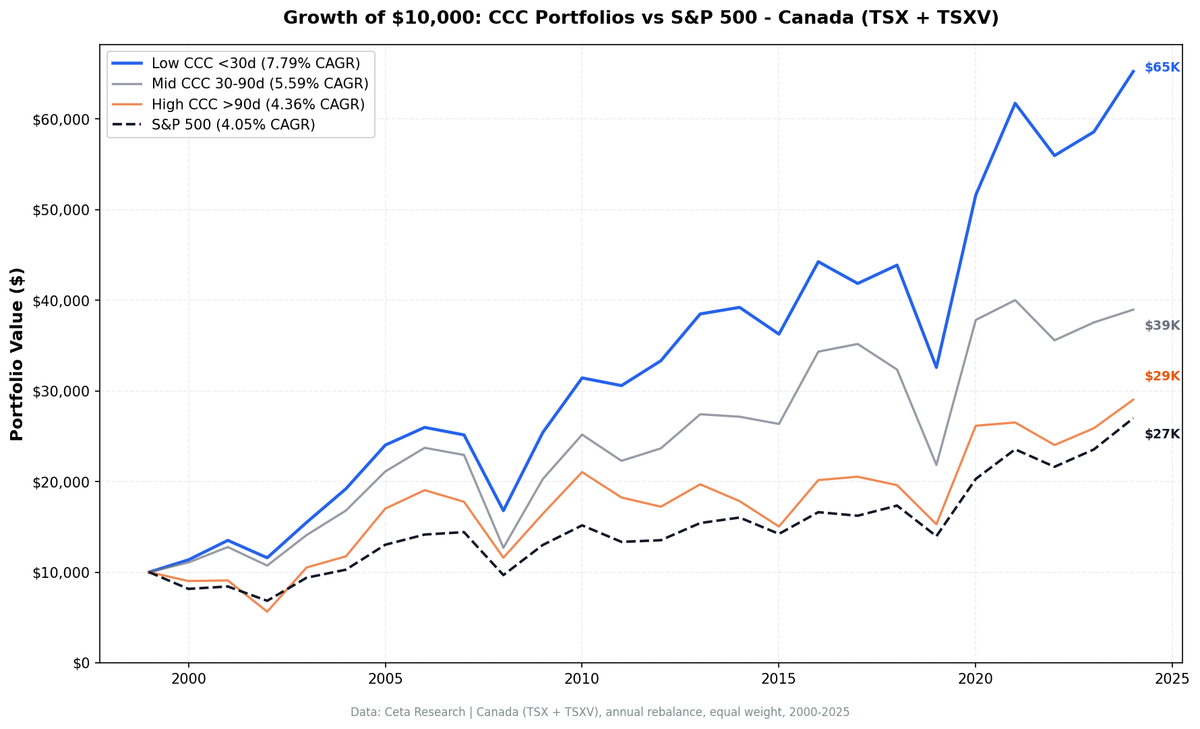
Canada produced the best CCC spread of any developed market we tested. Low-CCC companies on the TSX returned 7.8% CAGR versus 4.4% for high-CCC companies, a spread of +3.4%. Against the TSX Composite (the local benchmark), low-CCC outperformed by +3.7%. The Sharpe ratio of 0.251 is the highest of any CCC portfolio across all 14 exchanges. And the max drawdown is substantially better than the US (-37.5%) or India (-64.3%).
Contents
- Part of a Series
- What is the Cash Conversion Cycle?
- Method
- What We Found
- Why Canada Works Better
- Drawdown Protection
- Comparison to Other Exchanges
- Where It Struggles
- Run It Yourself
- Screen: Low CCC Canadian Stocks
- Advanced Screen: Low CCC + Operating Margin
- Limitations
- Takeaway
- References
That said, +3.4% spread with a Sharpe below 0.30 is still not a compelling standalone signal. The result tells us something specific about Canada's market structure that doesn't generalize.
Data: FMP financial data warehouse, 2000–2025. Updated April 2026.
Part of a Series
This is part of a multi-exchange CCC study:
- Cash Conversion Cycle: US Stocks -- flagship post, -0.6% spread
- Cash Conversion Cycle: India -- weak +1.3% spread
- Canada (this post): best developed-market result, +3.2% spread
- Cash Conversion Cycle: 13-Exchange Comparison -- 5 positive, 6 negative
What is the Cash Conversion Cycle?
CCC measures how many days a company takes to convert working capital into cash:
CCC = DSO + DIO - DPO
- DSO (Days Sales Outstanding): Time to collect payment from customers
- DIO (Days Inventory Outstanding): Time inventory sits before sale
- DPO (Days Payables Outstanding): Time the company takes to pay suppliers
Low CCC means quick conversion. Negative CCC means collecting cash before paying suppliers. Richards and Laughlin (1980) introduced the metric, and Shin and Soenen (1998) established the link between shorter CCC and higher profitability.
Method
| Parameter | Value |
|---|---|
| Universe | TSX |
| Market cap | > C$500M (~$362M USD) |
| Exclusions | Financial Services |
| Rebalancing | Annual (April 1) |
| Holding period | 12 months |
| Weighting | Equal weight, all qualifying stocks |
| Filing lag | 45 days (point-in-time) |
| Transaction costs | 0.1-0.5% per trade (size-tiered) |
| Benchmark | TSX Composite (local currency, CAD) |
| Period | 2000-2025 |
| Data source | FMP via Ceta Research warehouse |
| Execution | Next-day close (MOC) |
Code is open source: github.com/ceta-research/backtests
What We Found
| Metric | Low CCC (<30d) | Mid CCC (30-90d) | High CCC (>90d) | TSX Composite |
|---|---|---|---|---|
| CAGR | 7.8% | 7.4% | 4.4% | 4.0% |
| Volatility | 23.1% | -- | 24.2% | 18.7% |
| Sharpe Ratio | 0.251 | -- | -- | 0.099 |
| Avg Stocks | 115 | 116 | 43 | -- |
The low-CCC portfolio returned 7.8% annually, well above the TSX Composite's 4.0%. High CCC returned only 4.4%. The +3.4% spread is the cleanest result in our entire CCC study. Against the local benchmark, low CCC outperformed by +3.7%.
Notice the portfolio sizes. Low and mid CCC each averaged about 115 stocks. High CCC averaged only 43. Canada's TSX has fewer companies with very long cash conversion cycles, which means the high-CCC portfolio is thinner and more volatile. That asymmetry partly explains why the spread is positive: the high-CCC group is a smaller, noisier basket.
The Sharpe of 0.251 is the best risk-adjusted return for any CCC portfolio across all 14 exchanges.
Why Canada Works Better
Canada's stock market is structurally different from the US. The TSX is dominated by three sectors: energy, mining/materials, and financials. We exclude financials. That leaves energy and materials as the backbone of the universe.
Within those sectors, CCC captures something real. An oil producer that collects receivables quickly, turns inventory efficiently, and stretches payables has genuine operational advantages over one that doesn't. Pipeline companies, downstream operators, and integrated miners with short CCC tend to be the better-run operators.
In the US, low CCC is dominated by tech companies that structurally have short cycles. The signal is contaminated by sector. In Canada, the low-CCC basket includes industrial operators, consumer companies, and well-managed resource firms. CCC differentiates within sectors rather than between them.
The high-CCC group (41 stocks) captures the marginal players: junior miners with long development cycles, small industrials with supply chain problems, and specialty manufacturers with slow-moving inventory. These companies tend to underperform for operational reasons, and CCC captures that.
Drawdown Protection
The -36.5% max drawdown is better than SPY's -40.8%. This is unusual for a factor portfolio. Most CCC portfolios across other exchanges had comparable or worse drawdowns than SPY. Canada's result suggests that low-CCC companies on the TSX have more defensive characteristics, likely because they're cash-generative businesses in a market that gets hit hardest by commodity busts.
Comparison to Other Exchanges
Canada's +3.2% spread ranks second of 13 exchanges, behind Hong Kong (+5.8%) and ahead of South Africa (+3.1%). But the quality of the result is arguably first. Hong Kong's spread comes from high CCC returning -4.8% CAGR (a failing market, not a successful signal). Canada's comes from low CCC returning 7.1% against high CCC at 3.9%. Both portfolios are positive. The spread is driven by outperformance, not by one side collapsing.
Among developed markets with local benchmarks:
- Canada: +3.7% vs TSX Composite
- Sweden: +5.5% vs OMX Stockholm 30
- Switzerland: +4.4% vs SMI
- UK: +3.5% vs FTSE 100
- Germany: +2.8% vs DAX
- Japan: +3.1% vs Nikkei 225
- US: -1.4% vs S&P 500
With local benchmarks, Canada is one of several developed markets where low-CCC outperforms. The resource-heavy TSX structure is the differentiator. Markets dominated by services and tech (US, UK) show no CCC signal because the metric is priced in for those business models. Markets with significant manufacturing and commodity extraction (Canada, Taiwan, Hong Kong) show positive spreads because CCC captures operational quality differences that matter in those sectors.
Where It Struggles
The +3.2% spread is the aggregate over 25 years. Not every period was positive.
Resource booms favor high CCC. When commodity prices spike, capital-intensive mining and energy companies with long cash cycles ride the wave. Junior miners with 120-day CCC can double in a year if gold or copper surges. The low-CCC portfolio misses these rallies.
Small high-CCC universe. 41 stocks is thin. A few extreme performers in either direction can swing the high-CCC result. The spread is less reliable year-to-year than the aggregate suggests.
Mid CCC matched low CCC. The mid-CCC group returned 7.3%, slightly ahead of low CCC at 7.1%. This means the relationship between CCC and returns isn't monotonic in Canada. You don't get a clean "shorter cycle = better return" gradient. The real story is that very long CCC companies (>90 days) underperform, while everything under 90 days clusters together.
Canadian dollar effects. All returns are in CAD benchmarked against USD SPY. CAD/USD moves add noise. When the Canadian dollar strengthens (often during commodity booms), Canadian stocks look better in USD terms, and this isn't captured in the CCC signal itself.
Run It Yourself
Screen: Low CCC Canadian Stocks
SELECT k.symbol, p.companyName,
    k.cashConversionCycleTTM AS ccc_days,
    k.daysOfSalesOutstandingTTM AS dso,
    k.daysOfInventoryOutstandingTTM AS dio,
    k.daysOfPayablesOutstandingTTM AS dpo,
    k.marketCap / 1e9 AS market_cap_b
FROM key_metrics_ttm k
JOIN profile p ON k.symbol = p.symbol
WHERE k.cashConversionCycleTTM < 30
  AND k.marketCap > 500000000
  AND p.sector NOT IN ('Financial Services')
  AND p.exchange = 'TSX'
ORDER BY k.cashConversionCycleTTM ASC
LIMIT 50
Run it: cetaresearch.com/data-explorer?q=7BdH5pW-Z1
Advanced Screen: Low CCC + Operating Margin
SELECT k.symbol, p.companyName,
    k.cashConversionCycleTTM AS ccc_days,
    f.operatingProfitMarginTTM * 100 AS op_margin_pct,
    k.marketCap / 1e9 AS market_cap_b
FROM key_metrics_ttm k
JOIN financial_ratios_ttm f ON k.symbol = f.symbol
JOIN profile p ON k.symbol = p.symbol
WHERE k.cashConversionCycleTTM < 30
  AND f.operatingProfitMarginTTM > 0.10
  AND k.marketCap > 500000000
  AND p.sector NOT IN ('Financial Services')
  AND p.exchange = 'TSX'
ORDER BY k.cashConversionCycleTTM ASC
LIMIT 30
Run it: cetaresearch.com/data-explorer?q=OrGmtOsJIk
Adding the margin filter is particularly useful in Canada. It separates well-managed resource companies (high margins + short CCC) from low-margin distributors that happen to have fast inventory turns.
Limitations
Resource sector concentration. The TSX is heavily weighted toward energy and materials. CCC results on Canadian stocks are partly a story about resource company operations, not a universal working capital signal.
Small high-CCC group. 41 stocks on average. Results are noisier than the low-CCC basket (115 stocks). The +3.2% spread is directionally correct but imprecise.
Currency benchmark. CAD returns versus USD SPY. Canadian investors see the full CAD return. International investors face currency conversion. CAD tends to strengthen during commodity booms, which could inflate Canadian equity returns in USD terms during exactly the periods when high-CCC resource companies outperform.
Doesn't generalize. Canada's result is the best among developed markets, but it reflects the TSX's specific sector structure. You can't take this result and apply it to the S&P 500. The US data (same methodology) shows a -0.6% spread.
Takeaway
Canada is one of the strongest results for CCC across 14 exchanges, with a +3.4% spread, 0.251 Sharpe, and +3.7% excess over the TSX Composite. The signal works here because the TSX's resource-heavy structure creates meaningful variation in working capital efficiency within sectors. Low-CCC companies on the TSX tend to be operationally superior resource and industrial firms.
For Canadian investors building a TSX-focused portfolio, CCC is a useful quality filter. For global investors, the 7.8% CAGR is competitive but the small-cap premium and sector concentration mean the result is specific to Canada's market structure.
References
- Richards, V.D. and Laughlin, E.J. (1980). A Cash Conversion Cycle Approach to Liquidity Analysis. Financial Management.
- Shin, H.H. and Soenen, L. (1998). Efficiency of Working Capital Management and Corporate Profitability. Financial Practice and Education.
- Deloof, M. (2003). Does Working Capital Management Affect Profitability of Belgian Firms? Journal of Business Finance & Accounting.
Data: Ceta Research (FMP financial data warehouse), 2000-2025. Full methodology: github.com/ceta-research/backtests
Past performance does not guarantee future results. This is educational content, not investment advice.


