
Capital Efficiency Across Markets: A Six-Market Study
Testing capital efficiency across 6 major markets (2000-2025): India +6.96% vs Sensex, Switzerland +7.13% vs SMI, UK +8.12% vs FTSE, Germany +3.52% vs DAX, US +2.54% vs SPY, China -0.64% vs SSE. How low-capex, high-ROIC strategies travel across markets.


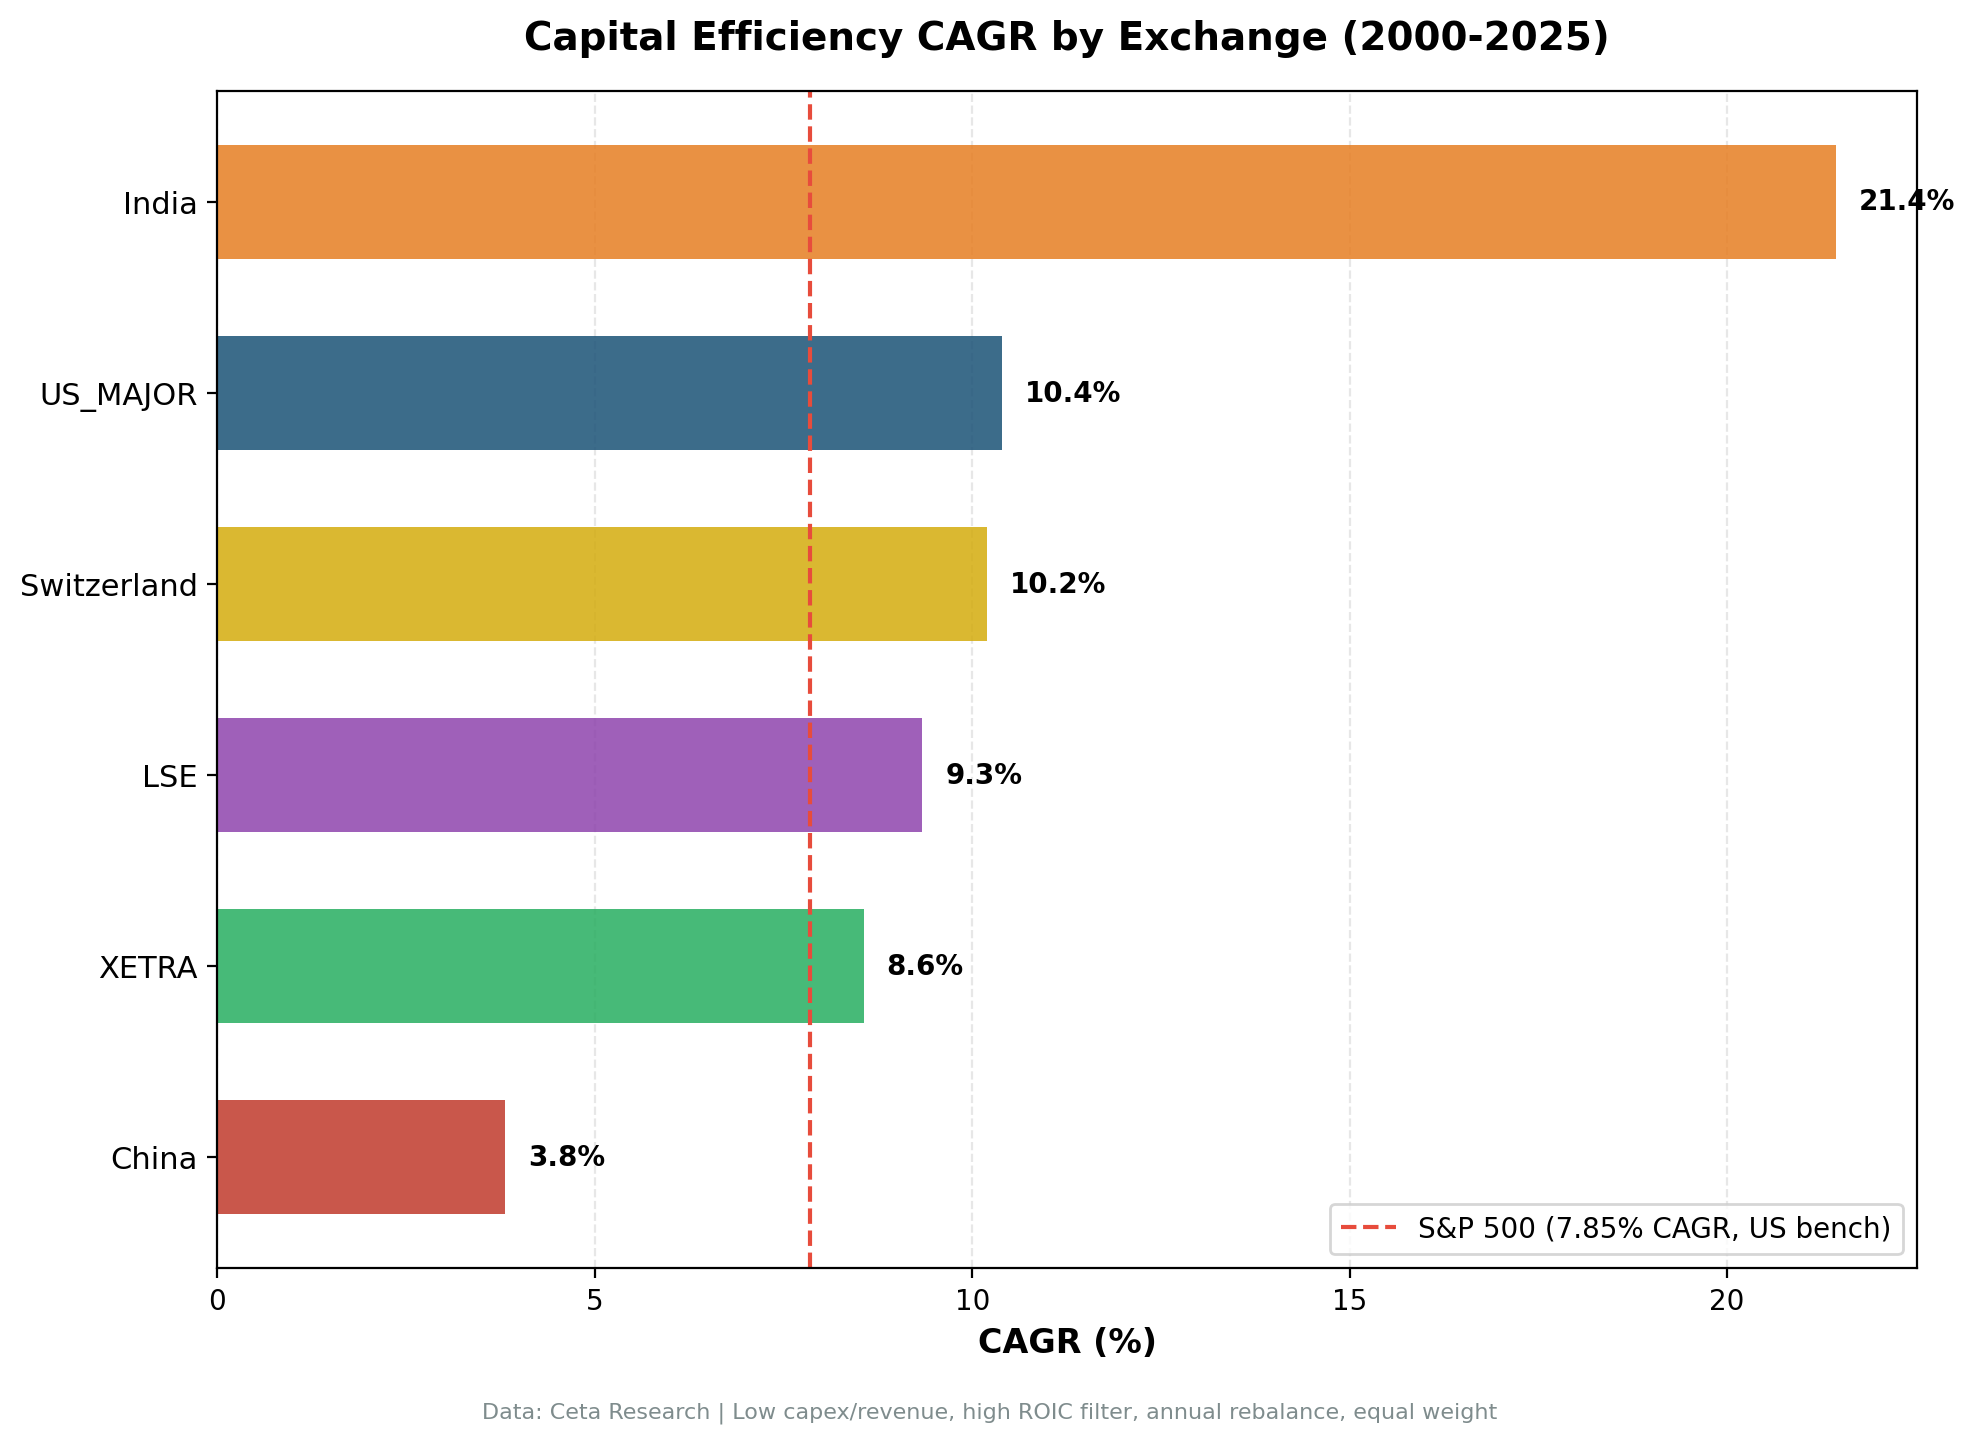
We tested the same capital efficiency strategy, low capex and high ROIC companies, across six major markets from 2000 to 2025. India delivered 21.44% CAGR (+6.96% vs Sensex). Switzerland delivered 10.20% (+7.13% vs SMI). The US delivered 10.40% (+2.54% vs SPY). The UK delivered 9.34% (+8.12% vs FTSE). Germany delivered 8.56% (+3.52% vs DAX). China delivered 3.81% (-0.64% vs SSE). Same screen, same methodology, very different outcomes. The divergence reveals how exchange composition and market structure shape factor returns.
Contents
- The Strategy
- Results Summary
- Why India Dominates Absolute Returns
- Why Switzerland Has the Highest Win Rate
- Why the UK Surprised
- Why the US Is Steady
- Why Germany Trails Despite Lower Volatility
- Why China Tracks the Index
- When Capital Efficiency Works
- When It Struggles
- Cross-Market Patterns
- Related Content
Data: FMP financial data warehouse, 2000–2025. Updated May 2026.
The Strategy
One screen, applied consistently across all six markets:
- Capex-to-Revenue < 8%: Asset-light business model
- Capex-to-Operating Cash Flow < 40%: Retains 60%+ of operating cash as free cash flow
- ROIC > 15%: Earns well above cost of capital
- Operating Margin > 15%: Pricing power
Portfolio construction: Top 30 stocks by highest ROIC, equal-weight, annual rebalancing (July), 45-day filing lag for FY data. Next-day close execution (market-on-close).
The only difference across markets: market cap thresholds adjusted for local currency (₹20B India, $1B US, £500M UK, €500M Germany, CHF 500M Switzerland, ¥2B China). Each market is benchmarked against its local index.
Results Summary
| Market | CAGR | Local Benchmark | Excess | Sharpe | Max DD | Win Rate |
|---|---|---|---|---|---|---|
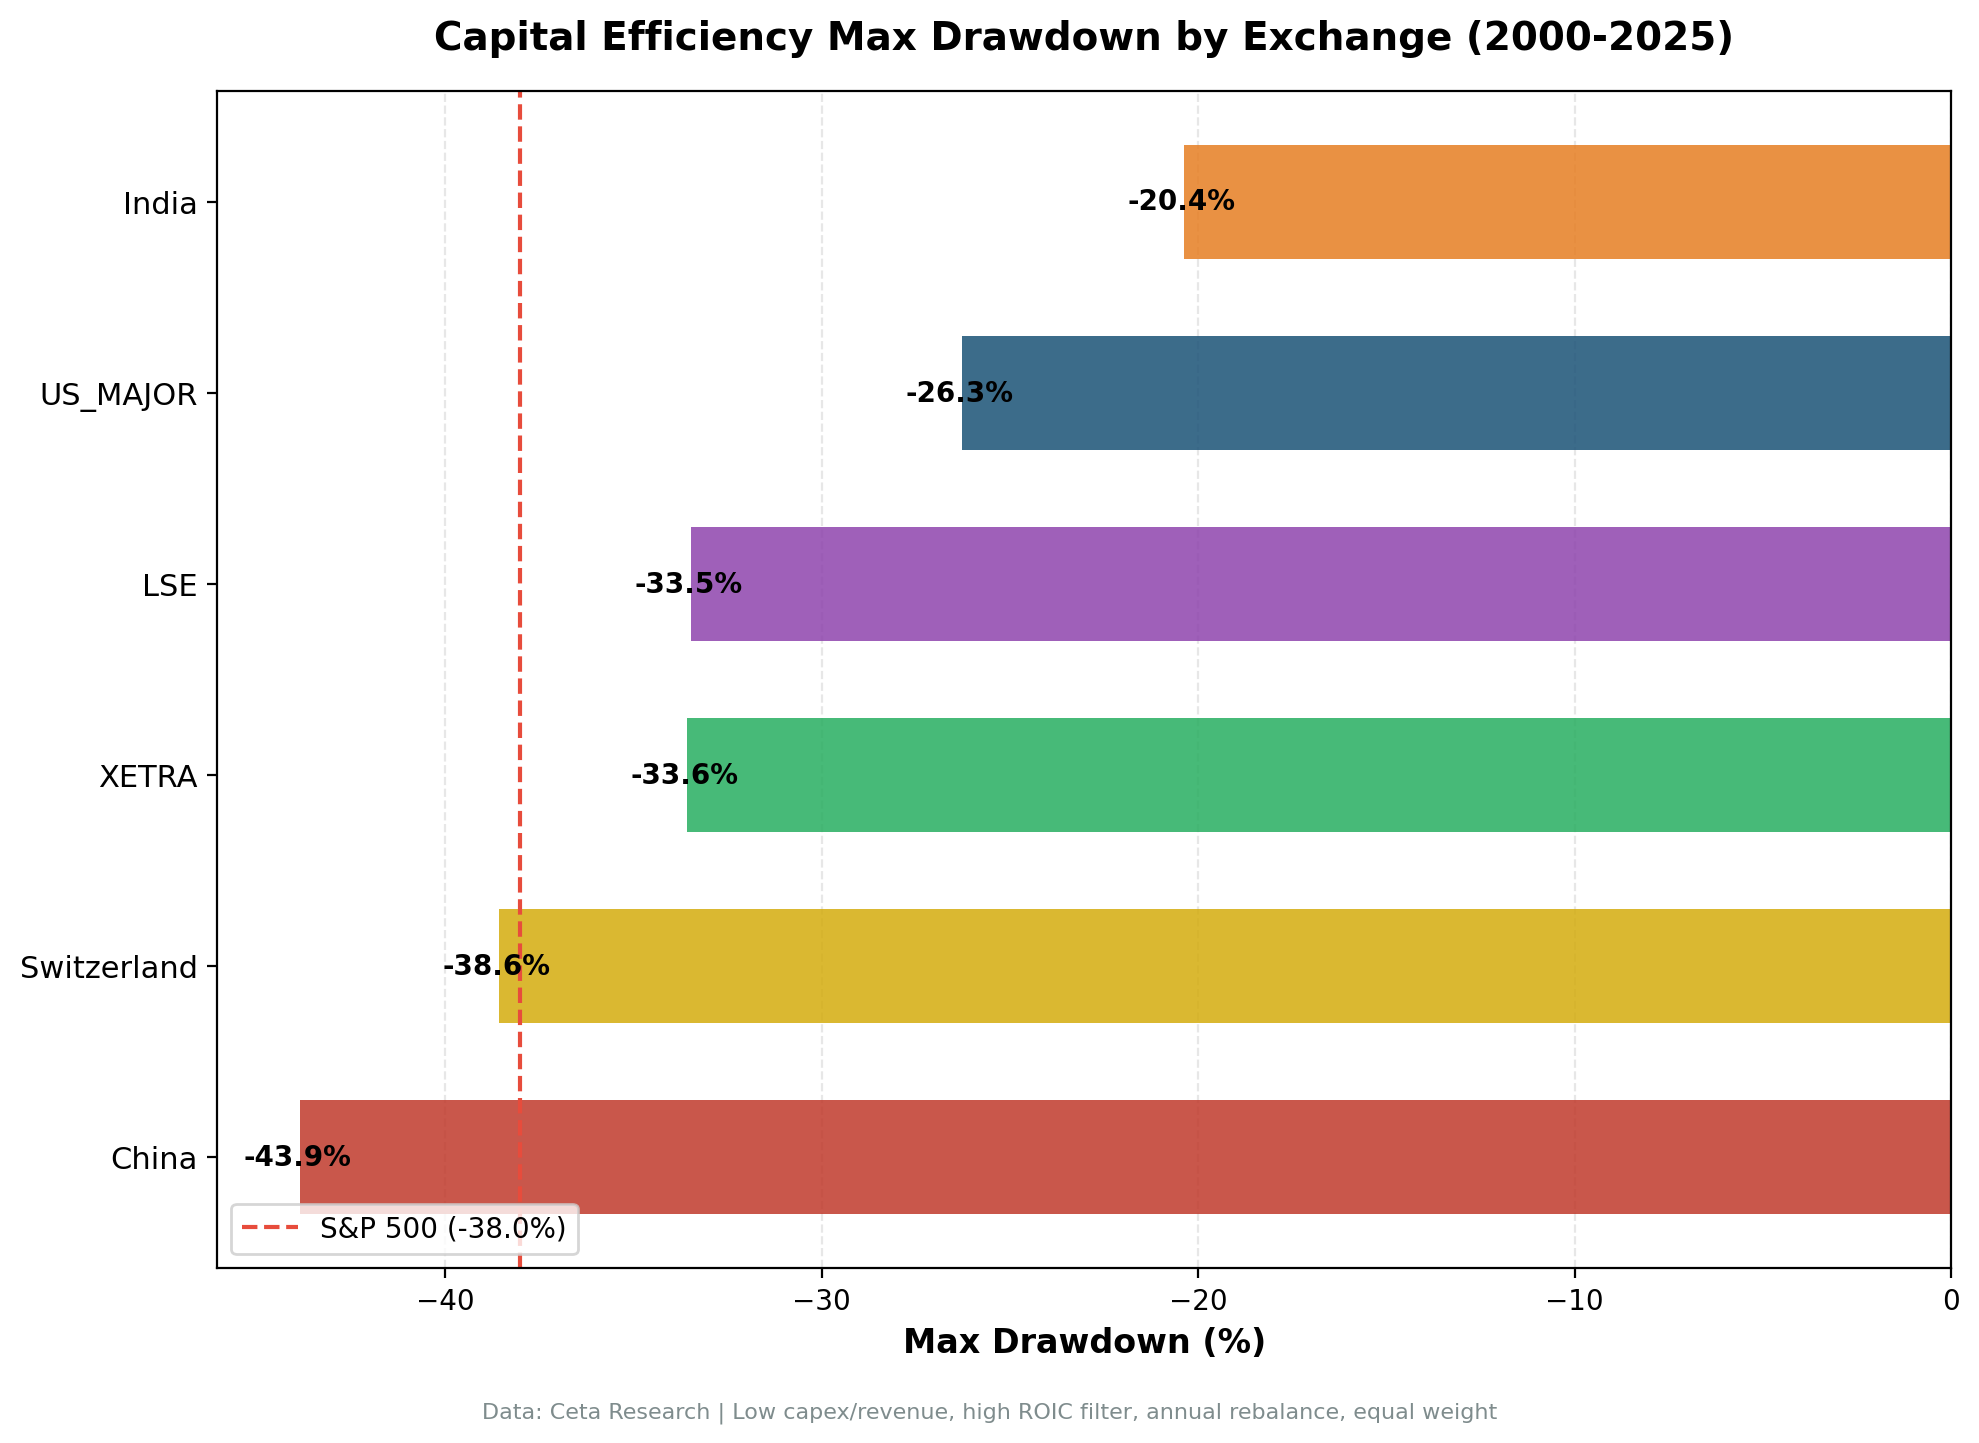
| India (NSE) | 21.44% | Sensex 14.48% | +6.96% | 0.621 | -20.37% | 71.4% |
| US (NYSE+NASDAQ+AMEX) | 10.40% | S&P 500 7.85% | +2.54% | 0.463 | -26.27% | 64.0% |
| Switzerland (SIX) | 10.20% | SMI 3.07% | +7.13% | 0.412 | -38.58% | 82.6% |
| UK (LSE) | 9.34% | FTSE 100 1.23% | +8.12% | 0.313 | -33.48% | 76.0% |
| Germany (XETRA) | 8.56% | DAX 5.04% | +3.52% | 0.451 | -33.59% | 56.0% |
| China (SHZ+SHH) | 3.81% | SSE Comp 4.45% | -0.64% | 0.046 | -43.86% | 45.0% |
Why India Dominates Absolute Returns
Growth economy plus market efficiency. India's 6-7% annual GDP growth over the backtest period created secular tailwinds for capital-light businesses. Services, IT, pharma, financials captured market share without needing heavy infrastructure investment. Even against the Sensex (itself a strong 14.48% CAGR), the strategy added 6.96% per year.
Deep qualifying universe. NSE produced enough qualifying stocks to maintain full portfolios (20 stocks average across invested periods) from 2004 onward. The exchange lists many mid-cap services and IT companies that naturally fit the capital-efficiency profile.
Strong risk-adjusted returns. 0.621 Sharpe, second only to Switzerland's headline metric. The -20.37% max drawdown sits in 2007-08, and the portfolio recovered within two years.
Why Switzerland Has the Highest Win Rate
Swiss quality concentrates here. The screen naturally selects the Roches, Nestles, Sikas, and Givaudans of the SIX exchange: specialty chemicals, pharma, niche industrials, premium consumer brands. These businesses combine global market share with disciplined capex.
SMI weakness amplifies alpha. The SMI returned only 3.07% CAGR over 25 years, dragged by financial-sector heavyweights (UBS, Credit Suisse pre-collapse) and currency strength. The capex efficiency screen excluded most of that drag.
82.6% win rate. Highest of any market tested. 19 of 23 invested years beat the SMI. The edge is unusually consistent year by year.
Why the UK Surprised
Widest excess vs local benchmark. The UK delivered +8.12% excess CAGR vs FTSE 100, the largest margin among the six markets. The FTSE 100 itself had a paltry 1.23% CAGR over 25 years. Capital-efficient UK companies escaped the index's drag from banks, energy, and mining.
Full 25-period coverage. All 25 annual periods were invested. The 76% win rate (19 out of 25 years) is the second-highest after Switzerland.
Sector composition. The screen naturally selected UK software, healthcare, financial services, and specialized industrials while excluding the FTSE's heavy oil, mining, and banking constituents. That sector tilt was particularly valuable as the UK index underperformed.
Why the US Is Steady
Market efficiency in profitability. The US market prices ROIC reasonably well. Companies earning 15%+ returns on invested capital trade at premium multiples. But it underprices the persistence of those returns when capex requirements are low. A software company earning 20% ROIC with 3% capex intensity maintains that edge longer than a manufacturer with 25% capex intensity.
Broad universe. NYSE+NASDAQ+AMEX produced full portfolios (23 stocks on average) for all 25 periods. Diversification smoothed volatility. The 64% win rate is the lowest among positive-alpha markets, but the excess CAGR (+2.54%) compounds meaningfully over decades.
Why Germany Trails Despite Lower Volatility
DAX underperformance gives the screen room. The DAX delivered only 5.04% CAGR over 25 years, dragged down by heavy cyclicals, banks, and auto manufacturers. The capex efficiency screen avoided these sectors, producing +3.52% excess CAGR.
Lower volatility than the benchmark. The strategy (14.54% vol) was meaningfully less volatile than the DAX (21.11% vol). The quality filter excluded the most volatile DAX constituents.
Even win rate. 56.0% (14 of 25 years) is the weakest hit rate among markets that produced positive excess. Annual alpha is choppier in Germany than elsewhere, with bigger swing years like +24% (2011) and -17% (2024).
Why China Tracks the Index
China delivered 3.81% CAGR with -0.64% excess vs the SSE Composite. The strategy didn't beat the local index, but it also wasn't catastrophic the way an earlier version of this analysis (with same-day-close execution and no data-quality guards) suggested. With proper bias controls, the picture is more nuanced:
The strategy roughly matches the SSE. -0.64% annual excess is essentially flat. The capex efficiency factor doesn't generate alpha in China, but it doesn't destroy it either.
Lower volatility, similar drawdown. Strategy vol of 28.73% beats SSE's 37.75%. Max drawdown -43.86% vs SSE -47.70%. The quality filter does protect capital somewhat, even if it doesn't generate excess return.
Sharpe converges with the index. Strategy Sharpe 0.046 vs SSE 0.052. The risk-adjusted profile is nearly identical. Whatever signal capex efficiency carries in market economies, China's market structure neutralizes it.
Likely explanations: State-owned enterprises dominate large-cap Chinese stocks. Their capital allocation follows policy directives (employment, regional development) rather than market efficiency. ROIC numbers can also be distorted by subsidies, preferential loan terms, or related-party transactions. Markets don't price these distortions consistently, so the efficiency premium fails to materialize. The screen identifies the same kinds of businesses it does elsewhere, but they don't outperform.
When Capital Efficiency Works
Market economies with strong corporate governance. India, US, UK, Germany, Switzerland all reward profitability and cash generation. Companies that earn strong returns without needing constant reinvestment trade at premium multiples. Investors trust that management will deploy excess cash rationally.
Growth economies with rising consumption. India's results (21.44% CAGR, +6.96% vs Sensex) show that capital efficiency works even better in high-growth settings. Services and software businesses capture market share without building factories. The secular tailwind amplifies the efficiency premium.
Indexes weighted toward capital-intensive sectors. The strategy generated the widest excess in markets where the local benchmark was dragged down by capital-heavy industries: UK (oil, banks, mining), Switzerland (financials), Germany (autos, banks). When the index is weak in the sectors the screen excludes, alpha widens.
Post-crisis recoveries. After credit shocks (2008-2009, 2020), capital-light businesses recover faster. They don't need external financing to restart operations. Cash flow resumes immediately. This pattern held across India, US, UK, Germany, and Switzerland.
When It Struggles
State-directed capital allocation. China's results (3.81% CAGR, -0.64% vs SSE) show that the efficiency factor flattens to near-zero when capital allocation follows political objectives rather than market signals. The screen still identifies low-capex, high-ROIC businesses, but those metrics don't predict relative returns when the market doesn't price efficiency consistently.
Commodity super-cycles. Energy and mining companies generate massive cash flows during commodity booms despite heavy capex. The screen systematically excludes them. During extended commodity run-ups (2003-2008 oil, 2020-2022 commodities), capital-intensive sectors outperform globally.
Early-cycle capex booms. When central banks cut rates aggressively or fiscal stimulus hits, capital-intensive cyclicals snap back hard. The screen misses these rebounds across all markets.
Cross-Market Patterns
Five of six markets delivered positive alpha. India (+6.96% vs Sensex), Switzerland (+7.13% vs SMI), US (+2.54% vs SPY), UK (+8.12% vs FTSE), Germany (+3.52% vs DAX). China (-0.64% vs SSE) is the only market where the strategy didn't add value, and it's a marginal underperformance rather than a catastrophe.
Sharpe ratios cluster between 0.31 and 0.62. India (0.621), US (0.463), Germany (0.451), Switzerland (0.412), UK (0.313) all delivered positive risk-adjusted returns. China (0.046) is the outlier, but it's no longer negative.
Win rates range from 56% to 83%. Switzerland (82.6%), UK (76.0%), India (71.4%), US (64.0%), Germany (56.0%) all beat local benchmarks in more than half of years. China (45.0%) lost in slightly more years than it won, which is in line with its near-zero excess.
Drawdowns vs benchmarks tell a consistent story. In the US, Germany, UK, and Switzerland the strategy had lower drawdowns than the benchmark. India's drawdown was deeper than the Sensex (-20.4% vs -10.0%) but the absolute level is still moderate. China's drawdown was slightly better than the SSE.
Related Content
Read the detailed regional analyses:
- Capital Efficiency in India: 21.44% CAGR from Low-Capex Stocks
- Capital Efficiency Switzerland: 10.20% CAGR, +7.13% vs SMI
- Capital Efficiency UK: 9.34% CAGR, +8.12% vs FTSE 100
- Capital Efficiency US: How Asset-Light Businesses Beat the S&P 500
- Capital Efficiency Germany: 8.56% CAGR, +3.52% vs DAX
Data: Ceta Research (FMP financial data warehouse), 2000-2025. Backtest code: github.com/ceta-research/backtests. Full methodology: METHODOLOGY.md.
Past performance does not guarantee future results. This is educational content, not investment advice.


