backtests
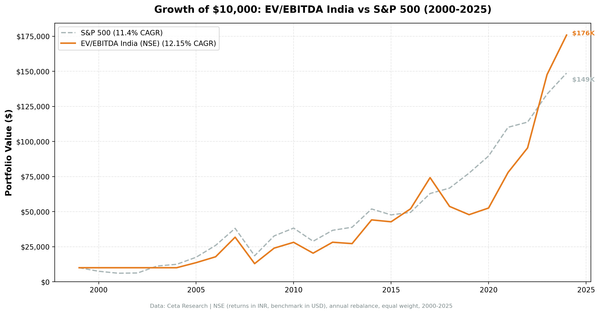
EV/EBITDA Below 10x on Indian Equities: 25-Year Backtest (NSE)
EV/EBITDA below 10x on NSE equities: 12.15% CAGR over 20 invested years vs 11.40% for the Sensex. A modest edge with lower beta.

Building CetaResearch. Data analysis for policy, research, and startups.

backtests
EV/EBITDA below 10x on NSE equities: 12.15% CAGR over 20 invested years vs 11.40% for the Sensex. A modest edge with lower beta.
backtests
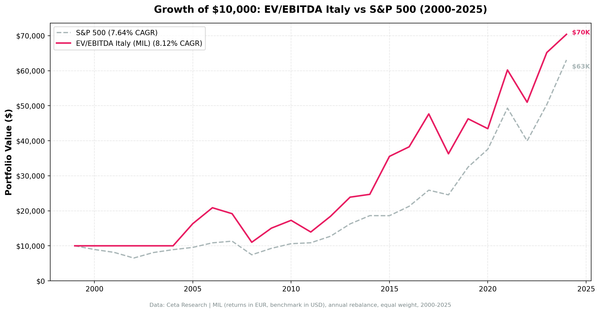
EV/EBITDA screen on Borsa Italiana returned 6.03% CAGR over 25 years, trailing SPY's 7.64%. Thin universe and six cash years. The strategy doesn't justify the complexity over a simple index fund.
backtests
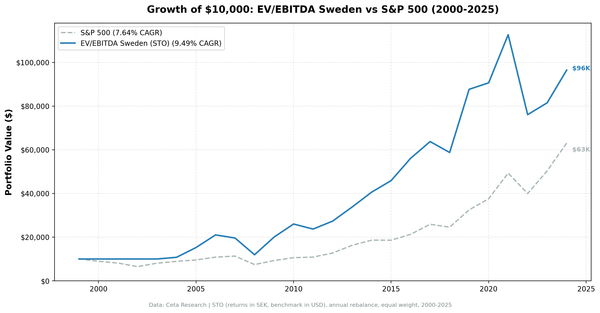
A simple EV/EBITDA screen on Stockholm-listed stocks returned 9.74% CAGR over 25 years vs OMX Stockholm 30's 2.95%. The strategy outperformed in 76% of years, with 134.5% up capture and only 50.7% down capture against the local index.
backtests
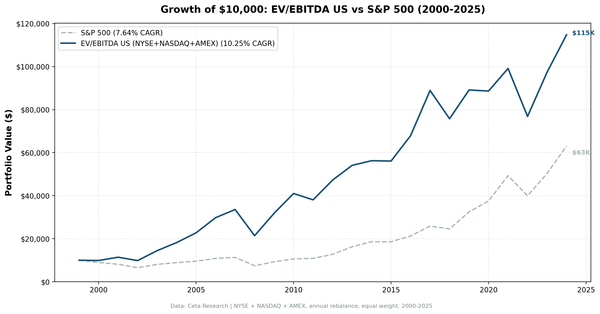
EV/EBITDA below 10x is how private equity prices acquisitions. We tested it as an equity screen on 22,000+ US stocks over 25 years.
value-investing
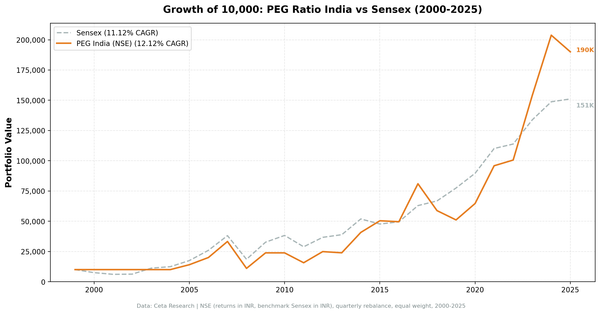
PEG ratio on India's NSE: 12.12% CAGR over 25 years, +0.99%/yr vs the Sensex. The ride was violent, -67% in 2008, +116% in 2009. Here's the full data.
value-investing
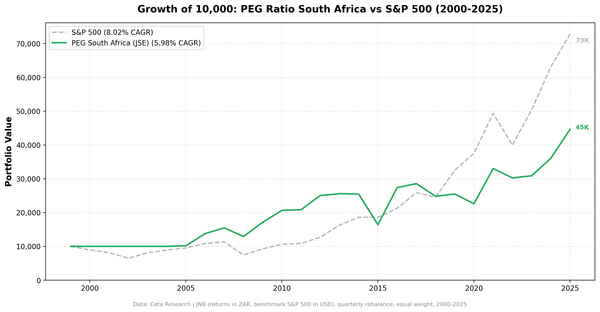
South Africa's JSE delivered 5.98% CAGR over 25 years with strong downside protection. Beta 0.574, down capture 42.2%, -16.5% in 2008 vs S&P 500's -34.3%. Trails SPY on returns but adds real diversification value.
value-investing
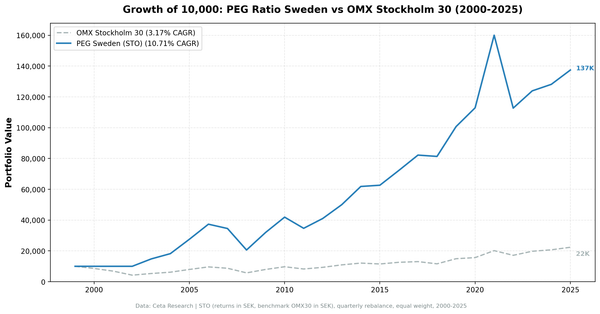
Stockholm Exchange delivered 10.71% CAGR over 25 years, +7.54%/yr vs OMX Stockholm 30. Sharpe ratio of 0.437 is 7x the benchmark's 0.060.
value-investing
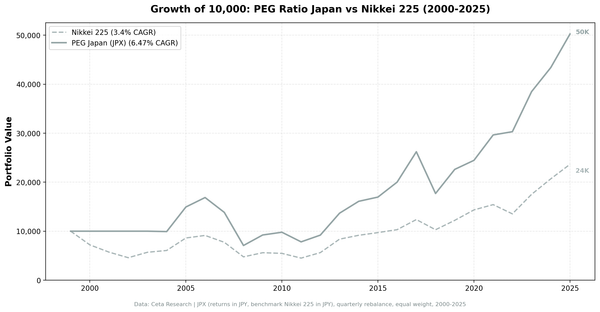
Japan delivered 6.47% CAGR over 25 years, +3.07%/yr vs the Nikkei 225. Sharpe 0.284 vs benchmark 0.066. Up capture 99.7%, down capture 76.1%. The strategy beat the index in 16 of 26 years.
earnings
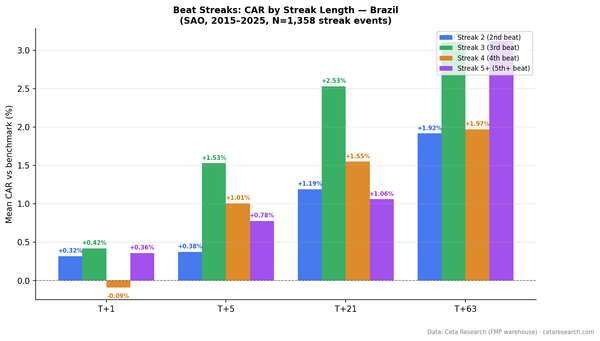
Brazilian beat streaks show back-loaded returns. The day-1 reaction is weak (+0.30%) but the drift builds to +2.49% by day 63. Streak 3 and streak 5+ both reach +3.1% at T+63. 1,358 events from 2015-2025 on B3.
earnings
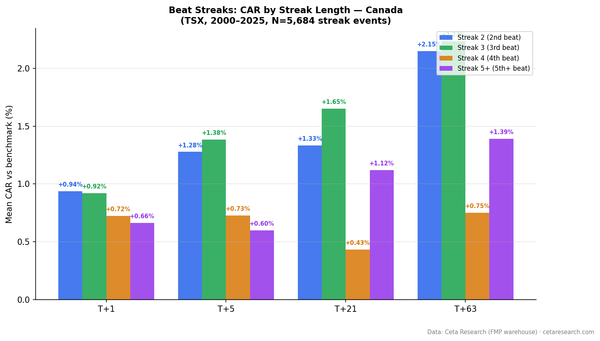
Canadian beat streaks produce twice the abnormal return of US stocks. 5,684 events on the TSX from 2000-2025. T+21 CAR of +1.22% vs +0.55% for US. The drift keeps building to +1.76% at T+63.
earnings
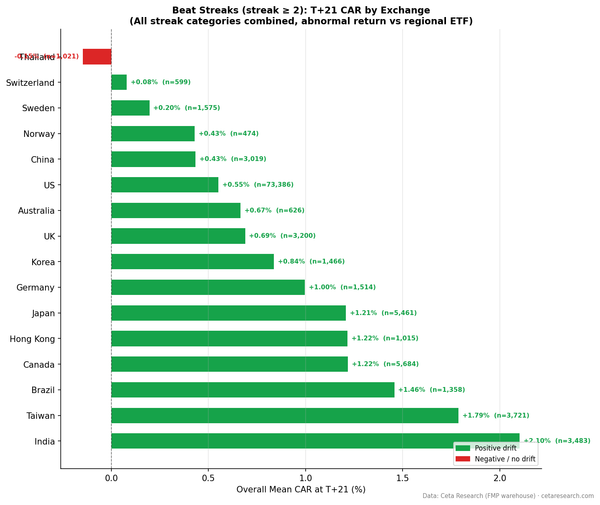
We tested earnings beat streaks across 16 exchanges covering 102,577 streak events. 12 of 16 exchanges show positive T+21 CAR. India leads at +2.10% T+21 but with recent data caveat. Thailand shows negative drift. The immediate T+1 reaction is positive on every exchange tested.
earnings
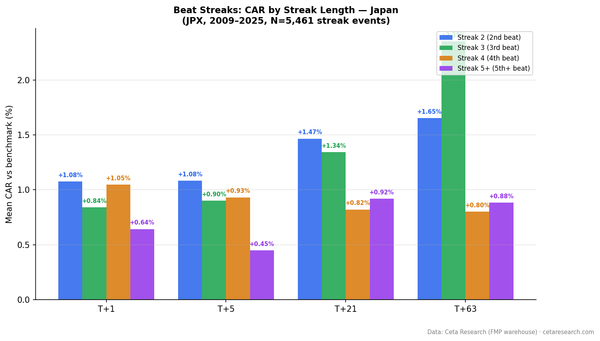
Japan shows the highest T+1 abnormal return of any exchange globally. 5,461 events on JPX from 2009-2025. Streak 3 reaches +2.35% at T+63. The pattern is consistent with Japan's concentrated analyst coverage and slower information diffusion.