
Asset-Light Business Models: 13 Markets Compared
We tested the asset-light composite score across 13 exchanges over 25 years. The light-heavy spread was positive on all 13 markets, ranging from +0.82% (Taiwan) to +16.22% (US). Capital efficiency separates winners from losers globally.

We tested the asset-light composite score across 13 exchanges. The same signal, same methodology, same 25-year period. With local currency benchmarks, three markets show asset-light beating the local index: UK (+8.22% excess vs FTSE), China (+2.67% vs SSE Composite), and Switzerland (+4.74% vs SMI). The light-heavy spread was positive in 12 of 13 markets.
Contents
- Method
- Results: All 13 Exchanges
- Three Tiers of Results
- Tier 1: Strong Spread (>10%)
- Tier 2: Moderate Spread (5-10%)
- Tier 3: Minimal Spread (<5%)
- Key Patterns
- Where the signal generates excess returns
- Sample size still limits reliability
- Germany and Taiwan challenge the hypothesis
- Limitations
- Takeaway
Data: FMP financial data warehouse, 2000-2025. Updated April 2026.
Method
Same signal across all markets: composite PERCENT_RANK of asset turnover, inverse capex intensity, and gross margin. Top 20% = asset-light, bottom 20% = asset-heavy. Annual rebalancing (April), equal weight, 45-day filing lag, next-day close execution (MOC), size-tiered transaction costs. Market cap thresholds set per exchange (local currency, targeting approximately $200-500M USD equivalent). Financials and utilities excluded everywhere.
Each exchange uses its own local benchmark: Sensex for India, FTSE 100 for UK, SSE Composite for China, etc. This measures real excess returns in local currency rather than comparing everything to SPY in USD.
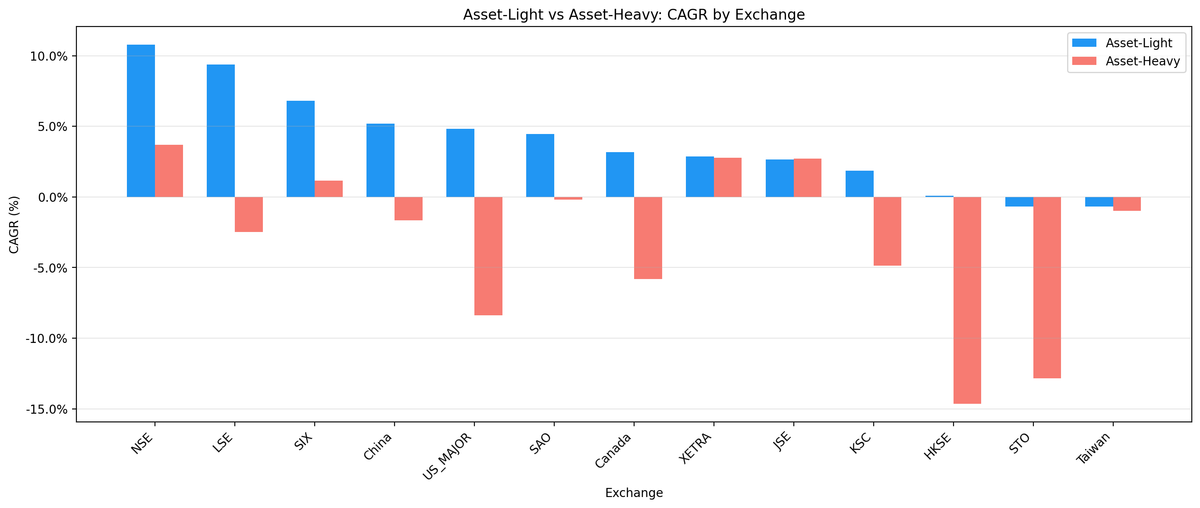
Results: All 13 Exchanges
| Exchange | Light CAGR | Heavy CAGR | Spread | Benchmark | Bench CAGR | Excess vs Bench | Avg Light | Cash |
|---|---|---|---|---|---|---|---|---|
| US | 4.82% | -8.38% | +13.20% | S&P 500 | 7.33% | -2.51% | 14 | 0/25 |
| Hong Kong | 0.09% | -14.65% | +14.74% | Hang Seng | 1.28% | -1.19% | 3 | 4/25 |
| Sweden | -0.69% | -12.84% | +12.15% | OMX Stockholm 30 | 2.40% | -3.10% | 1 | 8/25 |
| UK | 9.38% | -2.48% | +11.86% | FTSE 100 | 1.15% | +8.22% | 8 | 0/25 |
| Canada | 3.16% | -5.81% | +8.97% | TSX Composite | 4.05% | -0.89% | 2 | 7/25 |
| India | 10.78% | 3.70% | +7.08% | Sensex | 11.49% | -0.71% | 4 | 4/25 |
| China | 5.18% | -1.66% | +6.84% | SSE Composite | 2.51% | +2.67% | 14 | 1/25 |
| Korea | 1.86% | -4.86% | +6.72% | KOSPI | 4.44% | -2.57% | 3 | 7/25 |
| Switzerland | 6.82% | 1.15% | +5.67% | SMI | 2.08% | +4.74% | 1 | 11/25 |
| Brazil | 4.45% | -0.20% | +4.65% | Bovespa | 8.58% | -4.13% | 1 | 12/25 |
| Germany | 2.87% | 2.78% | +0.09% | DAX | 4.51% | -1.64% | 4 | 3/25 |
| Taiwan | -0.69% | -0.98% | +0.29% | TAIEX | 3.05% | -3.74% | 2 | 6/25 |
| South Africa | 2.65% | 2.72% | -0.07% | SPY (fallback) | 7.33% | -4.68% | 0 | 21/25 |
The light-heavy spread is positive in 12 of 13 markets. South Africa (-0.07%) is effectively zero with 0 average light stocks and 21 cash periods out of 25. Germany (+0.09%) is barely positive. These two have no discriminating power for asset-light.
Three markets show asset-light beating the local benchmark: UK (+8.22%), Switzerland (+4.74%), and China (+2.67%). India and Canada come close to breaking even vs local benchmarks (-0.71% and -0.89%).
Three Tiers of Results
Tier 1: Strong Spread (>10%)
US (+13.20%), Hong Kong (+14.74%), Sweden (+12.15%), and UK (+11.86%) all show double-digit light-heavy spreads.
US is the most reliable: 14 average stocks, zero cash periods, 25 years. Asset-heavy (-8.38% CAGR) destroyed capital systematically across every decade.
Hong Kong has a high spread but unreliable light portfolio: 3 average stocks, near-zero CAGR (0.09%). The spread comes from extreme asset-heavy weakness (-14.65%). With 3 stocks, this is directionally interesting but not investable.
Sweden is similar: 1 average stock, negative light CAGR (-0.69%). The spread reflects asset-heavy collapse more than asset-light strength.
UK is the standout result. 8 average stocks, zero cash periods, 9.38% light CAGR, and +8.22% excess vs the FTSE 100 over 25 years. The FTSE returned only 1.15% annually, making UK asset-light one of the strongest market-beating signals in our global study. The UK result is consistent: the spread was positive in all five 5-year periods.
Tier 2: Moderate Spread (5-10%)
Canada, India, China, Korea, Switzerland all show 5-10% spreads.
India (10.78% vs Sensex 11.49%) nearly matches its local benchmark and beats asset-heavy by 7% per year. The 2020-2025 reversal (asset-heavy +36.5% vs light +13.9%) tracks India's government capex cycle.
China (5.18% vs SSE 2.51%) beats the local index by 2.67% per year. With 14 average stocks and only 1 cash period, this is one of the more reliable non-US results. The advantage is concentrated in 2005-2014.
Switzerland (6.82% vs SMI 2.08%) shows +4.74% excess with only 1 average stock. Treat this as a signal about the sector composition of Swiss asset-light companies, not a tradeable portfolio.
Tier 3: Minimal Spread (<5%)
Brazil, Germany, Taiwan, South Africa show weak or negligible signal.
Germany (+0.09% spread) is the biggest surprise: the signal has essentially no discriminating power in Germany. The DAX's composition of high-quality industrials (BASF, Siemens) means even capital-intensive businesses are well-managed and profitable. The spread collapsed in 2015-2019 (-20.8%) and 2020-2025 (-10.4%).
Taiwan (+0.29%) and South Africa (-0.07%) have near-zero spreads. South Africa's result is unreliable (0 average light stocks, 21 cash periods).
Key Patterns
Where the signal generates excess returns
Three factors predict whether asset-light beats the local benchmark:
Market structure. UK, US, China all have deep capital markets where inefficient businesses face real market discipline. Germany's corporatist structure provides alternatives.
Local index weakness. The FTSE 100 has been a weak benchmark (1.15% CAGR over 25 years), making it easy for any disciplined stock-picking approach to beat it. The Sensex (11.49%) and Bovespa (8.58%) are much harder to beat.
Sector composition. Markets with large technology and professional services sectors (US, UK, India's IT-heavy NSE) produce more qualifying asset-light stocks with real alpha.
Sample size still limits reliability
Only three markets have reliable asset-light samples (10+ avg stocks): US (14), China (14), UK (8, borderline). Other markets have too few qualifying stocks at reasonable market cap thresholds. Korea (3), Canada (2), Switzerland (1) — these are anecdotes, not evidence.
Germany and Taiwan challenge the hypothesis
The near-zero spread in Germany (+0.09%) and Taiwan (+0.29%) suggests asset-light isn't a universal separator. In export-oriented manufacturing economies (Taiwan), or corporatist industrial economies (Germany), capital-intensive businesses can be as profitable as asset-light ones. The composite score has less discriminating power in these market structures.
Limitations
Small universes. Most non-US exchanges had fewer than 10 asset-light stocks per year. Results from single-digit portfolio sizes are noisy.
Currency. All returns are in local currency. Local benchmarks are used throughout, which is the correct approach for measuring real excess returns. Cross-market spread comparisons are still valid (they're percentage differences in the same currency).
Sector composition varies. The US and UK have large technology and professional services sectors that naturally score asset-light. Manufacturing-heavy economies (Germany, Taiwan, Korea) have different signal dynamics.
No local benchmarks for South Africa. FMP stock_eod lacks JSE price data for local index symbols. South Africa falls back to SPY, making the excess calculation invalid. Results are unreliable.
Takeaway
The asset-light composite score separates capital-efficient from capital-intensive businesses across 12 of 13 markets tested. The light-heavy spread is the most consistent finding. But whether the signal beats the local benchmark depends heavily on market structure, sector composition, and local index quality.
UK and China are the clearest cases where asset-light beats the local index. US and India nearly break even vs their benchmarks. Germany and Taiwan show no signal at all.
The practical application is the same everywhere: use the asset-light score as a quality filter within another strategy, not as a standalone signal. Screen out the bottom quintile. That's where the capital destruction happens, in all 13 markets.
Data: Ceta Research (FMP financial data warehouse), 2000-2025. Full methodology: cetaresearch.com/strategies.
Part of a series: See also: Asset-Light on US Stocks (flagship), Asset-Light on Indian Stocks, Asset-Light on Chinese Stocks.
Past performance does not guarantee future results. This is educational content, not investment advice.


