
Asset-Light Business Models on Chinese Stocks: 25 Years of Data
We tested the asset-light composite score on Chinese A-shares (SHH + SHZ) over 25 years. Asset-light returned 3.17% vs -1.29% for asset-heavy: a 4.46% spread. SOE dynamics and the 2021 tech crackdown complicate the picture.

We tested the asset-light composite score on Chinese stocks (Shanghai + Shenzhen). Over 25 years, asset-light companies returned 5.18% annually. The SSE Composite returned 2.51%. Asset-heavy companies returned -1.66%. The 6.84% light-heavy spread confirms that capital efficiency separates winners from losers even in China's state-influenced market, and asset-light beats the local index by 2.67% per year.
Contents
Data: FMP financial data warehouse, 2000-2025. Updated April 2026.
Method
| Parameter | Value |
|---|---|
| Universe | SHH + SHZ, market cap > 2B CNY (~$276M USD), ex-financials/utilities |
| Period | 2000-2025 (25 years) |
| Signal | Composite: PERCENT_RANK(asset turnover) + PERCENT_RANK(1/capex intensity) + PERCENT_RANK(gross margin), averaged |
| Portfolios | Top quintile (>= 0.80) = Asset-Light, Bottom quintile (<= 0.20) = Asset-Heavy |
| Rebalancing | Annual (April 1) |
| Filing lag | 45 days |
| Execution | Next-day close (MOC: signal on rebalance date, execute next trading day) |
| Weighting | Equal weight |
| Transaction costs | 0.1-0.5% per trade (size-tiered) |
| Benchmark | SSE Composite (000001.SS, local currency CNY) |
What We Found
| Portfolio | CAGR | Volatility | Max DD | Sharpe |
|---|---|---|---|---|
| Asset-Light (top 20%) | 5.18% | 31.6% | -57.1% | 0.085 |
| Asset-Heavy (bottom 20%) | -1.66% | 37.0% | -75.3% | -0.107 |
| SSE Composite | 2.51% | 26.3% | -62.2% | 0.006 |
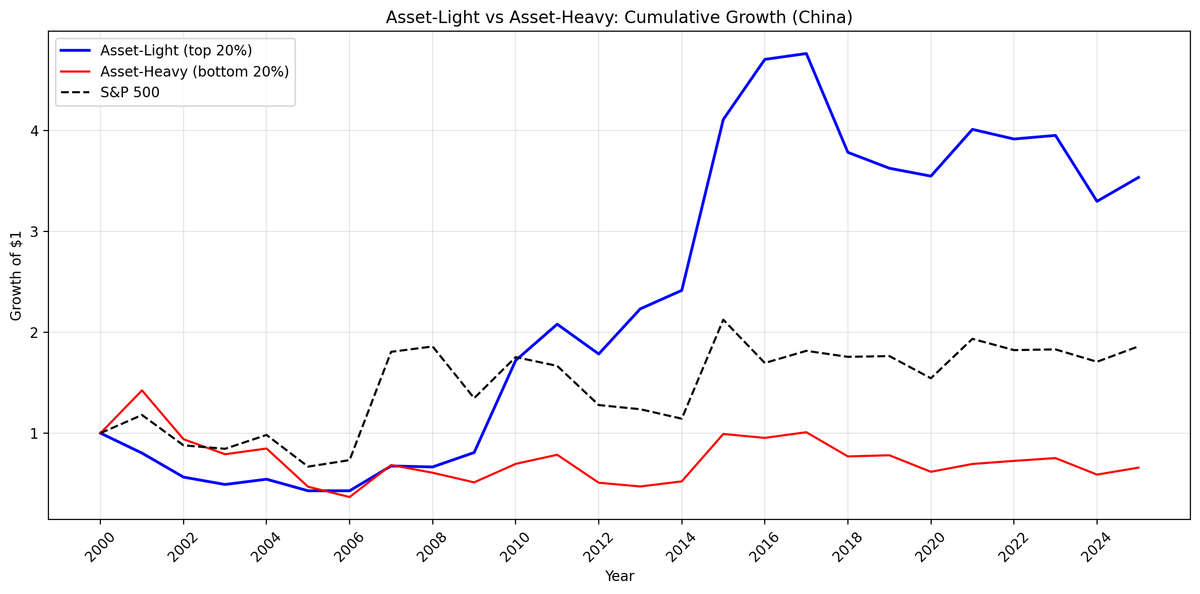
Dollar growth of $10,000 (CNY-denominated returns): - Asset-Light: $35,344 - Asset-Heavy: $6,579 - SSE Composite (reference): $18,548
China's asset-heavy companies lost 34% of capital over 25 years while asset-light companies tripled. The 2.67% annual excess vs the SSE Composite is the standout finding: the asset-light score beats the local benchmark in a market with significant state intervention.
Decade breakdown
| Period | Light | Heavy | Spread | SSE Composite |
|---|---|---|---|---|
| 2000-04 | -14.6% | -9.0% | -5.6% | -5.4% |
| 2005-09 | +38.1% | +14.7% | +23.4% | +32.4% |
| 2010-14 | +22.0% | +14.2% | +7.8% | +9.3% |
| 2015-19 | -2.2% | -8.3% | +6.0% | -5.7% |
| 2020-25 | +0.4% | +2.2% | -1.7% | +4.4% |
The spread was positive for 20 of 25 years. The 2005-2014 period was particularly strong (+23.4% and +7.8% spreads), coinciding with China's shift toward consumer and technology sectors. The recent narrowing (2020-2025: -1.7% spread) reflects China's property/infrastructure downturn pulling asset-heavy companies up as they bottomed, and regulatory pressure on asset-light tech companies.
China-specific context
China's stock market is unique. State-owned enterprises (SOEs) dominate the asset-heavy side: power companies, construction firms, steel mills. Many of these companies have implicit government backing that limits downside. On the asset-light side, private-sector tech and consumer companies face regulatory uncertainty (the 2021 tech crackdown hit asset-light companies disproportionately).
The portfolio averaged 14 asset-light stocks per year with only 2 cash periods, making this one of the better-sampled non-US markets for this strategy.
Limitations
SOE dynamics. State-owned enterprises don't operate on pure market logic. Government support can prop up capital-intensive businesses that would fail in a purely private market.
Tech crackdown. The 2021 regulatory actions disproportionately hit asset-light tech companies (education, fintech, gaming), creating a headwind not captured by fundamental metrics.
Currency. Returns are in CNY. The SSE Composite is the correct local benchmark for measuring real excess returns.
Takeaway
The asset-light signal works in China's A-share market over the full period, with a 6.84% annual spread and +2.67% excess vs the SSE Composite. It's the only non-US market in our global study where the asset-light portfolio beats the local index over 25 years. But this advantage is concentrated in 2005-2014. The post-2020 period shows near-zero excess, with policy risk cutting both ways: government support for asset-heavy SOEs and regulatory crackdowns on asset-light tech.
Data: Ceta Research (FMP financial data warehouse), 2000-2025. Full methodology: cetaresearch.com/strategies.
Part of a series: See also: Asset-Light on US Stocks (flagship), Asset-Light on Indian Stocks, Asset-Light: Global Comparison.
Past performance does not guarantee future results. This is educational content, not investment advice.


