
Altman Z-Score Backtest: Safe Stocks Lagged the S&P 500 by 1.7% Per Year
We backtested the Altman Z-Score on US stocks from 2000 to 2025. Safe-zone companies (Z > 2.99) returned 5.6% annually vs 7.3% for the S&P 500. Distress-zone stocks actually outperformed safe ones. The Z-Score predicts bankruptcy, not stock returns.

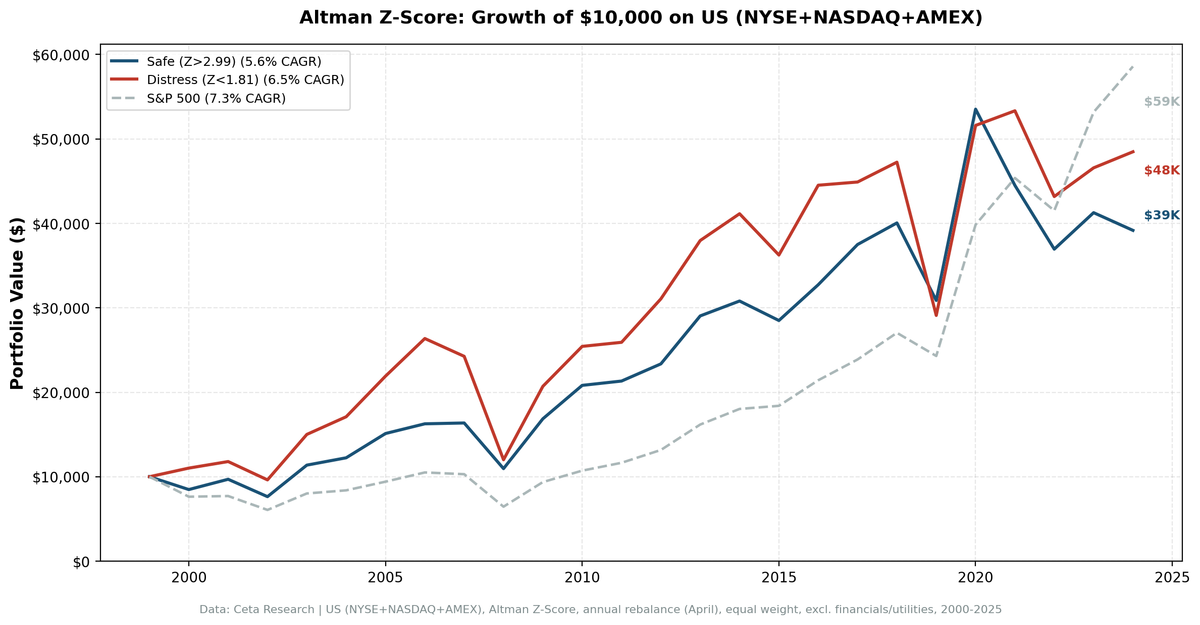
Edward Altman's bankruptcy prediction model is one of the most cited formulas in corporate finance. We tested it as a stock selection tool on US equities from 2000 to 2025. Safe-zone stocks (Z > 2.99) returned 5.6% annually, below the S&P 500's 7.3%. Distress-zone stocks actually outperformed safe ones. The Z-Score is a solid bankruptcy detector, but it doesn't translate into stock-picking alpha on US large caps.
Contents
- The Strategy
- Methodology
- Results
- 25-year summary
- The "avoidance" strategy doesn't work either
- Safe vs SPY: the full comparison
- When It Works and When It Struggles
- Decade breakdown
- The Real Story: Why the Z-Score Fails as a Stock Picker
- Run It Yourself
- Simple Z-Score Screen
- Advanced Screen: Z-Score + Quality Filters
- Limitations
- Takeaway
- References
Data: FMP financial data warehouse, 2000-2025. Updated June 2026.
The Strategy
Edward Altman published the Z-Score in 1968, training it on 66 manufacturing companies to predict bankruptcy within two years. The formula uses five accounting ratios:
Z = 1.2(WC/TA) + 1.4(RE/TA) + 3.3(EBITDA/TA) + 0.6(MktCap/TL) + 1.0(Rev/TA)
Each component captures a different dimension of financial health:
- Working Capital / Total Assets (1.2): Short-term liquidity. Can the company cover near-term obligations?
- Retained Earnings / Total Assets (1.4): Cumulative profitability. Older, profitable companies score higher.
- EBITDA / Total Assets (3.3): Operating profitability relative to the asset base. Gets the highest weight because earning power is the strongest defense against bankruptcy. Altman's original model uses EBIT here. We use EBITDA, a close and more consistently reported proxy.
- Market Cap / Total Liabilities (0.6): The market's equity valuation relative to total debt. A forward-looking solvency check.
- Revenue / Total Assets (1.0): Asset turnover. How efficiently the company generates sales.
Altman defined three zones:
| Zone | Z-Score | Interpretation |
|---|---|---|
| Safe | > 2.99 | Low bankruptcy probability |
| Gray | 1.81 to 2.99 | Uncertain, needs further analysis |
| Distress | < 1.81 | High probability of financial distress |
The original model correctly classified 95% of bankruptcies one year ahead. Subsequent validation studies over three decades confirmed 80-90% accuracy across different samples and time periods. The investment thesis, supported by Dichev (1998), is that distress risk isn't rewarded. So buying safe companies and avoiding distressed ones should generate excess returns.
We tested that thesis.
Methodology
| Parameter | Value |
|---|---|
| Universe | NYSE, NASDAQ, AMEX |
| Market cap filter | > $1B (point-in-time, 45-day lag) |
| Sector exclusions | Financial Services, Utilities |
| Signal | Z-Score computed from annual filings |
| Portfolios | Safe (Z > 2.99), Gray (1.81-2.99), Distress (Z < 1.81) |
| Weighting | Equal weight, all qualifying stocks |
| Rebalancing | Annual (April 1) |
| Transaction costs | 0.1-0.5% per trade (size-tiered) |
| Benchmark | S&P 500 (SPY) |
| Period | 2000-2025 (25 years) |
| Data source | FMP via Ceta Research warehouse |
Financial Services and Utilities are excluded because the Z-Score wasn't designed for their balance sheet structures. Banks run high leverage by design. Utilities carry regulated debt that behaves differently from corporate debt. Both produce misleading Z-Scores.
Full methodology: backtests/METHODOLOGY.md
Results
25-year summary
| Portfolio | CAGR | Total Return | Sharpe | Max Drawdown | Avg Stocks |
|---|---|---|---|---|---|
| Safe Zone (Z > 2.99) | 5.6% | 291.8% | 0.146 | -33.0% | 671 |
| Gray Zone (1.81-2.99) | 8.0% | 581.6% | 0.217 | -42.1% | 268 |
| Distress Zone (Z < 1.81) | 6.5% | 384.8% | 0.155 | -54.4% | 274 |
| All ex-Distress | 6.2% | 354.1% | 0.167 | -35.3% | 939 |
| S&P 500 (SPY) | 7.3% | 485.9% | 0.253 | -39.3% | -- |
The gray zone won. Not safe, not distressed. The companies in the middle returned 8.0% annually with a Sharpe of 0.22. They outperformed both the safe zone and the benchmark.
Safe-zone stocks, the ones the Z-Score says are the best, returned 5.6%. That's 1.7% per year behind the S&P 500 over 25 years. A Sharpe of 0.146 is barely distinguishable from noise. The only consolation: the safe zone had the shallowest drawdown at -33.0%, better than SPY's -39.3%.
The spread between safe and distress was -0.9%. Distress outperformed safe. That's the opposite of what Dichev (1998) would predict.
The "avoidance" strategy doesn't work either
Removing distress-zone stocks and holding everything else (the "all ex-distress" portfolio) returned 6.2%, trailing SPY by 1.1% per year. The avoidance signal that worked in earlier studies doesn't hold up in this universe.
Safe vs SPY: the full comparison
| Metric | Safe Zone | SPY |
|---|---|---|
| Excess CAGR | -1.7% | -- |
| Beta | 1.058 | 1.0 |
| Alpha (annualized) | -2.0% | -- |
| Up Capture | 93.1% | 100% |
| Down Capture | 105.6% | 100% |
A beta of 1.06 means the safe portfolio carried slightly more market risk than SPY. Combined with -2.0% alpha, you got more risk and less return. Up capture of 93.1% means the safe zone captured less of the upside during rallies. Down capture of 105.6% means it fell harder than SPY in downturns. The worst combination.
When It Works and When It Struggles
Decade breakdown
| Period | Safe | Distress | Spread | SPY |
|---|---|---|---|---|
| 2000-04 | 6.9% | 13.7% | -6.9% | -1.4% |
| 2005-09 | 10.5% | 12.5% | -2.0% | 5.9% |
| 2010-14 | 13.2% | 15.0% | -1.9% | 14.1% |
| 2015-19 | 1.2% | -4.3% | +5.4% | 6.6% |
| 2020-25 | 9.2% | 14.7% | -5.5% | 21.5% |
The spread was negative in four out of five periods. 2015-19 was the only window where safe outperformed distress, with a +5.4% spread. That's the period that included the 2018 volatility spike and the 2019 selloff, when financial stability mattered briefly.
2000-04. The dot-com bust should have been the Z-Score's best case. It wasn't, and it produced the widest negative spread of any half-decade at -6.9%. Distress returned 13.7% vs 6.9% for safe. The 2003 recovery was a junk rally. Beaten-down distressed companies bounced 55.9% in that single year. Safe stocks rallied too (48.9%), but distressed ones had further to bounce.
2020-25. A -5.5% gap. Post-COVID, speculative and distressed names went on a tear in 2020 (distress +77.3%, safe +73.4%). The safe zone then got hammered in 2021 (-16.9%) as rates rose and growth names sold off. SPY returned 21.5% annualized over this stretch. Neither Z-Score portfolio came close.
2015-19. The one period that fits the thesis. Safe eked out +1.2% while distress lost -4.3%, a +5.4% spread. This stretch included the 2018 rate tightening cycle and 2019's market wobble. Financial quality mattered when credit conditions tightened.
The Real Story: Why the Z-Score Fails as a Stock Picker
Three structural reasons explain the underperformance.
The safe zone is too broad and too boring. With an average of 671 stocks per year, the safe portfolio is closer to an equal-weighted index than a focused screen. You're buying every financially healthy company above $1B, which includes hundreds of mid-cap industrials and mature businesses that grow slowly. The S&P 500, market-cap weighted, concentrates in winners. Equal-weighting 671 stocks dilutes every strong performer.
Tech distortion. Asset-light technology companies score abnormally high on the Z-Score because they have low total assets relative to revenue and market cap. The formula was calibrated on 1960s manufacturers. When the safe zone loads up on tech names, the portfolio's fate is tied to tech cycles. In 2021, the safe zone dropped 16.9% as tech sold off. In 2024, it fell 5.1% while SPY rose 10.2%.
Distress-zone lottery tickets pay off more often than theory predicts. In post-crash recoveries (2003, 2009, 2020), distressed stocks snap back violently. These are high-beta names with operating leverage. When the market turns, they gain the most. A 72.4% return for distress in 2009 vs 53.9% for safe isn't an anomaly. It's the mechanical result of leverage and beta working in reverse.
The Z-Score does what Altman designed it to do: predict bankruptcy. But "not going bankrupt" and "outperforming the S&P 500" are different questions. Most safe-zone companies don't go bankrupt. They just deliver mediocre returns.
Run It Yourself
Simple Z-Score Screen
Current safe-zone stocks on Ceta Research:
SELECT s.symbol, p.companyName, s.altmanZScore,
    k.marketCap / 1e9 AS market_cap_b, p.sector
FROM scores s
JOIN key_metrics_ttm k ON s.symbol = k.symbol
JOIN profile p ON s.symbol = p.symbol
WHERE s.altmanZScore > 3.0
  AND k.marketCap > 1000000000
  AND p.exchange IN ('NYSE', 'NASDAQ', 'AMEX')
  AND p.country = 'US'
  AND COALESCE(p.sector, '') NOT IN ('Financial Services', 'Utilities')
QUALIFY ROW_NUMBER() OVER (PARTITION BY s.symbol ORDER BY k.marketCap DESC) = 1
ORDER BY k.marketCap DESC
LIMIT 50
Advanced Screen: Z-Score + Quality Filters
The Z-Score alone is too broad. Combining it with Piotroski (quality trajectory), positive ROE, and low leverage narrows to companies that are both financially safe and operationally strong:
SELECT s.symbol, p.companyName, s.altmanZScore, s.piotroskiScore,
    k.returnOnEquityTTM * 100 AS roe_pct,
    f.debtToEquityRatioTTM AS debt_to_equity,
    k.marketCap / 1e9 AS market_cap_b
FROM scores s
JOIN key_metrics_ttm k ON s.symbol = k.symbol
JOIN financial_ratios_ttm f ON s.symbol = f.symbol
JOIN profile p ON s.symbol = p.symbol
WHERE s.altmanZScore > 3.0
  AND s.piotroskiScore >= 5
  AND k.returnOnEquityTTM > 0
  AND f.debtToEquityRatioTTM < 1.5
  AND k.marketCap > 1000000000
  AND p.exchange IN ('NYSE', 'NASDAQ', 'AMEX')
  AND p.country = 'US'
  AND COALESCE(p.sector, '') NOT IN ('Financial Services', 'Utilities')
QUALIFY ROW_NUMBER() OVER (PARTITION BY s.symbol ORDER BY k.marketCap DESC) = 1
ORDER BY k.marketCap DESC
LIMIT 30
The multi-factor approach addresses the Z-Score's biggest weakness: it's a solvency screen, not a return screen. Adding Piotroski catches deteriorating fundamentals. ROE confirms profitability. The D/E cap prevents over-leveraged names from sneaking through on high revenue alone.
Limitations
Backward-looking by design. The Z-Score uses the most recent annual filing. A company can move from safe to distress within a single quarter. Enron scored above 3.0 in its 2000 annual report.
Manufacturing-era coefficients. Altman calibrated the weights on 1960s manufacturers. Asset-light businesses (SaaS, platforms, biotech) produce inflated scores that don't reflect the same underlying stability the model was built to measure.
Equal weight vs cap weight. The safe portfolio holds 671 stocks equally weighted. The S&P 500 is cap-weighted and concentrates in the largest, most profitable companies. Some of the performance gap is the weighting scheme, not the signal.
No sector adjustment. Technology dominates the safe zone. Energy and materials cluster in distress. Sector tilts drive a meaningful portion of returns in any given year.
Single-country result. This is a US-only test. The Z-Score may behave differently in markets with different sector compositions, accounting standards, and bankruptcy regimes.
Survivorship in distress. The distress portfolio's returns are upward-biased because companies that actually went bankrupt and delisted have partial-year returns. Survivors in the distress zone are the ones that bounced back.
Takeaway
The Altman Z-Score is a bankruptcy prediction model, not a stock-picking model. On US large caps from 2000 to 2025, safe-zone stocks returned 5.6% annually. The S&P 500 returned 7.3%. Distress-zone stocks returned 6.5%, beating the "safe" ones. The spread was negative in four out of five half-decades.
If you want to use the Z-Score, use it as one input in a multi-factor screen, not as a standalone strategy. The advanced screen above (Z-Score + Piotroski + ROE + low leverage) is a better starting point. Or use it the other way: as a risk flag on companies you already own, not as a buy signal for companies you don't.
The Z-Score tells you which companies won't go bankrupt. It doesn't tell you which ones will beat the market. Those are different questions with different answers.
References
- Altman, Edward I. "Financial Ratios, Discriminant Analysis and the Prediction of Corporate Bankruptcy." Journal of Finance, 1968.
- Altman, Edward I. "Predicting Financial Distress of Companies: Revisiting the Z-Score and ZETA Models." Stern School of Business, NYU, 2000.
- Dichev, Ilia D. "Is the Risk of Bankruptcy a Systematic Risk?" Journal of Finance, 1998.
Data: Ceta Research (FMP financial data warehouse), 2000-2025. Full methodology: backtests/METHODOLOGY.md
Past performance does not guarantee future results. This is educational content, not investment advice.


