
Altman Z-Score Tested on 13 Exchanges: Where Distress Actually Destroys Value
We tested the Altman Z-Score across 13 exchanges with local benchmarks. India +7.8% spread, South Africa +4.0%. UK +4.8% vs FTSE, Switzerland +4.6% vs SMI. The pattern maps onto where distress destroys equity value and where local benchmarks are weak enough that safe stocks outperform.

The Altman Z-Score is one of the most cited bankruptcy predictors in finance. We tested it as a stock selection signal across 13 exchanges covering 25 years of data. When measured against local market benchmarks, the picture is more nuanced than the standard "works in EM, fails in DM" narrative.
Contents
- Part of a Series
- Method
- The Full Results Table
- Where It Works (and Why)
- Where It Fails
- The Middle Ground
- What This Tells Us
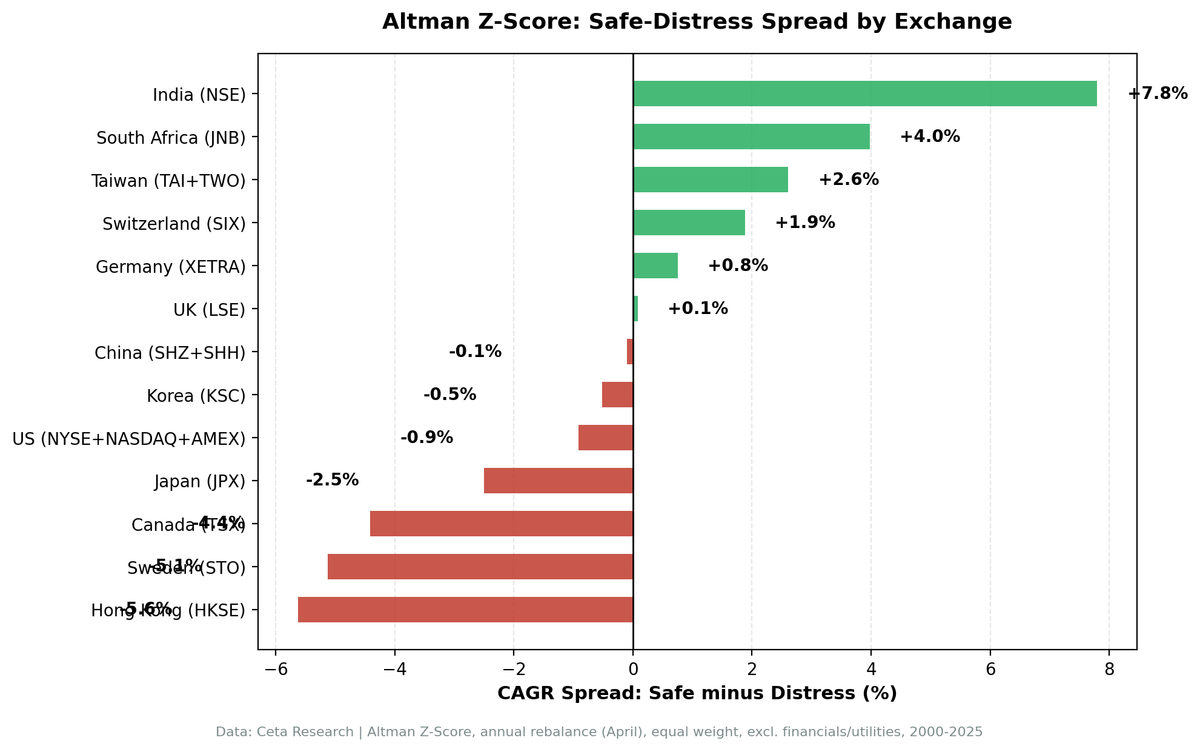
India stands alone with a +7.8% safe-distress spread. South Africa, Taiwan, and Switzerland are positive. Germany and the UK beat their local benchmarks even where the spread is flat. Japan, Sweden, and Canada show positive avoidance alpha despite negative spreads. The clear losers: the US and Hong Kong vs their local markets.
The pattern maps onto where financial distress actually destroys equity value versus where the capital market system keeps distressed companies alive long enough to recover.
Data: FMP financial data warehouse, 2000-2025. Updated June 2026.
Part of a Series
This is the multi-exchange comparison for the Altman Z-Score backtest. The single-exchange US analysis covers the methodology in detail, including the five-variable formula, zone definitions, and sector-level breakdowns.
Method
| Parameter | Value |
|---|---|
| Signal | Altman Z-Score (5-variable model, EBITDA variant) |
| Zones | Safe (Z > 2.99), Distress (Z < 1.81) |
| Z computation | Manual from raw FY balance sheet + income statement + market cap |
| Portfolio | All qualifying stocks per zone, equal weight |
| Rebalancing | Annual (April 1, after filing season) |
| Filing lag | 45 days (point-in-time) |
| Execution | MOC (next-day close) |
| Transaction costs | 0.1-0.5% per trade (size-tiered) |
| Exclusions | Financials and utilities |
| Period | 2000-2025 |
| Data source | Ceta Research (FMP financial data warehouse) |
| Exchanges | 13: US, India (NSE), UK, XETRA, SIX, STO, TSX, HKSE, KSC, TAI, SHH+SHZ, JNB, JPX |
| Market cap filter | Exchange-specific thresholds (point-in-time) |
| Benchmark | Local index per exchange (Sensex for India, DAX for Germany, SMI for Switzerland, etc.) |
Each exchange uses a local currency benchmark for accurate alpha measurement. Sensex for NSE, DAX for XETRA, SMI for SIX, KOSPI for KSC, TAIEX for TAI, Hang Seng for HKSE, OMX Stockholm for STO, Nikkei 225 for JPX, TSX Composite for Canada, FTSE 100 for UK. South Africa (JNB) uses SPY as fallback (no local index available in FMP data). Z-Scores are computed from raw annual financials to ensure point-in-time accuracy.
The Full Results Table
Sorted by safe-distress spread (best to worst). Excess return measured against local benchmark:
| Exchange | Safe CAGR | Distress CAGR | Spread | Local Bench | vs Local | Avoidance Alpha | Max DD | Avg Safe |
|---|---|---|---|---|---|---|---|---|
| India (NSE) | 11.0% | 3.2% | +7.8% | Sensex 11.5% | -0.5% | -2.1% | -61.7% | 149 |
| JSE (South Africa) | 10.6% | 6.6% | +4.0% | SPY 7.3% | +3.3% | +3.3% | -48.2% | 13 |
| Taiwan | 2.2% | -0.4% | +2.6% | TAIEX 3.0% | -0.8% | -0.6% | -65.1% | 101 |
| SIX (Switzerland) | 6.6% | 4.8% | +1.9% | SMI 2.1% | +4.6% | +4.3% | -42.1% | 55 |
| XETRA (Germany) | 7.1% | 6.3% | +0.8% | DAX 4.5% | +2.5% | +2.8% | -33.1% | 121 |
| LSE (UK) | 6.0% | 5.9% | +0.1% | FTSE 1.1% | +4.8% | +5.4% | -38.0% | 184 |
| China | 4.0% | 4.1% | -0.1% | SSE 2.5% | +1.5% | +1.5% | -56.1% | 1046 |
| KSC (Korea) | 3.1% | 3.6% | -0.5% | KOSPI 4.4% | -1.4% | -0.4% | -49.6% | 65 |
| US | 5.6% | 6.5% | -0.9% | SPY 7.3% | -1.7% | -1.1% | -33.0% | 671 |
| JPX (Japan) | 4.5% | 7.0% | -2.5% | Nikkei 2.2% | +2.3% | +3.0% | -50.5% | 213 |
| Canada | 3.8% | 8.2% | -4.4% | TSX 4.0% | -0.3% | +1.3% | -37.1% | 75 |
| STO (Sweden) | 3.7% | 8.8% | -5.1% | OMX 2.4% | +1.3% | +3.5% | -65.9% | 38 |
| HKSE (Hong Kong) | -2.6% | 3.0% | -5.6% | HSI 1.3% | -3.9% | -1.5% | -61.4% | 154 |
Spread = Safe CAGR minus Distress CAGR. Positive means safe-zone stocks outperformed distress-zone. vs Local = Safe CAGR minus local benchmark CAGR. Positive means safe zone beat the market. Avoidance Alpha = return improvement from removing distress-zone stocks from the full universe vs local benchmark.
Where It Works (and Why)
When measured against local benchmarks, the Z-Score shows value in three distinct ways: spread (safe beats distress), selection (safe beats the local market), and avoidance (removing distress adds value). Most exchanges show one or two of these. Only a few show all three.
The widest spread: India (+7.8%):
India is the only exchange with a safe-distress spread above +6%. South Africa (+4.0%), Taiwan (+2.6%), and Switzerland (+1.9%) follow. These tend to be markets where financial distress leads to genuine equity destruction, not turnaround stories.
India (NSE): 149 safe-zone stocks vs 38 distress-zone stocks, with a +7.8% annual spread sustained over 25 years. Safe zone returned 11.0% CAGR. Distress zone returned 3.2%. The Sensex returned 11.5%. The Z-Score in India is a distress detector, not a market-beating signal. Safe zone roughly matched the market. Distress zone collapsed against it. The spread is the value here: companies below Z = 1.81 delivered 8.3% less per year than the market.
South Africa: Safe zone returned 10.6% vs distress at 6.6%, both measured in ZAR. The +3.3% avoidance alpha (removing distress from the full universe) is solid, but the universe is tiny (13 safe stocks on average) and South African price data is noisier than developed markets, so treat the result as suggestive rather than precise.
Best Selection Signals (safe beats local market by > 2%):
UK (+4.8% vs FTSE), Switzerland (+4.6% vs SMI), Germany (+2.5% vs DAX), and Japan (+2.3% vs Nikkei) all show safe-zone stocks outperforming their local benchmarks, even where the safe-distress spread is flat or negative.
Switzerland: Safe zone 6.6% vs SMI 2.1%. The Swiss market had the lowest benchmark CAGR of any developed market tested. Safe-zone Swiss stocks captured quality mid-tier names that outperformed the mega-cap-dominated SMI. Spread is +1.9%, and avoidance alpha is +4.3%.
UK: Safe zone 6.0% vs FTSE 1.1%. The avoidance alpha is +5.4%, the highest of any exchange, meaning removing distress-zone UK stocks added 5.4% annually vs a very weak FTSE. The safe-distress spread is essentially flat (+0.1%), but selection against the local benchmark is strong. Exclude the worst, keep everything else.
Where It Fails
Five exchanges show clearly negative safe-distress spreads: US (-0.9%), Japan (-2.5%), Canada (-4.4%), Sweden (-5.1%), Hong Kong (-5.6%). In these markets, distress-zone stocks outperformed safe-zone stocks.
This isn't noise. It's a structural pattern.
Distressed stocks become cheap options. In developed markets with deep capital markets, distressed companies don't just die. They restructure, get acquired, issue equity, sell assets, or find a white knight. The subset that survives generates massive returns that pull up the group average. Investors who buy distress-zone stocks in the US are essentially buying a basket of options: most expire worthless, but the payoffs from survivors compensate.
The US: Safe-zone stocks returned 5.6% CAGR while distress-zone stocks returned 6.5%. The Z-Score's safe zone (671 stocks on average) underperformed distress (274 stocks). Both lagged SPY at 7.3%. The avoidance alpha is -1.1%, meaning excluding distress still hurt returns vs SPY.
Canada: Spread is -4.4%. Resource-heavy markets (mining, oil and gas) naturally push many companies into the distress zone due to high leverage and cyclical earnings. When commodity prices recover, those distressed miners and drillers rocket higher. Safe zone returned 3.8% vs distress at 8.2%. Both roughly tracked the TSX at 4.0%.
Sweden and Hong Kong: The extremes at -5.1% and -5.6% spreads respectively. Small universes amplify survivor bias. Sweden averages 38 safe stocks. Hong Kong's safe-zone CAGR was -2.6%, one of the worst absolute performances for any "safe" portfolio tested. The Hang Seng returned 1.3%, so even safe zone underperformed by 3.9%.
The Middle Ground
Germany, China, and Korea cluster near zero spread but show mixed excess vs local benchmarks. Taiwan posts a positive spread yet still trails its index.
Germany: +0.8% spread (safe 7.1%, distress 6.3%), with +2.5% excess vs DAX and +2.8% avoidance alpha. The DAX returned only 4.5%, so German safe-zone stocks beat the local market and edged out distress. Mittelstand companies (mid-sized industrials) tend to cluster in the gray zone, making the safe/distress distinction less clean.
China: -0.1% spread, but +1.5% excess vs SSE Composite (2.5%). State-owned enterprises don't go bankrupt in the traditional sense. Government support and policy-driven bailouts neutralize the Z-Score's distress signal. A Chinese company with Z < 1.81 might be perfectly safe if it has political backing.
Korea: -0.5% spread, and -1.4% vs KOSPI (4.4%). Chaebol-dominated markets carry high leverage by design. Large conglomerates land in the distress zone but rarely face genuine bankruptcy risk due to cross-guarantees.
Taiwan: +2.6% spread, but -0.8% vs TAIEX (3.0%). Tech-heavy exchange where leverage and cash burn are common among eventual winners. The Z-Score flags fast-growing semi companies as distressed, then those companies outperform as they scale.
What This Tells Us
The Altman Z-Score is a bankruptcy predictor, not a universal stock signal. Measuring against local benchmarks reveals where that distinction matters.
Where bankruptcy destroys equity value (India, South Africa): The Z-Score works exactly as intended. It identifies companies at risk of financial distress, and those companies deliver poor returns because some actually go bankrupt. India's +7.8% spread is the widest of any exchange, and distress-zone stocks underperformed the Sensex by 8.3% annually. South Africa shows a similar pattern at a +4.0% spread, though on a tiny universe.
Where capital markets keep distressed companies alive (US, Canada): The Z-Score's distress signal becomes a contrarian indicator. Distressed companies that survive restructuring deliver outsized returns. US distress zone returned 6.5% vs safe at 5.6%. Canada's spread is -4.4%. Both portfolios lagged their local benchmarks.
Where local benchmarks are weak (UK, Switzerland, Germany, Japan): Safe-zone stocks beat the local market even when the spread is flat or negative. UK +4.8% vs FTSE, Switzerland +4.6% vs SMI, Germany +2.5% vs DAX, Japan +2.3% vs Nikkei. These markets show the value of local comparisons. Against SPY, they all looked mediocre. Against their own indices, they outperformed.
Practical takeaways:
Emerging markets: Use Z-Score as a filter. Remove distress-zone stocks (Z < 1.81) from your universe. The spread is real and persistent.
Developed markets with weak local benchmarks (Switzerland, UK): Safe zone beats the market. Use Z-Score for selection or avoidance depending on the specific market dynamics.
US/Canada: Don't use Z-Score for stock selection. The signal inverts. Use Piotroski or ROIC screens instead.
SOE/chaebol markets (China, Korea): The Z-Score is noise. Government backing neutralizes distress signals.
Data: Ceta Research (FMP financial data warehouse), 2000-2025. Full methodology: backtests/METHODOLOGY.md
Past performance does not guarantee future results. This is educational content, not investment advice.


