Altman Z-Score Backtest on Brazilian Stocks: Safe Zone Beats Distress by 6.4% Annually
Altman Z-Score on SAO exchange stocks from 2000 to 2025. Safe zone: 11.1% CAGR. Distress zone: 4.7% CAGR. The all-ex-distress portfolio returned 13.1% CAGR, 4.5% above Bovespa. High interest rates make distress more punishing in Brazil.

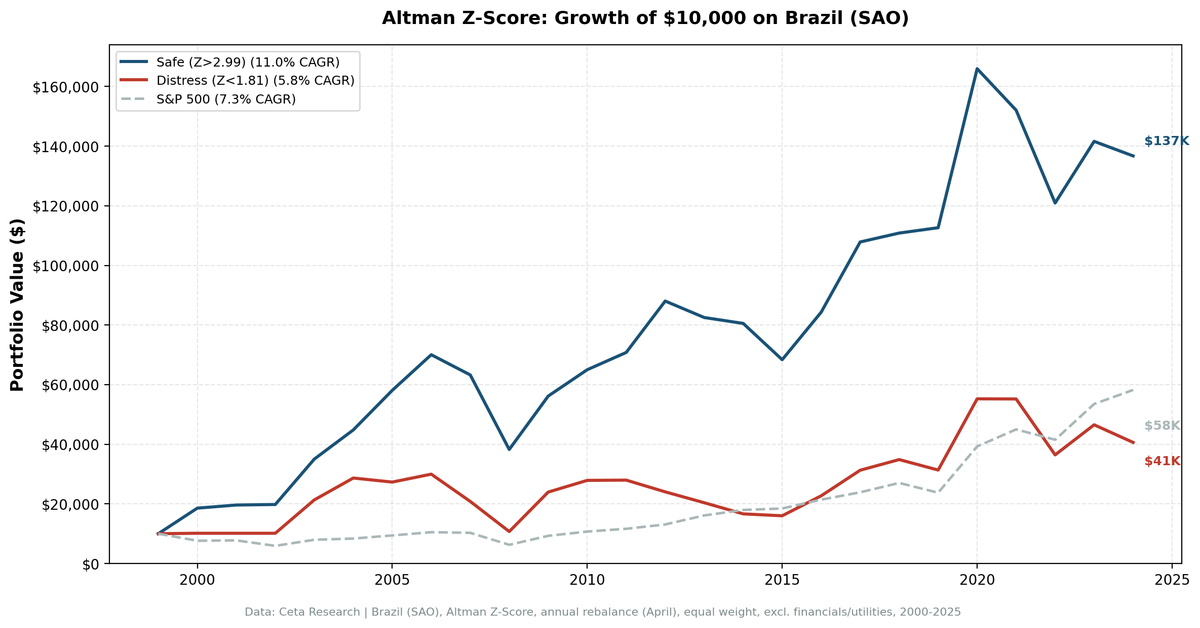
Brazilian companies in financial distress returned 4.7% annually over 25 years. Companies in the safe zone returned 11.1%. That's a 6.4% annual spread, and it held across two decades of commodity booms, currency crises, and political upheaval. The Z-Score works in Brazil. More precisely, avoiding distress works in Brazil.
Contents
- Method
- What We Found
- The Avoidance Signal
- The Sharpe Ratio Caveat
- Why Brazil
- A Smaller Universe
- The Screen
- Limitations
- Takeaway
We tested all three Altman Z-Score zones on the SAO exchange from 2000 to 2025. The strongest finding was the all-ex-distress portfolio: remove the worst companies by Z-Score, keep everything else, and you get 13.1% CAGR with a -42.8% max drawdown. That's 4.5% above the Bovespa benchmark.
Part of a series. See the US backtest for methodology and the Z-Score formula.
Data: FMP financial data warehouse, 2000–2025. Updated March 2026.
Method
| Parameter | Value |
|---|---|
| Universe | SAO (B3, Sao Paulo Stock Exchange) |
| Market cap floor | R$1B (~$200M USD) |
| Period | 2000-2025 (25 years) |
| Rebalancing | Annual (April 1) |
| Weighting | Equal weight |
| Exclusions | Financial Services, Utilities |
| Benchmark | Bovespa (local, BRL-denominated) |
| Execution | MOC (next-day close) |
| Data | BRL-denominated financials, FMP via Ceta Research warehouse |
The Z-Score formula is identical to the US version:
Z = 1.2(WC/TA) + 1.4(RE/TA) + 3.3(EBITDA/TA) + 0.6(MktCap/TL) + 1.0(Rev/TA)
Zones: Safe (Z > 2.99), Gray (1.81 to 2.99), Distress (Z < 1.81). Financial Services and Utilities are excluded because the Z-Score wasn't designed for their balance sheet structures.
All data is BRL-denominated. Returns are in local currency. The S&P 500 benchmark is USD-denominated, so comparisons reflect strategy returns in their native market against a global benchmark.
What We Found
| Portfolio | CAGR | Max Drawdown | Avg Stocks |
|---|---|---|---|
| Safe Zone (Z > 2.99) | 11.1% | -43.3% | 30 |
| Gray Zone (1.81-2.99) | 13.3% | -50.9% | 25 |
| Distress Zone (Z < 1.81) | 4.7% | -55.4% | 28 |
| All ex-Distress | 13.1% | -42.8% | -- |
| Bovespa | 8.6% | -- | -- |
Safe-Distress spread: +6.4% annually.
The safe zone outperforms distress by 6.4% per year. The gray zone (13.3% CAGR) outperformed both. In Brazil, the Z-Score doesn't rank stocks in a linear fashion. The real separation is between distress (Z < 1.81) and everything else. Companies above the distress threshold all perform similarly. Companies below it drag.
The Avoidance Signal
The all-ex-distress portfolio returned 13.1% CAGR with a -42.8% max drawdown. That's 4.5% above the Bovespa and better than the safe zone alone. Removing the bottom tier and keeping everything else (safe + gray) produced the strongest outcome.
This makes intuitive sense. The safe zone averaged 30 stocks per year. The gray zone averaged 25. Combining them into a single "not distressed" portfolio gives roughly 55 names with better diversification. The gray zone companies aren't junk. They're mid-tier on financial health, and in Brazil's market, that's enough to outperform.
The Sharpe Ratio Caveat
The safe zone Sharpe ratio is 0.019. That looks low. It's misleading: Brazil's risk-free rate (Selic) averaged above 10% for most of this period. The Sharpe formula subtracts the risk-free rate from returns, so even an 11% CAGR produces near-zero Sharpe when the benchmark rate is 10.5%. The 4.5% excess return over the Bovespa is the more useful comparison.
Why Brazil
Three features of the Brazilian market make the Z-Score particularly relevant.
High interest rates. Brazil's Selic rate has spent most of the last 25 years above 10%, peaking above 25% in 2003. High base rates make debt expensive. Companies in the distress zone carry heavy liabilities, and servicing those liabilities at Brazilian rates drains cash faster than in low-rate environments like the US or Europe. The punishment for financial distress is amplified.
Commodity exposure. Brazil's equity market is heavily weighted toward commodities: mining (Vale), oil (Petrobras), agriculture, and steel. These are capital-intensive industries with volatile earnings. A commodity downturn can push a marginally healthy company into distress quickly. The Z-Score catches this because EBITDA/TA (the highest-weighted component) drops when commodity prices fall.
Currency volatility. The BRL has experienced multiple sharp depreciations against the USD. Currency moves affect the Z-Score through two channels: companies with USD-denominated debt see total liabilities spike in BRL terms, pushing MktCap/TL lower. And import-dependent businesses see costs rise, compressing EBITDA/TA. Both effects push companies toward distress during currency stress.
A Smaller Universe
The SAO exchange is smaller than the NYSE or NASDAQ. After applying the R$1B market cap floor and excluding Financials and Utilities, the qualifying universe averaged about 84 companies per year. That's split roughly into 30 safe, 25 gray, and 29 distress.
Thirty stocks in the safe zone is enough for a portfolio, but it's concentrated. A bad year for one or two large holdings has an outsized impact. The all-ex-distress approach mitigates this by roughly doubling the portfolio size.
For investors used to US-scale universes of 500+ qualifying companies, Brazil requires adjusting expectations on diversification. The signal works, but the sample is thin enough that single-stock risk matters.
The Screen
SELECT s.symbol, p.companyName, s.altmanZScore,
    k.marketCap / 1e9 AS market_cap_b_brl, p.sector
FROM scores s
JOIN key_metrics_ttm k ON s.symbol = k.symbol
JOIN profile p ON s.symbol = p.symbol
WHERE s.altmanZScore > 3.0
  AND s.altmanZScore < 100
  AND k.marketCap > 1000000000
  AND p.exchange = 'SAO'
  AND COALESCE(p.sector, '') NOT IN ('Financial Services', 'Utilities')
QUALIFY ROW_NUMBER() OVER (PARTITION BY s.symbol ORDER BY k.marketCap DESC) = 1
ORDER BY s.altmanZScore DESC
LIMIT 30
Limitations
Small sample. Roughly 30 safe-zone stocks per year on SAO. Statistical confidence is lower than a US backtest with hundreds of qualifying names. Individual stock outcomes have more influence on portfolio returns.
BRL volatility. Returns are in local currency. An international investor takes currency risk on top of equity risk. BRL depreciated substantially against USD over this period. The 11.0% CAGR in BRL terms would be lower in USD.
Commodity concentration. Even after the quality screen, Brazil's non-financial equity market is tilted toward materials, energy, and industrials. The portfolio doesn't have the sector diversity you'd find in a US or European safe-zone portfolio.
Altman's original weights. The five-variable model was calibrated on 1960s US manufacturing firms. Applied to Brazilian companies with different accounting standards, capital structures, and industry mixes, the zone thresholds may not map perfectly. The directional signal (safe beats distress) holds, but the precise cutoffs of 1.81 and 2.99 are approximations.
Annual rebalance lag. A company can deteriorate from safe to distress between rebalance dates. In a market with Brazil's volatility, that transition can happen fast. Annual rebalancing misses intra-year shifts.
Takeaway
The Altman Z-Score separates winners from losers on the SAO exchange. The spread is 6.4% annually over 25 years. Brazil's high interest rates and commodity-driven economy make financial distress more punishing than in lower-rate markets, which amplifies the signal.
Use the Z-Score as a filter, not a stock picker. Remove distress-zone companies from whatever portfolio you're running. The all-ex-distress approach returned 13.1% CAGR, 2.0 points above the safe zone alone and 4.5% above the Bovespa, with better diversification across a small exchange.
Data: Ceta Research (FMP financial data warehouse), 2000-2025. Full methodology: backtests/METHODOLOGY.md